Introduction
Pharmaceutical counterfeiting has become a major issue in the recent decade in developing countries [1]. It has also placed a significant pressure on the assurance of supply chain integrity in developed countries due to increasing international trade and sales via the internet [2]. It is believed that this criminal business could reach $75 billion dollar this year worldwide, a 92 % increase from 2005 [3]. Due to this, pharmaceutical manufacturers are finding ways to fight counterfeit and substandard drugs by authenticating and identifying their products by various technologies right from the manufacturing and all the way through the supply chain. These include watermarks, barcodes, RFID tags, holograms or covert patterns applied by special printing inks on packaging and on the pharmaceutical product [4]. Unfortunately, these measures, when applied to the packaging, have the ability to be forged, much like the pharmaceutical product itself, and have limited ability to overcome the sophisticated counterfeits [5].
One of the effective ways to authenticate and verify the identity of a pharmaceutical product is by using state-of-the-art analytical technologies, such as Near-Infrared (NIR) and Raman spectroscopy to obtain a unique spectral “fingerprint” of the drug product itself. Once these fingerprints are developed, they can be used to evaluate a suspect sample to determine if it is indeed a counterfeit. Technological advancements in Micro-Electromechanical Systems (MEMS) for NIR [6], and in the telecommunication laser industry for Raman [7], along with advances in optical and detector components miniaturization for both, have led to drastic reductions in size of these spectrometers which have made them portable. Also, advances in chemometrics and data analysis software have aided the adaptation of these technologies for portable (handheld) use.
One of the greatest advantages of these portable units is to take the ‘lab’ closer to the areas where it would be advantageous for counterfeit detection to occur in real time, such as deceitful manufacturing facilities, pharmacies, hospitals, warehouses and storage facilities etc. This can provide a level of analytical control in the drug distribution chain, from the manufacturing floor to the retail pharmacies. Pharmaceutical companies and local police and law enforcement agencies can work together by using these portable devices to detect counterfeits in the field. Samples can be analyzed rapidly in a non-destructive manner on-location and the results can be obtained within minutes. This can potentially help agencies to take immediate follow up steps in the form of seizures or to close down the counterfeit operations in a rapid manner. This is critical since the time taken for samples to be sent to remote testing facilities can be long enough to allow unscrupulous counterfeiters to flee the site and re-establish operations elsewhere.
Even though there are other handheld spectrometers, such as mid-IR and portable X-ray units, this article focuses only on the applications of portable NIR and Raman spectrometers, both based on vibrational spectroscopy, for the identification of pharmaceutical counterfeits and for authenticating legitimate product. Both types of devices have found inroads into the pharmaceutical industry mainly in Quality Control for raw material identification, and have recently been utilized for counterfeit drug identification [8].
NIR and Raman Spectroscopy for Counterfeit Detection
Both Raman and NIR are vibrational spectroscopic techniques that provide information on molecular bond vibrations of various functional groups that are characteristic with welldelineated absorption bands, and are therefore viable for spectral fingerprinting of pharmaceutical drug products [9]. Both techniques are rapid, nonintrusive and nondestructive, and can be used for the analysis of many classes of pharmaceutical dosage forms. The nonintrusive nature of both techniques makes it feasible to analyze a drug product directly through the packaging, such as bottles or blisters, and through capsule shells for encapsulated products. Once a suspect sample has been identified as a counterfeit, the nondestructive nature of both techniques aid in preserving samples for further investigative work if needed, and can allow the intact sample to be presented in a court of law as evidence, if an action is warranted. The following sections provide some details on the strategy that can be applied to develop NIR and Raman spectral fingerprints for counterfeit detection.
(a) NIR
NIR allows probing of overtones and combination bands of fundamental vibrations in molecules and functional groups such as OH, NH and CH that are present in most pharmaceutical active ingredients and excipients [10]. NIR spectral bands from these overtone and combination bands are weak and broad and therefore are not typically used for structural elucidation. With advances in the optical design of portable NIR spectrometers, even these weak and broad spectral signals are turned into useful spectral fingerprint information. Also, the inherent broad spectral signal does not require a high spectral resolution instrument, and therefore, portable units, which are 8 to 12 nm in spectral resolution, can be used for counterfeit detection.
Even though the NIR technique works in both transmittance and reflectance modes, the portable units are designed only in the reflectance mode. The reflectance signal collected in NIR is diffuse reflectance in nature, and therefore probes both the surface and subsurface of a tablet, capsule powder etc. Typically, the depth of penetration depends on the nature of the surface, such as the coating and color, and physical parameters, such as hardness and particle size; but these portable units generally probe more than 100 micron or so, which is sufficient to provide a spectral fingerprint of the drug product as a whole and not only the surface material.
Due to the multivariate NIR spectral data, combined with broad spectral bands, data pretreatment is typically necessary to convert the raw data into useful spectral fingerprint information for counterfeit detection. The following data pretreatment types are typically used for NIR.
(a) Baseline Offset
(b) Baseline Linear
(c) Normalize Maximum
(d) Normalize Range
(e) Normalize Range Center
(f) Normalize Unit Vector
(g) Derivative – Savitzky Golay (S. Golay)
(h) Standard Normal Variate (SNV)
(i) Multiplicative Scatter Correction (MSC)
In our experience, for counterfeit identification, we require a normalization process (typically (f)) and either a first or second derivative (S. Golay) followed by a spectral smoothing as a pretreatment of data. Identification and authentication of the drug product from the pretreated spectral data can be performed in two ways: Spectral Match Correlation and Principal Component Analysis (PCA).
Spectral matching compares the shape of each pre-treated sample spectrum with each pre-treated spectrum in the library that is created from the authentic samples and assigns a degree-of- match correlation value ranging from +1 (perfect match) to -1 (perfect anti-match) using chemometric algorithms. If an authentic product is tested and compared against the library spectrum, the match value should be close to +1.
The threshold match value for the identification of authentic vs. counterfeit can be determined during the development of the spectral signature using several authentic batches of samples and also by testing potential counterfeits. Sometimes, this is not practical since obtaining counterfeits is not always possible. In this case, authentic samples can be stressed using extreme conditions, such as high temperature and humidity to alter or degrade the material if possible, and the match values for these samples can be evaluated to determine a useable threshold. The NIR spectrum is often sensitive to physical and chemical characteristics of the product and therefore, highly stressed conditions of authentic samples can result in changes in the physical properties, such as hardness and even changes to the coating in the case of coated tablets. Chemical changes may include degradation of the drug product which might reflect in the spectral features. In our experience, we have noticed that extreme stress conditions, such as 60 °C combined with 75% relative humidity for an extended period has resulted in samples whose match values were below ~ 0.8. If placebo samples are available, one can also use them to aid in determination of match value threshold. In any case, the match threshold is ideally determined by testing it on both positive (authentic) and negative samples (such as counterfeits, highly stressed samples and placebo).
PCA is a method that can be used for reducing the multivariate spectral data down to just a few important variables called principal components (PCs), also referred to as latent variables, eigenvectors, factors, etc. [11]. The dot product of these vectors with the original spectral data yields scalars called “PC scores”. Unknowns or counterfeits can oftentimes be identified by comparing their PC scores against those of authentic materials. Typically, the first two PC scores, which contain maximum useful information, are plotted for both the authentic and suspect products to ascertain their degree of separation in this plot. The greater the data points of the PC scores for suspect samples are separated from the authentic samples, the greater the chances are that they are not authentic. Examples of PC score plots are given later in this article.
(b) Raman
Raman spectroscopy is used to study fundamental modes of molecular vibrations [12] using a monochromatic light, usually a laser. The laser light interacts with the sample, in this case a pharmaceutical product, and the scattered radiation is detected to gather information on the product under interrogation. The scattered light is both elastic and inelastic in nature, with the inelastic, or Raman scattering being the one that carries information on the bond vibrations and functions used for spectral fingerprint. This inelastic scattering is of low efficiency (similar to weak signals in NIR) which acts as an advantage for obtaining spectral fingerprint information without the need for sample dilution or preparation. The spectral information obtained is highly selective and the peaks are sharper than NIR, and thus require little or no data pretreatment. Similar to NIR, peaks arising from functional groups such as OH, NH and CH that are present in most pharmaceutical active ingredients and excipients comprise the spectral fingerprint for the pharmaceutical product.
With developments in fiber optics, filters, diode lasers, detectors and data analysis software, Raman spectrometers, have also moved from the laboratory environment to the field in the form of portable units. Although these portable units are typically of lower spectral resolution compared to bench-top FT units, 7 to 10 cm-1 as compared to 4 cm-1 or better, they are still very useful for counterfeit detection.
Similar to NIR, identification and authentication of drug products can be done by spectral matching of samples under interrogation against the authentic product. In the portable unit we use, the match value for the spectral comparison is given by a probability p-value. The p-value for spectral identification is a measure of how likely the Raman spectrum of a test sample is matched to the signature spectrum or reference spectrum.
Typically, a p-value less than 0.05 indicate that the sample spectrum has significant differences to that of the reference (fingerprint) spectrum. In this case, the sample may be considered as non-authentic. Conversely, for p-values greater than 0.05, it would be assumed that the spectra are sufficiently similar to indicate a match. In our experience, while this maybe true for raw material identification, it was found not to be the case for counterfeit detection of product. Similar to NIR match value threshold, the p-value threshold for Raman needs to be evaluated for each authentic product using multiple samples from different batches, and the threshold needs to be estimated individually for each product. One way to estimate the p-value threshold is to test the Raman fingerprint of authentic product on placebo samples and also on generic versions of a given product, if available. We have noted that for some generics, the p-values were greater than 0.05 against the authentic branded product fingerprints, which leads us to believe that the threshold of 0.05 may not be appropriate, and a higher threshold may be needed depending on the product.
Nevertheless, a testing protocol and procedure should be put in place to evaluate and determine the spectral match threshold for NIR and p-value threshold for Raman for product authentication and counterfeit identification. This procedure should include a detailed evaluation of the results from various batches of the pharmaceutical product and between different portable NIR and Raman units from the same vendor and also the day-to-day variability in results. One can follow some of the industry guidelines that are available in the literature for this purpose [13 - 15].
Analysis of Counterfeit Capsule
Two suspect capsule samples were tested using both NIR and Raman portable spectrometers. It was known from previous tests that these suspect samples, which had the same packaging and appearance of that of an authentic product, did not contain the active ingredient and proper excipients as the authentic product. Therefore, they will be referred to as “counterfeit” samples in this article. Both the authentic and counterfeit capsules were tested as is, through the blister pack using both techniques. The following sections detail the results obtained.
(a) NIR
 For the purpose of this study, the authentic spectral library for NIR was developed from one batch by scanning three spectra from one capsule. It should be noted that the development of a NIR spectral signature should normally be based on more than one batch and also multiple capsules from each batch to accommodate batch-to-batch and within-batch variations. We were restricted in this case due to limited availability of authentic material. Three spectra were collected from a second authentic capsule to check the match values and four spectra were collected from each counterfeit sample.
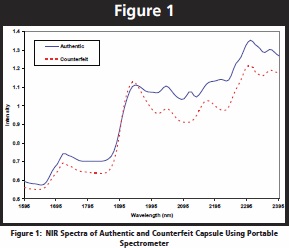
The NIR spectra of the authentic and counterfeit samples are shown in Figure 1.
Only one spectrum is given for each type of sample tested for clarity purposes. It is clear that the counterfeit sample spectrum is quite different from that of the authentic sample. For spectral match and for the PCA plot, the raw data were pre-treated by applying S.Golay second derivative and normalization of unit vector followed by smoothing. The average spectral match values from the three scans for the authentic capsule and the average from four scans for each counterfeit capsule are given in Table 1.
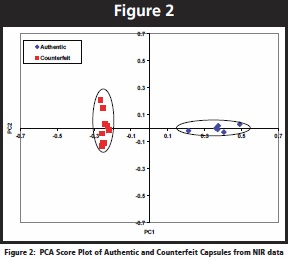
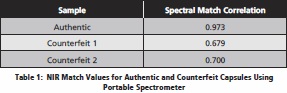 It is clear that the match values for the counterfeit samples are much lower than the authentic capsule. This is also evident from the PCA score plot which is shown in Figure 2.
The PC scores for the counterfeit sample spectra are well separated from the authentic ones, each group of spectra being clustered together for the two types of samples. The ellipse around each group of sample data is given for clarity purpose only and does not represent any statistical limit.
It is noteworthy to point out that the time needed to develop the signature and test the authentic and counterfeit samples was less than 10 minutes. The scanning time to obtain the spectra was less than a minute, with the remaining time spent on data pretreatment and for development of the PCA score plot.
(b) Raman
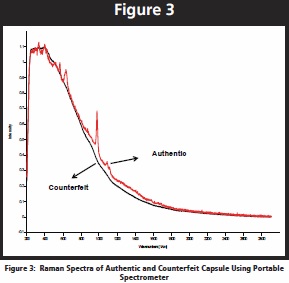
The Raman spectra of these same authentic and counterfeit capsules are shown in Figure 3.
 For the library spectrum, one authentic capsule spectrum was generated and both the counterfeit capsules were tested against this library spectrum. Only one spectrum is given for each type of sample tested for clarity purposes. It is clear that the counterfeit capsule sample has no Raman features and is different from the authentic library spectrum. Also, the p-values for the counterfeit capsules were found to be less than 0.05, which is the default threshold for a product match in the portable unit. Again, it is noteworthy to point out that it took about 20 minutes to obtain the spectral signature library spectrum and only 2 minutes to obtain the spectra for the counterfeit product.
Analysis of Counterfeit Powder
 In a second study, one suspect powder sample vial along with one authentic sample was analyzed using the portable NIR and Raman spectrometers. As in the case of the counterfeit capsule analysis, the suspect samples had been tested previously and were known to be counterfeit. For both techniques, the samples were analyzed as is, without opening the vial, and the scans were performed through the bottom of the glass vial. Both the NIR and Raman results are given in the following sections.
(a) NIR
For the NIR part of the analysis, two generic samples were also analyzed along with the counterfeit and authentic samples. Six scans from the authentic sample were collected and were used to create the authentic spectral fingerprint. For both the counterfeit and generic samples, six scans were collected and compared against the spectral fingerprint for match values. Since a second authentic sample was not available, spectra collected only from generic and suspect samples were used for the determination of match values.
The NIR spectra of the counterfeit sample along with those of the generics and the authentic sample are shown in Figure 4.
 Only one representative spectrum is given for each type of sample for clarity purposes. It is clear from Figure 4 that the counterfeit sample spectrum is markedly different from that of the authentic one and the generic sample spectra are similar, but not identical to the authentic one. As before, for spectral match and the PCA plot, the raw data was pre-treated by applying S. Golay second derivative and normalization of unit vector followed by smoothing. The match values for the counterfeit and generic samples are given in Table 2.
It is clear that the match value for the counterfeit sample is substantially lower than that of the generics. The PC score plot for the authentic sample along with that of the generics and counterfeit samples is given in Figure 5.
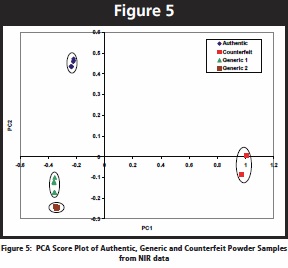 Again, the PC score plot clearly shows that the counterfeit sample data are well separated from the authentic and generics. The generic sample data are also grouped separately from the authentic and counterfeit sample showing that the PC score plot can differentiate these kinds of samples.
The time it took to develop the signature and to test the authentic and counterfeit samples was similar to that of capsule samples analysis.
(b) Raman
The Raman spectra for the authentic and counterfeit powder samples are given in Figure 6.
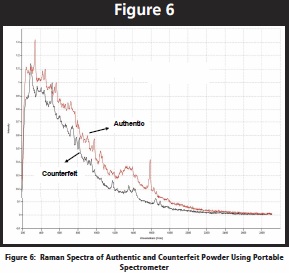 It is clear that the counterfeit powder sample has different Raman features when compared to that of the authentic library spectrum. Also, the p-value for the counterfeit powder was again found to be less than 0.05, which is the threshold for any product in the portable unit. The analysis times for these samples were similar to those of the capsule sample analysis.
The above two examples clearly demonstrate that portable NIR and Raman spectrometers can be used to rapidly evaluate the authenticity of suspect samples.
Conclusion
As counterfeit drugs threaten to infiltrate the legitimate supply chain, there is an ever increasing need to find ways to rapidly detect their presence using various means. One effective way to identify them is by using portable spectrometers, such as NIR and Raman to obtain a spectral “fingerprint” of the authentic product itself, so that suspect products can be screened quickly to determine whether they are counterfeits. The results in this article demonstrate that this can be accomplished with no destruction of the product, i.e., samples analyzed through the packaging such as bottles and blister packaging. These portable devices were found to be easy to use with minimum user training required and the results were obtained within a few minutes. They can be potentially utilized as a screening tool in the field by non-scientific personnel, and the decision making process in identifying a counterfeit operation can be vastly improved in terms of time, cost and efficiency.
References
1. Paul N. Newton, Michael D. Green and Facundo M. Fernandez “Impact of poor-quality medicines in the ‘developing’ world, Trends in Pharmacological Sciences (2010), 31, 99 – 101.
2. Food and Drug Administration (FDA) website “Reporting Unlawful Sales of Medical Products on the Internet”, March 2010, http://www.fda.gov/Safety/ReportaProblem/ucm059315.htm
3. Counterfeit Medicines: The Silent Epidemic, The World Health Organization (WHO), 15 February, 2006, http://www.who.int/mediacentre/news/releases/2006/pr09/en/
4. Anti-Counterfeit Technologies for Protection of Medicines, The World Health Organization (WHO), March 2010, www.who.int/entity/impact/events/IMPACT-ACTechnologiesv3LIS.pdf
5. Donald G. McNeil Jr., The New York Times, February 20, 2007, http://www.nytimes.com/2007/02/20/science/20coun.html?_r=2&th&emc=th
6. Mouli Ramani, MEMS Technology Helps Redefine Traditional Chemical Analysis Methods, March 2010, http://www.scientificcomputing.com/mems-technology-helps-redefine.aspx#
7. T. Schneider, Non Linear Optics in Telecommunications, Springer-Verlag, Part III, Chapter 13, 343 – 367.
8. Andrew J. O’ Neil, Roger D. Jee, Ged Lee, Andrew Charvill and Anthony C. Moffat, Use of Portable Near Infrared Spectrometer for the Authentication of Tablets and the Detection of Counterfeit Versions, Journal of Near Infrared Spectroscopy, (2008), 16, 327 – 333.
9. Saly Romero-Torres, Jun Huang, and Pedro E. Hernandez-Abad, Practical Considerations on PAT Analyzer Selection– Raman vs. NIR Spectroscopy, American Pharmaceutical Review, December 2009, 12 – 19.
10. Yves Roggo, Pascal Chalus, Lene Maurer, Carmen Lema-Martinez, Aurekie Edmond and Nadine Jent, A review of Near Infrared Spectroscopy and Chemometrics in Pharmaceutical Technologies, Journal of Pharmaceutical and Biomedical Analysis, (2007), 44, 683 – 700.
11. Lindsay I. Smith, A Tutorial on Principal Component Analysis, February 26, 2002, www.cs.otago.ac.nz/cosc453/student_tutorials/principal_components.pdf
12. Slobodan Sasic and Sean Ekins, Pharmaceutical Applications of Raman Spectroscopy, Wiley, November 2007.
13. Guidelines For The Development and Validation of Near Infrared (NIR) Spectroscopic Methods, Pharmaceutical Analytical Sciences Group May 2001, www.pasg.org.uk/NIRmay01.pdf
14. United States Pharmacopeia (USP), USP 32 - NF 27, Chapters <1119> and <1120>.
15. European Pharmacopeia 5.0, Chapters 2.2.40 and 2.2.48.
Ravi Kalyanaraman is a Senior Scientist at Bristol-Myers Squibb Company in Analytical Technology group with Technical Operations. He received his Ph.D. in chemistry from the University of Idaho in 1996 and has been with Bristol- Myers Squibb since 2002. His recent work with Bristol-Myers Squibb has been focused on developing new and novel techniques to detect pharmaceutical counterfeits. His interests are mainly in using vibrational spectroscopic techniques, such as Raman and Near-Infrared (NIR) for pharmaceutical counterfeit detection and for product authentication. He is also a co-lead of an analytical team that is involved in the analysis of products received from complaints and from corporate security groups.
Michael Ribick is a Department Director at Bristol-Myers Squibb Co. He received his MA degree in Physical Chemistry from University of Missouri and has been with Bristol-Myers Squibb since 1983. His most recent work has been focused primarily with governing the development and validation of analytical procedures to support manufacturing and supply chain operations in the Bristol-Myers Squibb network. His department provides analytical expertise and support to site Quality Control Laboratories, Product Complaints, and Corporate Anti-Counterfeiting efforts. He is also responsible for the reference standard program that supports marketed products and is a member of the UPS Expert Committee on Reference Standards.
George Dobler is an Associate Director of Analytical Technology within the Bristol-Myers Squibb Co. Worldwide Quality and Compliance division. He received an MS in Chemistry from St. Joseph’s University and has 20 years of experience in the pharmaceutical industry in roles within Analytical R&D, Quality and Compliance, and Analytical Technology in support of technical operations activities and initiatives. His current role focuses primarily on providing analytical expertise in the areas of Technology Transfer, Product Complaints, Corporate Anti-Counterfeiting efforts, and support to company and third part Manufacturing and Testing sites.