PAT in Pharmaceutics
Process Analytical Technology (PAT) has been defined as a framework which allows the development of a comprehensive understanding of pharmaceutical manufacturing processes [1]. It emphasizes the employment of a series of tools such as analytical sensors, univariate and multivariate data analysis and information management systems which could be synchronized with the final goal of understanding, optimizing and even controlling manufacturing processes [2].
Even though many sensors or “process analyzers” could be implemented as PAT sensors, vibrational spectroscopic technologies such as Near Infrared (NIRS) and Raman have gained popularity in the industry because of their non-destructive nature, fast acquisition times and high informational content.
This article is intended to be used as practical guide to allow the PAT scientist to understand the main differences and capabilities of these two techniques. By understanding vital differences between technologies, the scientist should be able to make a better choice when deciding which technique to implement based on the quality attribute to be studied and on the raw material and formulation properties. Common applications and hurdles along with data collection and data analysis suggestions will also be briefly discussed.
Near Infrared Spectroscopy
(a) Phenomena
NIRS is a vibrational spectroscopy technique which allows probing of overtones and combination bands of molecules [3]. NIR radiation absorption is observed for functional groups involving the hydrogen atom (OH, NH and CH). NIR spectral bands are broad when compared to bands from techniques which probe fundamental vibrational modes, thus NIR is not used for structure elucidation.
The NIR spectral region ranges from 700 to 2500 nm. Since bands in this region are weak, no dilution of materials in matrices such as KBr or mineral oil is needed to obtain the spectral information. This presents a great advantage for the analyst since no sample preparation is required eliminating sample preparation errors, analyst labor and sample destruction.
(b) Instrumentation
NIR spectrometers are simple instruments which employ NIR radiation sources, such as tungsten-halogen lamps and detectors based on either photodiode or photoconductive technologies. System configurations can be found in Dispersive, Interferometer (Fourier Transformed), Acousto-Optic Tunable Filters (AOTF) or Micro Electro Mechanical Systems (MEMS) fashions. NIR systems can be used to measure NIR radiation that has been collected in two modes: diffusely reflected and diffusively transmitted. The instrument’s configuration such as detector, detector position and lamp power will change depending on the desired mode.
A great selection of bench top and process NIRS instruments can be found in the market as these systems are becoming a common analytical tool in quality and product/processes development laboratories. Process NIRS may employ invasive or non-invasive probes. Probe selection is application dependent and will depend on the sampling interface. Some NIRS probes could be attached to process units allowing the measurements to be performed through glass, quartz and/or sapphire windows. Process NIRS can also incorporate wireless communication technologies allowing easier process monitoring set-ups.
(c ) Applications
The advantages of NIR spectroscopy for the study of pharmaceutical products and processes has been investigated in multiple instances. Some pharmaceutical applications of NIR spectroscopy are raw material identification and classification, powder blend uniformity, tablets and granules content uniformity, water content (moisture) determination and particle sizing.
Raw material identification is easily achieved by creating multivariate models with NIR data obtained in reflectance mode. This task is usually simple, since the probability that two different pharmaceutical materials could have the same NIR spectral pattern is low. For material identification purposes multivariate routines could be used to estimate similarities and/or differences between NIR spectral populations [3]. On the other hand, material classification could present a higher challenge than material identification since it relies on smaller spectral changes to discriminate between material classes and/or grades [4].
Both qualitative and quantitative approaches have been used to determine blend uniformity with NIRS. Simpler qualitative methods require no reference and no model building, therefore are usually easy to implement. Commonly used reference free methods include Moving Block Standard Deviation and Euclidean distance. These algorithms permit comparing timely obtained moving blocks of spectra of the powder bed while the blender tumbles until the spectral variability plateaus to a minimum [5]. More complex qualitative methods employ PCA classification. PCA classification requires building a model which includes spectral data of multiple reference standards representing the blend uniformity end-point. Real-time blending data is then classified as belonging or not belonging to this end-point data set [3].
Quantitative approaches require more effort, since a calibration set containing various concentration levels of mixture components needs to be prepared. Once the calibration model has been built, it can be used real-time to predict the concentrations of API and excipients. The end-point is achieved when the desired ingredient concentration is constantly predicted by the model [6].
 For blend uniformity end-point determination, the analyzer spot size is crucial in predicting a realistic result, big spot sizes may predict blend uniformity before its end point since it could be analyzing a sample volume corresponding to multiple dosages. It is recommended that for blend uniformity the inspected volume should not be larger than 1 to 3 dosage units [7].
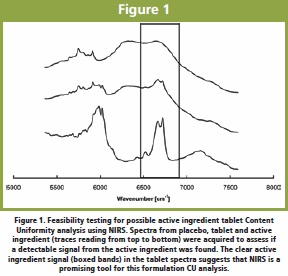
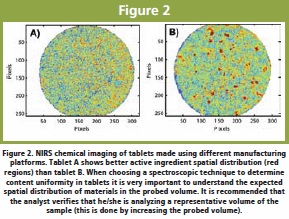
Another common application of NIRS is Content Uniformity (CU) analysis of tablets. NIRS can be used to determine the active ingredient and excipient concentration in tablets (and granules) given that the ingredient has a detectable signal in the NIR region [8-10] Figure 1. The best NIRS measurement mode (transmission or reflectance) will depend on tablet properties, such as active ingredient spatial distribution and tablet density and thickness [8, 11]. Reflectance NIRS can be used for CU if the material of interest is homogeneously distributed throughout the tablet and the spatial distribution of the material in the sampled volume is representative of that in the tablet. Spatial distribution of ingredients in a tablet could be investigated by using an imaging technique before choosing between sampling modes. Figure 2 shows the spatial distribution of the active ingredient for tablets made using different manufacturing platforms. Figure 2. NIRS chemical imaging of tablets made using different manufacturing platforms. Tablet A shows better active ingredient spatial distribution (red regions) than tablet B. When choosing a spectroscopic technique to determine content uniformity in tablets it is very important to understand the expected spatial distribution of materials in the probed volume. It is recommended that the analyst verifies that he/she is analyzing a representative volume of the sample (this is done by increasing the probed volume).
 Transmittance mode NIRS can be used when in-homogeneity of ingredients is observed and/or expected. The signal to noise of transmission NIR spectra will decrease with tablets thickness and porosity, thus an assessment of the signal to noise of the tablet is recommended prior to creating CU models using transmission NIR spectroscopy.
NIRS is also an excellent technique to determine moisture content in samples since OH groups show intense bands in the NIR region. Thus NIRS could be employed on-line to monitor processes such as active ingredient drying, freeze-drying (primary and secondary drying stages) and granules drying [12-14]. During typical fluid bed drying monitoring the moisture levels could range from approx. 20% to 1%. Since the moisture range can be large, it is recommended that the analyst creates multiple moisture prediction models that can predict with higher certainty at different moisture levels. This approach can also safeguard against non-linearity in a model with a wide range.
Other applications for moisture measurement could be done off-line. Off-line moisture content determinations include, water sorption of material in stability and storage conditions and residual moisture for lyophilized products [15].
NIRS can also be used to study physical properties of materials such as variability in particle size. Different particle sizes will show systematic differences in spectral baselines. Baseline offsets or baseline slopes can be correlated with the particle size distribution data allowing the use of NIRS as a secondary technique to predict particle size.
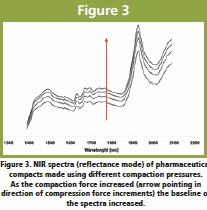 Physical properties such as hardness and density of tablets, rolled compacted ribbons and/or granules can also be evaluated using a NIRS sensor [16, 17]. Differences in material hardness (and porosity) causes shifts in spectral baselines that can be correlated with physical data obtained from instruments such as texture analyzers, helium pycnometers and hardness testers (for tablets) among others [17]. Figure 3 shows the effects of increasing the compaction forces (thus increasing density) on the NIRS reflectance spectra of pharmaceutical compacts. Figure 3. NIR spectra (reflectance mode) of pharmaceutical compacts made using different compaction pressures. As the compaction force increased (arrow pointing in direction of compression force increments) the baseline of the spectra increased.
(c) Data Analysis
Given the level broadness and overlap of the NIR overtones and combination bands, multivariate data analysis is the number one choice data analysis strategy for the NIR spectroscopist. Most commercial NIRS systems come with built in multivariate data analysis packages for pattern recognition and quantification. The two most common multivariate data analysis techniques are Principal Component Analysis (PCA) [18] and Partial Least Squares (PLS) regression [19]. PCA is a pattern recognition method which captures orthogonal systematic variability in a data set and ranks it depending on its influence, whereas PLS regression allows correlating an independent variable to an entire spectrum.
Many factors could affect NIR spectral measurement and subsequently method accuracy and robustness. Some of these factors are sample presentation, physical properties and environmental conditions. Two commonly encountered factors are particle size and moisture.
1) Particle Size Effects
Particle size differences affect the NIR spectral data baselines in both measurement modes, reflectance and transmittance. In reflectance mode the bigger the particles the higher the baseline (in absorbance unit) while the opposite is true when using NIRS in transmittance mode. This effect can be corrected by using a pretreatment such as Standard Normal Variate (SNV) or Multiplicative Scattering Correction (MSC) [20]. When interested in studying other property attributes beside particle size and/or density it is highly recommended to correct for baseline changes, since it could become a non-desired variability source that can be described by multivariate pattern recognition methods such as PCA. If the main interest of the study is to model particle size effects or density by using NIRS, no data pretreatment is recommended. The analyst can also use NIR spectral baseline offset and/or slopes to correlate with particle size values [16] .
2) Moisture Effects
As aforementioned, differences in water content can be easily captured by NIR spectroscopy since water molecules present high dipole moments. If the analyst is interested in predicting quality parameters other than moisture content but variability in water content is expected, it is recommended that the variability is built into the calibration model.
Raman Spectroscopy
(a) Phenomena
Raman spectroscopy is a form of vibrational spectroscopy [21]. Like infrared spectroscopy, it probes the fundamental modes of bond vibrations although the nature of the phenomena arises from a different physical event. The Raman effect arises from the interaction of monochromatic radiation with highly polarizable functional groups, which result in inelastic scattering of photons. Highly polarizable functional groups are usually symmetric, therefore groups that have high dipole moments are not good Raman scatterers.
The Raman phenomena is of low efficiency since ~ 1 out on 108 photons will be inelastically scattered upon interacting with a Raman active functional group. The low efficiency attribute permits (just like in NIR spectroscopy) obtaining spectral information without the need of sample dilution and/or preparation. Raman peaks are sharper than NIRS bands providing a higher degree of informational content. Depending on the system configuration vibrational modes can be investigated from 200 to 3200 cm-1.
(b) Instrumentation
Raman spectrometers are not as simple as NIR systems. Given the low efficiency of the Raman phenomena, lasers are used to generate the monochromatic radiation needed to produce enough inelastically scattered photons [21]. Monochromatic radiation is needed in order to obtain spectra with good signal to noise ratio. Raman systems also require a series of notch and/or edge filters to block or attenuate the contribution of scattered photons that elastically scattered from the sample.
Raman spectrometers (like NIR systems) can also be found in dispersive or Fourier Transform (FT) configurations. Dispersive instruments usually utilize diode lasers in the visible and near infrared region (532-980 nm) with multidimensional and/or one dimensional charged coupled device (CCD) cameras as detectors. Systems using excitation sources in the visible region are supposed to be fast, since in theory the intensity of the Raman signal should be proportional to the bi-quadratic of the laser frequency. Unfortunately the probability of exciting non-specific fluorescence is also proportional to the frequency of the laser, thus diode lasers in the near infrared region are commonly employed in order to avoid this phenomena.
Fluorescence masks Raman peaks by creating a broad halo convoluted with the Raman signal. Even though white powders could contain fluorescent impurities, this phenomenon is more commonly observed for colored samples.
FT-Raman systems usually employ 1064 nm excitation lasers. To compensate for the long wavelength, these systems use higher laser powers, which can sometimes burn samples, especially those that are colored. The main advantage of these systems is the fluorescence reduction and flatter baselines. Some disadvantages of FT-Raman systems are high excitation powers and moving parts. New dispersive systems are in the market which incorporates 1064 nm excitations lasers and Indium Gallium Arsenide (InGaAs) array detectors.
Raman systems can also be found as bench top units or process probes. Process units are characterized for being coupled to fiber optics to enable remote sampling. Other common traits of process Raman systems are long working distances, immersion probes and bigger spot sizes.
(c) Applications
The potential of using Raman spectroscopy for the study of pharmaceutical products and processes has also been investigated although at a slower pace than NIRS. Some of the applications of Raman spectroscopy for the study of pharmaceutical materials are raw material identification, powder blend uniformity determination [22], tablets and granules content uniformity [23] , solid state identification, quantitation and monitoring [24] and tablet coating monitoring [25].
Just like NIRS, Raman can be used for raw material identification but since it probes the fundamental vibrational modes, it usually presents a higher degree of information (more peaks) and better specificity/selectivity, which increases the probability of accurate identification.
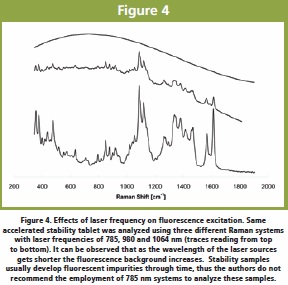 The end-point of powder blend uniformity has been investigated by monitoring the spectral variability of timely measurements during the process. The use of Raman spectroscopy to determine tablet content uniformity has also been explored. When using Raman spectroscopy for CU it is highly recommended to select a probe which allows investigating a representative volume of the tablet and/or granules [23]. Representative sampling could be achieved by collecting multiple sample spots on the sample surface or by using a more convenient defocused macro-beam spot [26]. Defocused systems also increases the penetration depth into the sample increasing the probed volume [27]. Figure 4. Effects of laser frequency on fluorescence excitation. Same accelerated stability tablet was analyzed using three different Raman systems with laser frequencies of 785, 980 and 1064 nm (traces reading from top to bottom). It can be observed that as the wavelength of the laser sources gets shorter the fluorescence background increases. Stability samples usually develop fluorescent impurities through time, thus the authors do not recommend the employment of 785 nm systems to analyze these samples.
One of the most important applications of Raman for pharmaceutics characterization is active ingredient solid state identification, quantitation and monitoring [28]. Manufacturability, stability and bioavailability could be affected by the presence of different solid state forms. Having multiple solid state forms in the drug substance and drug product also reflects poor manufacturing control [29]. The presence of patent protected solid state forms in generic drug products could also have legal implications. When using Raman spectroscopy to detect, quantitate and/or monitor solid-state forms in drug substance and products, it is important to choose systems with high resolution (~6 cm-1 or higher). In Figure 4 it can be observed how Raman spectroscopy can differentiate between mannitol polymorphs. NIRS might also be used to identify different solid state forms. Even though the authors recommend NIR when dealing with hydrates, they have been more successful in employing Raman for general solid state form characterization (especially for drug product).
(d) Data Analysis
Given a high signal to noise ratio and that a clear spectral window is identified (i.e. a region that has little or no interference from other components in the sample matrix) simple univariate calibration and modeling techniques could be employed for Raman data. A simple pattern recognition method for material identification is wavelength correlation. For calibration, techniques such as peak intensity, area integration and intensity ratio between peaks could be used to obtain the independent variables for the calibration. However, there are many instances where multivariate modeling techniques such as PLS could provide more accurate results.
1) Fluorescence Background in Raman Spectroscopy
When dealing with fluorescent background one should not worry about changes in baseline as much as about losing Raman signal. Changes in baseline can be easily corrected with derivatives. These pre-treatments also help to amplify spectral changes, thus amplification of noise is also expected. Noise reduction can be achieved by pixel averaging or polynomial fitting of small sections of the spectra. Unfortunately when dealing with severe fluorescence, be aware that Raman peaks can disappear and no data pretreatment can recreate the spectra. Figure 5. Raman spectra of mannitol polymorphs α, β and δ (traces reading from top to bottom). Raman spectroscopy is usually a good technique to differentiate between different solid state forms in drug substance and/or drug product.
When a sample presents medium to high levels of florescence is recommended that the spectral data is collected by using short exposure times (below 1 second) while increasing the number of accumulations. This might alleviate the fluorescence background. Of course, the easiest (but expensive) alternative of improving the Raman signal of fluorescent samples is to change excitation sources. By using 980 or 1064 nm lasers the levels of fluorescence can be greatly reduced. For a comparison of fluorescence excitation levels depending on the laser frequency see Figure 5.
Two important pharmaceutical sources of fluorescence at 785 nm excitation are Microcrystalline Cellulose (MCC) and chemical impurities. Microcrystalline cellulose (MCC) is a common excipient in the manufacturing of tablets. MCC exhibits variable levels of fluorescence and could look overwhelming for the spectroscopist that is used to the flat baselines provided by infrared spectroscopy. The fluorescence could look intimidating especially when using systems with large spot sizes. Nevertheless, the author has always been successful at removing the MCC fluorescence signal by using derivatives even when using instruments with large spot sizes.
Low levels of fluorescent impurities can be detrimental for the Raman readout. Even if the wet chemistry impurity profile of the material is acceptable, Raman peaks can completely disappear due to fluorescence associated with impurities. Even though impure pharmaceutical materials usually exhibit color (sandy or yellowish tones) the author has come across white materials that have developed fluorescent impurities over time and exhibited no color change.
2) Laser Fluctuations Effects
A common issue when using Raman spectroscopy is laser power fluctuations. Laser fluctuations result in an overall loss of Raman signal intensity. If the laser fluctuations are not enough to affect the signal quality, its effect should be easily removed by standardizing and normalizing the data (SNV). This data pretreatment is simple and highly recommended.
Take Home Message
Both spectroscopic technologies, Near Infrared and Raman, can provide chemical and physical information about pharmaceutical substances and products. These techniques are fast and non-invasive thus can give information of how process parameters affect different chemical and physical quality attributes. As for which technique is optimal for the analysis, this will depend on the application, ingredients molecular structure, formulation and the instrument configuration.
Before deciding which technology should be employed factors such as the investigated quality attribute, error tolerance, ingredients chemical and physical stability (and associated kinetics) has to be understood.
Chemometricians are key players whom will largely influence the success of the instrument application. A good chemometrician who also understands about process and material characteristics will make the best use of the equipment and the obtained data. In many instances the authors have seen the syndrome of the “dust collecting equipments” which occurs when analysts buy “top of the line” equipments, which usually are more complex to use, but have no in-house experts to process the data. For this reason we recommend that the new PAT scientist acquire basic spectrometers models from vendors until he or she is comfortable with the technique and understands the basics of the data analysis. This will give more credibility to the team that could translate to management support for PAT group.
In order to make an optimal decision we recommend that the PAT team incorporates not only chemometricians and spectroscopist but formulators, process experts and physical characterization scientists. By understanding the multiple dimensions of a process, the team will be able to make a better decision of which sensor should be employed in the desired environment.
References
1. U.S. Department of Health and Human Services, F.D.A., Guidance for Industry, PAT — A Framework for Innovative Pharmaceutical Development, Manufacturing, and Quality Assurance. 2004.
2. Scott, B. and Wilcock, A., Process Analytical Technology in the Pharmaceutical Industry: A Toolkit for Continuous Improvement. PDA, Journal of Pharmaceutical Sciences and Technology, 2006. 6: p. 17
3. Blanco, M., et al., Near-infrared spectroscopy in the pharmaceutical industry. Analyst, 1998. 123(8): p. 135R-150R.
4. Kemper, M.S. and Luchetta, L.M., A guide to raw material analysis using near infrared spectroscopy. J Near Infrared Spectros, 2003. 11: p. 155-174.
5. Sekulic, S.S., et al., On-Line Monitoring of Powder Blend Homogeneity by Near-Infrared Spectroscopy. Analytical Chemistry, 1996. 68: p. 509.
6. Sulub, Y., et al., Real-time on-line blend uniformity monitoring using near-infrared reflectance spectrometry: a noninvasive off-line calibration approach. J Pharm Biomed Anal, 2009. 49(1): p. 48-54.
7. Weiyong, L., et al., The effect of beam size on real-time determination of powder blend homogeneity by an online near infrared sensor. J. Pharm and Biomed Anal, 2007. 43: p. 711-717.
8. Peroza-Meza, C., Santos, M.A., and Romañach, R.J., Quantitation of Drug Content in a Low Dosage Formulation by Transmission Near Infrared Spectroscopy. AAPS Pharmaceutical Sciences and Technology, 2006. 7: p. 29.
9. Jedvert, I., Josefson, M., and Langkilde, F., Quantification of an active substance in a tablet by NIR and Raman spectroscopy. Journal Near Infrared Spectroscopy, 1998. 6: p. 279.
10. Cogdill, R.P., et al., Process analytical technology case study part I: feasibility studies for quantitative near-infrared method development. AAPS PharmSciTech, 2005. 6(2): p. E262-72.
11. Ramirez, J.L., Bellamy, M.K., and Romañach, R.J., A Novel Method for Analyzing Thick Tablets by Near Infrared Spectroscopy. AAPS Pharmaceutical Sciences and Technology, 2001. 2: p. 11.
12. Zhou, G.X., et al., Determination and Differentiation of Surface and Bound Water in Drug Substances by Near Infrared Spectroscopy. J. Pharm. Sci., 2003. 92: p. 1058-1065.
13. Rantanen, J., et al., Use of in-line near-infrared spectroscopy in combination with chemometrics for improved understanding of pharmaceutical processes. Anal Chem, 2005. 77(2): p. 556-63.
14. Brulls, M., et al., In-Situ Near-Infrared Spectroscopy Monitoring of the Lyophilization Process. Pharmaceutical Research, 2003. 20: p. 494-499.
15. Lin, T.P. and Hsu, C.C., Determination of residual moisture in lyophilized protein pharmaceuticals using a rapid and non-invasive method: near infrared spectroscopy. PDA J Pharm Sci Technol, 2002. 56(4): p. 196-205.
16. Kirsch, J.D. and Drennen, J.K., Nondestructive tablet hardness testing by near-infrared spectroscopy: a new and robust spectral best-fit algorithm. J Pharm Biomed Anal, 1999. 19 (3-4): p. 351-62.
17. Gupta, A., et al., Real-time near-infrared monitoring of content uniformity, moisture content, compact density, tensile strength, and Young’s modulus of roller compacted powder blends. J Pharm Sci, 2005. 94(7): p. 1589-97.
18. Wold, S., Esbensen, K., and Geladi, P., Principal Component Analysis. Chemometrics and Intelligent Laboratory Systems, 1987. 2: p. 37.
19. Geladi, P. and Kowalski, B.R., Partial Least-Squares Regression: A Tutorial. Analytical Chimica Acta, 1986. 185: p. 1.
20. Dhanoa, M.S., S. J. Lister, R.S., and Barnes, R.J., The Link between Multiplicative Scatter Correction (MSC) and Standard Normal Variate (SNV) Transformations of NIR spectra. Journal of Near Infrared Spectroscopy, 1994. 2: p. 43.
21. Nafie, L.A., Theory of Raman Scattering, in Handbook of Raman Spectroscopy, G.M.E. Howell, Editor. 2001, Marcel Dekker. p. 1.
22. Hausman, D.S., Cambron, R.T., and Sakr, A., Application of Raman spectroscopy for on-line monitoring of low dose blend uniformity. Int J Pharm, 2005. 298(1): p. 80-90.
23. Wikström, H., et al., On-Line Content Uniformity Determination of Tablets Using Low-Resolution Raman Spectroscopy. Applied Spectroscopy, 2006. 60: p. 672-681.
24. Romero-Torres, S., et al., Monitoring of Mannitol Phase Behavior during Freeze-Drying Using Non-Invasive Raman Spectroscopy. PDA J Pharm Sci Technol, 2007. 61: p. 131-146.
25. Hagrasy, A.E., et al., Application of Raman Spectroscopy for Quantitative In-Line Monitoring of Tablet Coating. American Pharmaceutical Review, 2006.
26. Wikström, H., Taylor, L.S., and Lewis, I.R., Comparison of Sampling Techniques for In-Line Monitoring Using Raman Spectroscopy. Applied Spectroscopy, 2005. 59: p. 934-941.
27. Eliasson, C., Claybourn , M., and Matousek, P., Deep Subsurface Raman Spectroscopy of Turbid Media by a Defocused Collection System. Applied Spectroscopy, 2007. 6: p. 1123-1127.
28. Taylor, L. and Zografi, G., The Quantitative Analysis of Crystallinity Using FT-Raman Spectroscopy. Pharm Res, 1998. 15: p. 755-761.
29. Raw, A.S., et al., Regulatory considerations of pharmaceutical solid polymorphism in Abbreviated New Drug Applications (ANDAs). Advanced Drug Delivery Reviews 2004. 56: p. 397- 414.
Saly Romero-Torres is currently working as Principal PAT Scientist at Pfizer, formely known as Wyeth Pharmaceuticals. She holds a PhD in Analytical Chemistry which she completed at Purdue University (West Lafayette, IN) in 2006. Her dissertation title is “Raman and Chemometrics for Pharmaceutical Process Analysis”. Before joining Wyeth, she worked at Schering-Plough Pharmaceuticals as a spectroscopist in a physical characterization team. At Schering Plough, she developed new spectroscopic (IR, NIR and Raman) and chemometrics based analytical methods aimed to characterize and understand chemical and physical attributes that were critical to the quality of pharmaceutical materials.
Jun Huang is Principal PAT Scientist II at Wyeth’s Pharmaceutical Development Center, Pearl River NY. His primary responsibility is to implement QbD/PAT in pharmaceutical development and manufacturing. Prior to joining Wyeth, he worked at GlaxoSmithKline, PerkinElmer, and CAMO. He received his PhD in chemometrics from the Norwegian University of Science and Technology in Norway, 2001, with Prof. Kim Esbensen, a M.Sc and a B.Sc from China. His experience and interests involve chemometrics, multiple analytical techniques (NIR, Chemical imaging, Raman, GC/LC/ MS, and ICP-OES etc), and process engineering.
Pedro Hernandez-Abad is Associate Director at Wyeth Pharmaceuticals, where he leads the QbD/PAT Team at Wyeth’s Pharmaceutical Development Center, Pearl River NY. The PAT team supports projects emerging out of R&D and into early Phase II development all the way to launch. Pedro gained his PhD in synthetic organic chemistry from the University of Pennsylvania with Prof. KC Nicolaou and completed his postdoctoral studies at Oxford University with Prof George Fleet. Since 2005 he is part of the team responsible for PAT implementation for what will be Wyeth’s first product seeking real time release (RTR) approval from the FDA.