Introduction
In Part 1, we discussed the concept of the parameter known as the zeta potential. In this second part, we will survey the methods and techniques available to determine it.
Electrokinetic Phenomena
Because an electric double-layer (EDL) exists between a surface and solution, then any relative motion between the rigid and mobile parts of the EDL will result in the generation of an electrokinetic potential. There are four fundamental ways (Figure 1) in which this electrokinetic potential can be produced, via electrophoresis, electro-osmosis, streaming potential, and sedimentation potential [1].

FIGURE 1: Relationship between the four types of electrokinetic phenomena
The parameter that is used to describe this real, measurable potential is the zeta potential, ζ, (introduced in Part 1 when the theoretical model for the EDL was discussed).
Measurements made using techniques based upon each effect should give the same value for ZP. However, owing to a variety of factors, this is not necessarily the case. These factors include assumptions in the model for the EDL, inadequacies in the theory, and experimental limitations in the design and construction of instrumentation and differences in sample preparation [2]. Since, as discussed earlier, the electrochemical properties at any material surface-liquid interface are critically dependent upon the extent of that interface and the concomitant, interfacial chemistry, it is crucially important that the correct measurement technique be selected that meets the actual requirements of the application in question. Versatile as many current commercial instruments may be, the one that does everything has yet to be invented.
Instruments based upon the four different electrokinetic effects have practical working limits. Figure 2 illustrates the limitations of each technique using the constraints of particle density and solids volume fraction.
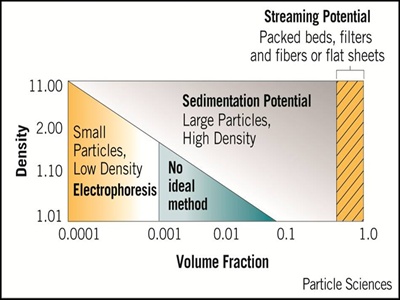
FIGURE 2: Operational envelope for electrokinetic techniques under the constraints of density and volume fraction phenomena
The choice of method should be based on the specific application under investigation. Too often, the system is “adapted” (physically altered) to fit the available instrumentation. In such cases, extreme caution is advised since the results of any subsequent measurement may be instrument-dependent.
Particle Electrophoresis
For suspensions, emulsions and macromolecules in solution, the most commonly used technique is particle micro-electrophoresis and there are a number of commercial devices available from a variety of manufacturers.
The most common technique, microelectrophoresis is based on electrophoretic light scattering (ELS), sometimes called laser-Doppler electrophoresis (LDE) [3]. It is fast, and the latest commercial devices are fully automated, requiring little input from the user. ELS/LDE instruments yield a histogram of the ZP of the particles within the sample suspension, and most devices can also measure the particle size distribution.
Calculation of Zeta Potential
In microelectrophoresis, ZP is not determined directly. The velocity of the particles is measured (LDE utilizes frequency spectrum analysis) under some applied electric field from which an electrophoretic mobility, UE, is calculated as follows:
UE = Vp/Ex
Where, Vp is the particle velocity (μm/s) and Ex is the applied electric field (Volt/cm).
Electrokinetic theory involves both the theory of the EDL and that of liquid flow and so the relation between the zeta potential, ζ, and electrophoretic mobility, UE, is quite complicated. For curved surfaces (e.g. particles), the shape of the EDL can be described in terms of a dimensionless quantity, “κa”, where a is the radius of curvature (i.e., particle radius) and κ-1 is called the Debye length - a measure of the “thickness” of the EDL.
There are two limiting cases for which a fairly simple relation can be written between ZP, ζ and UE for large κa (>200) and for very small κa (< 0.1) (Figure 3).
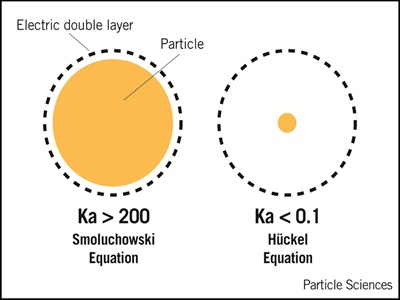
FIGURE 3: Limiting cases for Relation between Zeta potential and Electrophoretic Mobility
Limiting case 1 (large κa): Helmholz-Smoluchowski (HS) equation:
UE = εε0ζ/η
where, ε is the dielectric constant, ε0 is the permittivity of free space and η is the liquid viscosity.
Its use is restricted to suspensions of (non-conducting) large particles (diameter ≥ 1 μm) in aqueous solutions of relatively high salt (electrolyte) concentration (≥10-2M). Such conditions are frequently encountered in pharmaceutical formulations. The comparative simplicity of the HS equation often causes it to be used in aqueous media compositions even when it is not warranted.
Limiting Case 2 (small κa), Hückel equation:
UE = 2εε0ζ/3η
This equation is valid when particles are in the nanosize region (<<100nm) or when the solution has a very low electrolyte concentration (<10-5M). Though used infrequently as it is less applicable to normal aqueous suspensions, the Hückel equation is very useful for non-aqueous applications.
Many colloidal suspensions have properties falling between these two limiting cases and application of either the Helmholz-Smoluchowski or the Hückel equation leads to inaccurate values for zeta potential. For such intermediate conditions, the relation between ζ and UE is non-linear and of the form is as follows:
UE = 2εε0ζ F(κa)/3η
The coefficient F(κa) is, itself, a function of ζ; a complete numerical solution has been published [4] and software implementing it is available from the authors.
Zeta Potential Reference Materials
There is no accepted universal “standard” for zeta potential measurements. However, there are a number of “reference” materials supplied by the various manufacturers of zeta potential instrumentation. These are well characterized suspensions of particles whose electrophoretic mobility, UE value has been established over hundreds of measurements over many years; it is typically some stated value for ZP ±10% of that value.
The nearest there is to an “official” reference material is a sample of Goethite (α-FeO(OH)) manufactured and distributed by NIST (Gaithersburg, Maryland, USA) which, when prepared under standard conditions, has a certified UE value of +2.53x10⁻⁸ ±0.12x10⁻⁸ m2V-1s-1; equivalent to a ZP of +32.5 mV ± 0.12 mV [5]. Unfortunately, the goethite suspension has to be freshly prepared before any measurement and the protocol is not without travail. Further, being positively charged, the goethite particles tend to coat the walls and surfaces of an instrument measurement cell; clean-up can be very tedious.
However, a simple, inexpensive aqueous “reference” suspension can readily be prepared by just dispersing a sample of CoffeeMate™ into water containing 10-2 M KCl at ca pH 8.
Systems Having Very Small Electrophoretic Mobilities
In general, the ELS method works very well for aqueous systems where the solution ionic conductance tends to be moderate. However, human red blood cells (RBC) and microorganisms, such as bacteria and viruses, are suspended in water under physiological (isotonic) conditions (0.145M NaCl, pH 6.8) [6, 7] where the high ionic strength (a measure of electrolyte concentration) results in high conductance.
As the electrolyte concentration increases, the value of ZP falls, owing to the shielding effect of the ion atmosphere around the particle (see Part 1). Consequently, the ZP of RBC in isotonic solutions is almost an order of magnitude smaller than in distilled water [8]. Some body fluids can exceed the isotonic ionic strength by an order of magnitude [9] and salt levels in environmental systems, such as brine and sea water can be very high (ca 2M). Obtaining reliable data when the solution conductivity is so large poses a challenge for ELS/LDE devices because of Joule heating and other undesirable effects [10, 11].
Particles that are (sterically) stabilized by adsorbed nonionic surfactants, macromolecules and synthetic polymers all have electrophoretic mobilities at, or near, zero [2].
Non-aqueous systems also present a challenge because the viscosities of many organic liquids (especially silicones) are higher than water and their dielectric constants are invariably lower (some examples are given in Table 1). This results in often markedly-reduced mobilities; for example, PEG 200 (often used as a humectant) has (at RT) a viscosity of ~ 100 cP and a dielectric of ~ 12; ZP measurements by ELS in this fluid would be impossible.

TABLE 1: Mobility ratio or particles with the same Zeta Potential in various media
Phase Analysis Light Scattering
The aforementioned difficulties can be overcome by using phase modulation in place of frequency spectrum analysis [12, 13]. Termed phase analysis light scattering (PALS), this methodology has superior sensitivity compared with conventional ELS. At 37°C, the viscosity of PEG 200 is ~ 30 cP and a sample of casein dispersed in it has a measured ZP of ca -0.3mV in contrast to a typical literature value for casein in water of ca -75mV [14].
The limitation of the PALS method is that it can only provide an average value for ZP: since there is no histogram, it cannot be used for systems in which mixtures of materials are used. Only a few zeta potential instrument manufacturers offer the PALS technique.
Concentrates and Other Unusual Dispersions
Instrumentation based on ELS/LDE or PALS requires that the system under measurement be initially diluted, but there is always a concern that the dilution process can result in suspension instability, one classic example is that of emulsions. Another issue is the subsequent extrapolation of data from measurements made on exceptionally-dilute suspensions to the practical relevant concentration of the formulation. For biological systems, the problem of small amounts of contaminants in dilute systems can be overwhelming, whereas in concentrates, this can be almost ignored. Finally, ELS and PALS are light scattering techniques and so have limitations with opaque (i.e., light absorbing) materials (e.g. carbon black) or light sensitive materials (e.g., selenium or silver compounds) or systems in which the particles have motility (e.g., sperm).
Electroacoustic Attenuation
In sedimentation potential measurements (Figure 1), the disperse phase moves through a stationary liquid under the influence of gravity (the mechanical force) to produce an electric potential (15). The gravitational force, however, can be replaced by an acoustic field to give an AC equivalent of the DC sedimentation potential. Termed “electroacoustic attenuation (EAA),” there are two principal methods: colloid vibration potential (CVP) and electrokinetic sonic amplitude (ESA) (16-18). A comprehensive review of ultrasound techniques has been made by Dukhin (19).
A major advantage of EAA is that the sample under investigation need not be stationary – a necessary requirement of ELS and PALS instrumentation. The prime disadvantage of the EAA technique is interference from the presence of air bubbles [19]. The lower limit of concentration that can be reliably measured is about 1% and at high concentrations (> 50%) technical issues often limit its usefulness.
It should not be necessarily expected that the value of ZP determined at high concentration using EAA should be the same as that determined under dilute concentrations using ELS or PALS. At very high solids concentration, interpretation of experimental measurements is complicated because of possible EDL overlap [20] between particle surfaces.
Thus, if a suspension is prepared at one concentration but is used at some other, lower concentration, it is critical that measurements be made at the use concentration. Measurements of ZP as a function of suspension concentration can often be illuminating.
Massive and Irregularly-Shaped Solid Materials
There are many applications in which the surface under investigation is not a particle. Examples include hair, bone, skin, polymer films, fibers, membranes, filter and porous materials, paper pulp and metal foil. In addition, there are coarse and massive solids that are of irregular shape that are not amenable because of their physical dimensions to measurement by ELS/PALS and EAA techniques.
Streaming Potential
Measurements on such systems can be made most satisfactorily using the streaming potential (SP) method [21].
A major advantage of the SP technique is the ability to investigate adsorption/desorption phenomena in situ; the flow-through nature of the method makes it ideal for the study of long-term processes. The use of material of macroscopic dimensions often provides data which is more appropriate to process conditions. Unfortunately, there are very few commercial manufactures of SP instrumentation.
References
1. Shaw DJ, Electrophoresis. London, England: Academic Press; 1969
2. Hunter RJ, Zeta Potential in Colloid Science. London, England: Academic Press; 1981
3. Hunter RJ, Foundations of Colloid Science. 2nd Edition, Oxford, England: Oxford University Press; 2001
4. O’Brien RW and White LR, J. Chem. Soc. Faraday II, 74: 1607-1626 (1978)
5. Hackley VA, et al. A Standard Reference Material for the Measurement of Particle Mobility by Electrophoretic Light Scattering. Colloids and Surfaces A – Physicochemical and Engineering Aspects. 1995; 98: 209-224
6. Seaman GVF. Electrokinetic Behavior of Red Cells. In: Surgenor D (ed). The Red Blood Cell. 2nd edition, New York, NY, USA: Academic Press; 1975: 1135-1229.
7. Richmond DV, Fisher DJ. The Electrophoretic Mobility of Micro-organisms. Advances in Microbial Physiology. 1973; 9: 1- 29
8. Bangham A, et al. Apparatus for Microelectrophoresis of Small Particles. Nature. 1958; 182: 642-644
9. Beretta DA, Pollack SR. Ion Concentration Effects on the Zeta Potential of Bone. J. Orthopaedic. Res. 1986; 4: 337-345
10. Novotney V. Particle Charges and Particle-Substrate Forces by Optical Transients. J. Applied Phys. 1979; 50: 324-332
11. Pohl HA, Dielectrophoresis. Cambridge, England: Cambridge University Press; 1978
12. Miller JF, et al. The Determination of Very Small Electrophoretic Mobilities in Polar and Nonpolar Colloidal Dispersions using Phase-Analysis Light Scattering. J. Colloid and Interface Sci. 1991; 143: 532-554
13. Tscharnuter WW, et al. A New Instrument for the Measurement of Very Small Electrophoretic Mobilities using Phase Analysis Light Scattering, ACS Symposium Series, 1998; No 693; Chapter 3: 327-340
14. Moore DH. Clinical and Physiological Applications of Electrophoesis. In: Bier M (ed). Electrophoresis: Theory, Methods and Applications, New York, NY, USA: Academic Press; 1959: 369-425
15. Marlow BJ. and Rowell RL. Sedimentation Potential in Aqueous Electrolytes. Langmuir. 1985; 1(1): 83-90
16. Marlow BJ, et al. Colloid Vibration Potential and the Electrokinetic Characterization of Concentrated Colloids. Langmuir. 1983; 4: 611-626
17. McClements DJ. Ultrasonic Characterization of Emulsions and Suspensions. Advances in Colloid and Interface Sci. 1991; 37: 33-72
18. O’Brien RW, et al. Electroacoustic Determination of Particle-Size and Zeta-Potential.
J. Colloid and Interface. Sci. 1995; 173: 406-418
19. Dukhin AS and Goetz PJ, Characterization of Liquids, Nano- and Microparticulates and Porous Bodies using Ultrasound. 2nd Edition, New York, NY, USA: Elsevier Publications Inc; 2010
20. Long RP, Ross S. Effects of Overlap of Double Layers on Electrophoretic Mobilities of Polydisperse Suspensions. J. Colloid and Interface Sci. 1968; 26: 434-445
21. Fairhurst D, Ribitsch V. Zeta Potential of Irregular Shape Solid Materials. ACS Symposium Series, 1991; No 472; Chapter 22: 337-353.