Introduction
Within the pharmaceutical industry, the particle size distribution (PSD) of an active pharmaceutical ingredient (API) may have a significant impact on both the manufacturability (flowability, packing properties, mixing, etc.) and quality attributes of the drug product (dissolution rate, bioavailability, content uniformity, etc.) [1, 2]. Throughout drug development, it is important to understand how particle size of an API impacts drug product performance and manufacturability; therefore, an appropriate analytical method is required for obtaining quantitative information on particle size distribution. Several techniques are available for particle size analysis, each with their own advantages and disadvantages; commonly used techniques for pharmaceuticals include laser diffraction, dynamic light scattering, light obscuration, electrical zone sensing, sedimentation, sieve analysis, optical microscopy, and scanning electron microscopy [1, 3-4]. Laser diffraction is one of the more common techniques for analyzing the particle size distribution of an API [3, 5]. One drawback of laser diffraction is that this technique may not provide accurate information on the “true size” of irregularly shaped particles [6]. However, the results of laser diffraction are considered reliable for batch-to-batch monitoring for quality control purposes [6]. The significant benefits of particle size analysis by laser diffraction are the short analysis time, repeatability, reproducibility, robustness, wide measurement range, and variety of compatible sample types (dry powders, emulsions, suspensions, sprays and aerosols) [3, 4]. To ensure a robust method is utilized for particle size characterization by laser diffraction, the principles of Quality by Design (QbD) can be applied to analytical method development.
Quality by design (QbD) was a principle first outlined by the quality pioneer Joseph M. Juran several decades ago [7]. The concepts of QbD have been more recently adopted within the pharmaceutical industry due to the recommendations by the International Conference on Harmonisation (ICH) and by the U.S. Food and Drug Administration [8-11]. Quality by design is a systematic approach to development, utilizing predefined objectives and emphasis on product and process understanding and process control, with a foundation of sound science and quality risk management [8]. Most QbD applications within pharmaceutical development focus on processes related to the drug substance and drug product. Although not specifi cally addressed in guidance documents, the QbD concept has been extended to analytical method development as well as method validation and transfer [11-17].
Numerous examples have been published on the application of QbD principles towards analytical method development; these concepts are most commonly applied to high performance liquid chromatography (HPLC) methods [18-25] and in some cases Karl Fischer [26], dissolution [27-28], and gas chromatography methods [29-30]. Few examples exist of how the principles of QbD can be successfully applied towards particle size method development by laser diff raction. The aim of this article is to demonstrate how the concepts of QbD can be applied towards the development a robust particle size method by laser diff raction for a small molecule API.
Experimental procedure
At the start of every analysis, an appropriate SiC (silicon carbide) standard was run for confi rmation of system performance. Standard instrument settings are as follows: Mei evaluation mode, product refractive index setting of 1.598-0.1i , a 50% stir rate, a 30% pump rate, a measurement duration time of 10 seconds, and a required Copt (optical concentration) range of 10% ± 5%. Samples were prepared by weighing approximately 20 mg of API and adding 20 mL of isopropanol. The solution was vortexed briefl y and sonicated for 60 seconds. Triplicate samples were prepared and analyzed for each sample. The mean X10, X50, X90 and the % RSD of each measurement are reported. Two API lots (designed lot M8-1 and M8-2) were utilized for all experiments. All experimental designs were a 2-level screening design with a +1 (high) and -1 (low) setting for each factor. High and low settings included: vortex time (1 sec. and 30 sec.), vortex setting (1 and 10 on a vortexer with continuous rheostat), sonication time (15 sec. and 90 sec.), sonicator water depth (0.5-1.0 cm and 3.25-3.75 cm); time to measurement (2 min. and 10 min.), sonicator (brand 1 and brand 2), stir rate (25% and 75%), pump rate (15% and 45%), measurement duration ( 5 sec. and 15 sec), and Copt (2% and 20%). Each experiment utilized a fractional factorial design with 4 center points (center points being the original method conditions).
Methodology
General approaches for analytical method development according to QbD principles have been described in the literature [13, 15, 17]. Once method goals have been defi ned, method development (scouting and evaluation) performed, and a method has been selected, an appropriate risk assessment should be performed. Next, a method control strategy should be defi ned and method validation should be executed. In the example illustrated here, a PSD method was originally developed for Phase 1 clinical studies of a small molecule API (referred to here as API “M8”). The particle size method was developed for API M8 utilizing development batches of API. During later stage development and prior to method validation, a more thorough evaluation of the method was deemed necessary to improve method understanding and reduce analytical variability. Due to various changes in the manufacturing process and resulting changes in particle size, it was deemed critical that the robustness of the analytical method for the API over a wider range of particle sizes be further evaluated. The goal of method validation is to ensure that a method is suitable for its intended purpose [31]. Method understanding and method variability should be thoroughly optimized prior to executing method validation. The general process fl ow used for developing a particle size method for API M8 is outlined in Figure 1. The point at which late stage development activities are initiated will vary depending on the project, but a potential trigger for initiating these activities is proof of concept from clinical development.
 Figure 1. Particle size method development strategy for API M8.
As a fi rst step in late stage analytical development, a risk assessment was done for the particle size method for API M8. In this example, an Ishikawa diagram (fi shbone diagram), Failure Mode and Eff ects Analysis (FMEA), and a risk prioritization matrix were utilized. A fi shbone diagram and FMEA are common risk assessment tools in pharmaceutical development [8]. A risk prioritization matrix was employed because this tool is eff ective in prioritizing experiments when numerous method variables have the potential to impact method performance [13, 32]. To perform an eff ective risk assessment, a multidisciplinary team participated in the discussion; in this example, analytical scientists, including those familiar with the specifi c method and those with general particle size expertise, quality control specialists, and process chemists participated. All participants were able to provide their own unique insight regarding the particle size methodology and particle size characteristics of API M8.
The fi shbone diagram for the particle size method for API M8 is included in Figure 2. Each factor in the fi shbone diagram was grouped into three categories: noise factors (N), tightly controlled factors (C), and factors that should be probed experimentally to fi nd an appropriate range (E) [13]. All noise and controlled factors were further evaluated with an FMEA.
 Figure 2. Fishbone diagram of the particle size method for API M8.
The goal of the FMEA was to determine what aspects of the method required clarifi cation or additional experimentation to understand their signifi cance to method performance. As an example, a section of the FMEA is included in Figure 3. In the example portion of the FMEA shown in Figure 3, the vortex model and sonicator model (noise factors because they are not actively controlled) had a high risk prioritization number (RPN). To minimize risk, these two factors were further evaluated through experimentation to determine their impact on the analytical method. In this example, subsequent experimentation concluded that neither factor needed to be tightly controlled.
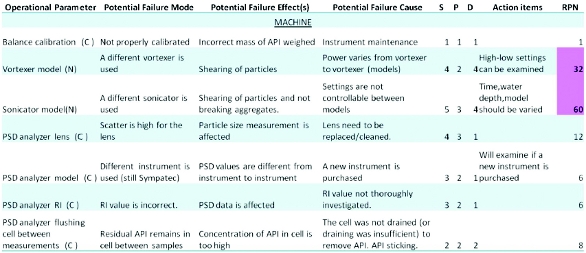 Figure 3. Section of the FMEA performed for the particle size method for API M8. S=severity, P=probability, and D=detectability. A 1-5 scale was used for scoring. 1=minimal severity, minimal probability, and high certainty of detection while 5=high severity, high probability, and low certainty of detection.
All experimental factors (E) from the fishbone diagram were evaluated through a risk prioritization matrix. As part of the risk prioritization matrix, critical analytical attributes of the method were defined (i.e. repeatability, intermediate precision, robustness) and each factor was correlated to these critical analytical attributes. High scoring factors from the risk prioritization matrix were divided into two categories, factors primarily impacting particle size and factors primarily impacting the analytical measurement; two DoEs were designed based upon this categorization. A design of experiment (DoE) approach was utilized to improve the efficiency of data collection and reduce the number of experiments required [33]. The significant advantage of using a DoE approach is that the number of experiments is significantly reduced compared to a traditional method development approach, which varies one factor at a time while keeping the others at a target level. DoE 1 (not shown) varied a total of six factors, including: vortex time, vortex setting, sonication time, sonication water depth, time to measurement, sonicator model. DoE 2 (shown in Figure 4) varied a total of 5 factors, including: stir rate, pump rate, measurement duration, Copt, and API lot (M8-1 and M8-2 have differing particle size distributions). A 2-level screening design was used for each DoE to examine the main effects of each factor.
 Figure 4. Design of experiment (DoE 2) for evaluation of factors impacting the particle size measurement. 4-center points are included (Run 1, 7, 9, 12).
Summary of Results
The results of each DoE were used to identify critical method factors that should be tightly controlled in the method. All results were analyzed using a least-square model to evaluate the probability (Prob>ltl) of each method factor having signifi cance in the model. A probability of less than 0.05 is often considered evidence of statistical signifi cance. Given the importance of a robust and precise particle size measurement, a conservative approach was taken and a value of 0.10 was used to identify potentially critical method factors. Statistical analysis of the results identifi ed three critical method factors: sonicator water level, measurement duration, and Copt. Varying these three method factors had a statistically relevant impact on the fi nal analytical method, as determined through an evaluation of precision (% RSD of X10, X50, X90) and measured particle size (X10, X50, and X90). The other 7 factors explored in the DoEs were not found to have statistical signifi cance for this analytical method.
The prediction profi le for sonicator water depth, measurement duration, and Copt is shown below in Figure 5. The profi le traces in Figure 5 are the predicted response as one variable is changed while the others are held constant and is based upon the results of the leastsquare model. Sonicator water depth was found to have an impact on X50 and X90. With decreasing water depth, there was a general downward trend in particle size which potentially indicates shearing of API particles due to excess energy imparted during sonication. Although the change in particle size is predicted to be minimal (i.e. change of < 1 μm), API M8 has needle shaped particles and shearing was a particular concern during this robustness evaluation. The water level in a sonicator bath is known to have an impact on the local ultrasound intensity; therefore this result was not unexpected [34]. However, it was surprising that this factor was found signifi cant but sonication time was not (when varied from 15 – 90 seconds).
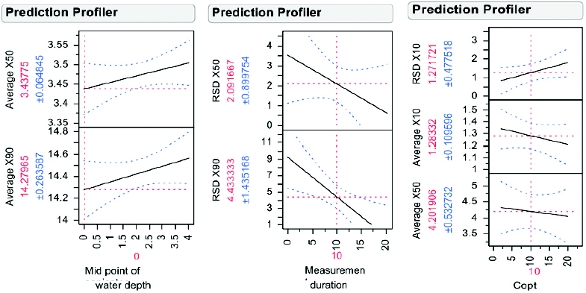 Figure 5. Prediction profi ler for sonicator water depth, measurement duration, and Copt. The profi le trace (black line) is the predicted response as one variable is changed while all others are held constant. A profi le trace with a steeper slope indicates that the variable has a more signifi cant impact on the response. The blue line corresponds to the 95% confi dence interval.
Results from varying measurement duration indicated a longer measurement duration will decrease the % RSD for X50 and X90. Measurement duration is the length of time the instrument collects data to determine particle size. Increasing the measurement duration increases the number of particles inspected. As a general rule, samples with a broad distribution of particles and samples with large particles (>100 μm) should have a longer measurement duration time [35].
Copt (optical concentration) was found to be signifi cant for the precision of X10 (% RSD from triplicate measurements), and also measured X10 and X50. Copt is a factor directly linked to the particle concentration in the analyzer cell. The particle concentration should be high enough to collect adequate signal (to ensure reproducible and accurate results), but also low enough to minimize multiple scattering [35, 36]. Multiple scattering is known to result in an overestimation of fi nes (i.e. X10 will be signifi cantly impacted) [35, 37].
Control strategy and method validation
As part of a method performance control strategy, each critical method factor as identifi ed from robustness experiments should be controlled in the method. A minimum sonicator water level was written into the method to minimize the likelihood of excessive energy being imparted during sonication. Following these DoE studies, measurement duration was further evaluated (10, 30, 45, and 60 seconds) and a setting of 45 seconds was determined optimal as it further reduced measurement variability. In addition, a range for Copt was included into the method to ensure this value did not deviate by more than 5% from the target value of 10%. Following robustness studies and determination of an appropriate control strategy for the method, method validation was successfully executed. Method validation parameters for a particle size method were based upon the recommendations outlined in USP <429> and included precision and robustness.
Conclusions
The principles of QbD were applied towards the development of a particle size method by laser diffraction. During early stage development, an appropriate method which was “fit for purpose” was developed. During late stage development, a systematic approach was utilized to improve method understanding and reduce measurement variability. A risk-based approach was used to prioritize experiments. Subsequent robustness experiments identified critical method factors which should be controlled in the method to reduce method variability. Once a more thorough understanding of the method was obtained, the method could be successfully validated using the knowledge obtained from development. Analytical method development using a QbD approach requires that sufficient time and resources are dedicated towards all steps outlined earlier in Figure 1. Nevertheless, a significant advantage of a QbD approach is that a thorough assessment of the methodology is conducted and improved method understanding is obtained, which allows for a more robust analytical method to be validated.
Acknowledgements
The author would like to thank the contributions of John D. Bak for extensive support and discussions during the development of this analytical method. In addition, the authors acknowledge the contributions of Scott Zugel, Laila Kott, Jennifer Zhang, Mike Perlman, Marianne Langston, Neil Faiber, Jenny Carhart, Rebekah Leigh, Phuong Nguyen, Daniel Sauerstrom, Jason Walters, Jonathon Salsbury, Nathaniel Goldstein, and Heath Rushing.
References
- Shekunov, B.Y.; Chattopadhyay, P.; Tong, H.H.Y.; Chow, A.H.L. Pharma. Res. 2007, 24, 203-227.
- Fayed, M.E.; Otten, L. Handbook of Powder Science & Technology; Chapman & Hall: New York, 1997.
- Merkus, H.G. Particle Size Measurements: Fundamentals, Practice, Quality; Springer: New York, 2009.
- Ahuja, S.; Scypinski. S. Handbook of Modern Pharmaceutical Analysis; Academic Press: San Diego, 2001.
- Hlinak, A.J.; Kuriyan, K.; Morris, K.R.; Reklaitis, G.W.; Basu, P.K. J. Pharm. Innov., 2006, 1, 12-17.
- Washington, C. Particle Size Analysis in Pharmaceutics and Other Industries; Ellis Horwood limited: West Sussex, England, 1992.
- Juran, J. M. Juran on Quality by Design: The New Steps for Planning Quality into Goods and Services; Free Press: New York, 1992.
- Topic Q8(R2): Pharmaceutical Development. International Conference on Harmonisation OF Technical Requirements for Registration of Pharmaceutical for Human Use, Geneva, Switzerland, 2009.
- Topic Q9: Quality Risk Management. International Conference on Harmonisation of Technical Requirements for Registration of Pharmaceutical for Human Use, Geneva, Switzerland, 2005.
- Topic Q11: Development and Manufacture of Drug Substances (Chemical Entities and Biotechnological/Biological Entities), International Conference on Harmonisation OF Technical Requirements for Registration of Pharmaceutical for Human Use, Geneva, Switzerland, 2012.
- U.S. Food and Drug Administration, Department of Health and Human Services. Pharmaceutical Quality for the 21st Century: A Risk-Based Approach Progress Report, May 2007. http://www.fda.gov/AboutFDA/CentersOffices/OfficeofMedicalProductsandTobacco/ CDER/ucm128080.htm
- Yu, L.X. Pharm. Res. 2008, 25, 781-791.
- Vogt, F. G.; Kord, A. S. J. Pharm. Sci. 2011, 100, 797-812.
- Rozet, E.; Ziemons, E.; Marini, R.D.; Boulanger, B.; Hubert, P. Anal. Chem. 2012, 84, 106-112
- Borman, P.; Nethercote, P.; Chatfield, M.; Thompson, D.; Truman, K. PharmaTech. 2007, 31, 142-152
- Nethercote, P.; Ermer, J. PharmaTech. 2012, 36, 74-79.
- Schweitzer, M.; Pohl, M.; Hanna-Brown, M.; Nethercote, P.; Borman, P.; Hansen, G.; Smith, K.; Larew, J. PharmaTech. 2010, 34, 52-59.
- Karmarkar, S.; Garber, R.; Genchanok, Y.; George, S.; Yang, X.; Hammond, R. J. Chromatogr. Sci. 2011, 49, 439-46.
- Monks, K.E.; Rieger, H.J.; Molnár, I. J. Pharm. and Biomed.Anal. 2011, 56, 874-879.
- Bhatt, D.A.; Rane, S.I. Int. J. Pharm. Pharm. Sci. 2011, 3, 179-187.
- Li, Y.; Terfloth, G.J.; Kord, A.S. Am. Pharm. Rev. 2009, 12, 87-95.
- Gavin, P.F.; Olsen, B.A. J. Pharm. Biomed. Anal. 2008, 46, 431-441.
- Krull, I.; Swartz, M.; Turpin, J.; Lukulay, P.H.; Verseput, R. LCGC N. Am. 2008, 26, 1190-1197.
- Krull, I.; Swartz, M.; Turpin, J.; Lukulay, P.H.; Verseput, R. LCGC N. Am. 2009, 27, 48-61.
- Yang, S.; Li, Y.; Chen, T.K.; Kord, A.S. J. Liq. Chrom.& Rel. Technol. 2010, 34, 61-81.
- Zhou, L.; Socha, J.; Vogt, F.G.; Chen, S.; Kord, A.S. Am. Pharm. Rev. 2010, 13, 74-83.
- Puertollano, M.; Cartwright, T.; Aylott, M.; Kaye, N. Tablets and Capsules 2009, 7, 30-39.
- Gray, V.A.; Zheng, J.Y.; Sesi, N.N. In Zheng, J. (Ed.) Formulation and Analytical Development for Low-Dose Oral Drug Products; Wiley: Hoboken, New Jersey, 2009.
- Sun, M.; Liu, D.Q.; Kord, A.S. Org. Process Res. Dev. 2010, 14, 977-985.
- Borman, P.; Chatfield, M.; Jackson, P.; Laures, A.; Okafo, G. PharmaTech. 2010, 4, 72-86.
- Topic Q2(R1): Pharmaceutical Development. Validation of Analytical Procedures: Text and Methodology, Geneva, Switzerland, 2005.
- Blodek, M.; Liebowitz, S.; McCarthy, R.; McNally, G.; Oksanen, C.; Schultz, T.; Sundararajan, M.; Vorkapich, R.; Vukovinsky, K.; Watts, C.; Millili, G. Pharm. Engin. 2006, 26, 1-11
- Lewis, G.A.; Mathieu, D.; PHAN-Tan-Luu, R. Pharmaceutical Experimental Design; Informa Healthcare: New York, 2007.
- Luque De Castro, M.D.; Capote, F.P. Analytical Applications of Ultrasound; Elsevier: Oxford, UK, 2007.
- Horiba. Method Expert: Guided, Automated Method Development for the LA-950: Irvine, CA, 2010.
- ISO 13320. International Organization for Standardization, Geneva, Switzerland, 2009.
- Ma, Z.; Merkus, H.G.; de Smet, J.G.A.; Heffels, C.; Scarlett, B. Powder Technol. 2000, 111, 66-78.
Author Biography
Julie T. Adamson, Ph.D., received her B.S. in Chemistry from the University of Chicago in 2003 and a Ph.D. in Analytical Chemistry from the University of Michigan in 2008. She is currently in the Analytical Development Small Molecule group at Millennium Pharmaceuticals, Inc. in Cambridge, MA. She currently focuses on analytical development for small molecule oncology drug substances and drug products.