Recombinant DNA technology has enabled the industrial production of monoclonal antibodies and recombinant proteins for targeted treatments of several diseases such as cancer and viral infections. Therefore, the production of bio-therapeutics is of increasing importance for the pharmaceutical industry. A large number of monoclonal antibodies and therapeutic proteins have been approved in recent years and are projected to be the major source of revenue in the upcoming years for the industry [1-5]. The expression system of choice for the production of complex recombinant proteins and antibodies is mammalian cells cultivated in suspension [6-9]. Manufacturing scales up to 25 m3 operated in a batch, fed batch, or repeated batch mode represent the state of the art in the industry. Following cell cultivation, a sequence of chromatography, filtration and concentration steps are performed – a typical antibody production process is shown in Shukla and Thömmes [10-12].
In general, the first step during the purification process is the clarification of the cell culture fluid – meaning the separation of a disperse phase (cells, particles and cell debris) from the liquid. Several clarification methods including centrifugation, flocculation, liquidliquid extraction, and various forms of filtration have been studied extensively in recent decades [13-16]. The choice of technology depends upon desired performance, concentration of solid particles in the fluid, and product characteristics. Disc stack centrifugation is a preferred method for mammalian cell culture harvest since this technology offers several benefits compared to other technologies including continuous operation at high throughputs, clean in place and steam in place capability, large sedimentation areas, no fouling effects, etc. The various operating modes and principles, as well as physical and fluid dynamic principles for particle sedimentation via centrifugation have been described by various authors [14,16-20].
In general, the design and validation of the centrifugation step must be assessed carefully since mammalian cells are sensitive to shear and changes in the environment [16, 21-22]. On the one hand, the efficiency for this unit operation has to meet separation requirements – on the other hand, special attention must be drawn to potential lysis of the cells during the harvest process [23]. Potential impacts of harvest centrifugation on product quality attributes and yields have been reported in literature. In most cases they could be attributed to the lysis-induced release of intracellular enzymes affecting product quality during various phases of the manufacturing and formulation process [23-26]. A gentle separation without lysis of the cells is therefore desirable during the harvest process while still meeting the performance requirements in terms of separation efficiency. Studies by other authors have demonstrated the ability to achieve a gentle removal of cells by centrifugation [13, 16, 27]. Next to the centrifuge and the separation process itself, other peripheral equipment and process hold steps can have a significant impact and need to be evaluated as well [23-25]. A detailed analysis and knowledge-based strategy is required – especially during replacement of equipment and technology transfers to other facilities.
In this study, a large scale manufacturing process for an active pharmaceutical ingredient was transferred into a different production facility consisting of one production line at the same production scale and a second production line requiring a 5-fold scale up. In general, the facility was designed to host the production process. However, several technical upgrades including the use of new disc stack centrifuges were implemented. During process monitoring of the first test batch, a statistically-significant difference in lactate dehydrogenase levels – an intracellular enzyme indicating greater cell lysis – was observed for both new production lines. A detailed analysis of operating parameters was performed and changes to the operation mode were made in order to harmonize process performance and consistency. In addition, the analysis led to further manufacturing process improvements as outlined for example in the FDA guideline for Process Validation [28]. Details of the studies and the approach for full commercial scale separation are described in this article.
Materials and Methods
Generation of Cell Culture Fluid and Overview of Harvest Process
The established production process utilizes a CHO cell in suspension to produce an active pharmaceutical ingredient. The media is chemically defined. pH is controlled by CO2 and base addition at 7.1 +/- 0.2. Dissolved oxygen is controlled at 30% air saturation. After thawing of the ampoule, the cells are expanded in spinner flasks and used to inoculate the seed train starting with a 10 L bioreactor. After a series of seed train bioreactors at split ratios of 1:5 to 1:10, the production bioreactor is inoculated as batch culture. The culture is harvested and re-inoculated after harvest. Details of the production culture are confidential. The viability of the culture at point of harvest is >90%.
 Figure 1. Principal sketch of the harvest process. The harvest process can be divided into two different processing steps: The transfer of the culture into the harvest vessel (culture drain) and the separation of the drained culture by the centrifugation.
Figure 1 shows a sketch of the process. The historical data base for this process consisted of 243 data points produced. The overall harvest process can be divided into two different process steps: culture drain and culture separation as shown in Figure 1. During the harvest of the cell culture fluid (CCF), the cell suspension is transferred by using gravity difference and by applying pressure of p=0.2 bar into a harvest vessel while cooling down the suspension to 10°C+/- 5°C via a heat exchanger. Temperature in the harvested cell culture fluid (HCCF) is controlled at 10°C+/- 5°C. The HCCF is subsequently fed into a disc stack centrifuge (type confidential). The parameters as relative measure can be found in Table 1. Further details are confidential. The feed stream is added from the top of the centrifuge and the flow rate is controlled by a feed valve. The operation mode utilizes a total discharge of the bowl. After separation, the clarified cell culture fluid (CCCF) is stored at 10°C+/- 5°C before further processing in recovery. Figure 1 shows a sketch of the process.
Table 1. Relevant characteristics for established operating conditions (0, grey shadow) and optimized operating conditions 1 and 2 in comparison to operating conditions of centrifuge 1 in the existing facility. Pressures and flow rates were adapted appropriately to avoid bowl overflow.

The established process was transferred into a new production building. The new production line 6 had a similar scale to the existing production line 2. Production line 7 required a 5-fold scale up of the process. All operating parameters, geometries, and operating conditions were generally kept similar in the production culture. No changes to product quality or quantity in the cell culture fluid were observed during transfer and scale up. Cell culture performance following scale-up and tech transfer was comparable, as indicated by no statistically significant differences in maximum cell densities, harvest viability, growth rate, and total lactate dehydrogenase activity (data not shown). The design of the disk stack centrifuges utilized in the new production building was not geometrically identical to that of the original production suite. The maximum bowl speed was selected upon transfer and scale-up to guarantee sufficient clearance of particles, cells and debris. Flow rates were adapted to meet comparable harvest time. Initial operational parameters, centrifuges, and relevant peripheral equipment are shown in Table 1. Further details are confidential.
A statistically-significant difference in the release of intracellular enzyme lactate dehydrogenase of the CCCF was observed during initial test runs and engineering runs at scale. Although no impact to product quality was observed (data confidential), further analysis was performed to increase process consistency. Details of the study will be discussed in the results section. All experiments described in this article used at scale material according to the process described above.
Analytical Methods
Particle size distributions and lactate dehydrogenase activity (LDH) were measured from the supernatant in the cell culture fluid in the production culture (CCF), the harvested cell culture fluid (HCCF) and the clarified cell culture fluid (CCCF) to allow characterization of the individual processing steps during the harvest process. Particle size distribution was performed using a cell counter and analyzer system. 50 μl of a well mixed sample were diluted in 10 ml dilution liquid for cell cultures, mixed and measured immediately. For the measurement two different capillary sizes of 45 and 150 μm were used to enable measurement of particles in the range of 1.4 to 30 μm or respectively 3 to 40 μm. All samples were diluted 1:200 to allow quantification. The resulting particle size distributions and particle volumes were calculated automatically and clustered in sizes of 1 μm. By determining the particle size and the number of particles before and after a process step, the separation efficiency η can be calculated as follows:

where n describes the particle freight at a particular size distribution before and after separation by the disc stack centrifuge.
Lactate Dehydrogenase (LDH) activity was determined as a relative measure of cell lysis during the process. LDH is an intracellular enzyme that catalyzes the oxidation of Lactate to Pyruvate [29, 30]. LDH has been described as suitable to characterize cell death and cell lysis since it is only released during cell rupture or from nonintegral membranes [31]. For analysis the samples were immediately centrifuged at 500g, the supernatant carefully decanted and stored at 4°C for a max of 24 hours. To determine the total LDH activity of the cells (theoretical maximum of LDH) the sample was frozen at -80°C for 24 hours to realize a full release of LDH by the cells and approximate the percentage of LDH release allowing estimation of the number of additional cells lysed during the process step. The lysis percentage in the fluid could be determined for each production step by dividing the LDH levels for the individual sample by the LDH level in the whole sample after refrigeration.
Next to LDH, other parameters such as DNA content or turbidity can be useful. Here, LDH was chosen since the assay was routinely performed. Online measurement of turbidity signals were routinely performed (not shown).
A relative comparison between the LDH activity before the process step and the LDH activity after the process step can be seen as sufficient for characterization of the individual process step regarding shear force caused cell lysis since the starting material was absolutely comparable.
Since product quality data is not shown in this paper (confidential) no details to the analytical methods are shown.
Theoretical Aspects of Sedimentation and Calculation of Relevant Characteristics
Sedimentation of particles in liquids and theoretical aspects of general operating principles of disk stack centrifuges have been discussed elsewhere [14, 16-20]. The principles and details of the characteristics can be applied in this case as well. In order to characterize the centrifuges in more detail, several relevant characteristics are usually calculated. In this article the following characteristics were used to characterize the centrifugation process and the operating parameters, and will therefore be explained in more detail.
Separation and clarification is directly related to the g force, bowl geometry, and flow rate. One key parameter characterizing the capabilities of a centrifuge is the equivalent separation area of the centrifuge, sigma (Ʃ), which can be calculated by multiplying the effective separation area A and the centrifugal acceleration number Z:

At similar suspension characteristics and equal particle diameters, a comparable performance should be achievable. In Equation 3, A is a function of the diameter of the centrifuge and the bowl speed:

The centrifugal acceleration number Z in Equation 2 allows the comparison of geometrically different systems by comparing the centrifugal acceleration velocity to the gravitational velocity:

Here ω is the angle velocity, r the diameter of the centrifuge and, n the bowl speed in rpm.
After combining and integrating Equations 2 through 4 the equivalent separation area sigma (Ʃ) can be calculated by:

Here, r is the inner and outer diameter of the disc, and i is the number of disc stacks in the separator.
The average flow velocity v at a given flow rate can be calculated by dividing the flow rate V by Ʃ:

v is also known as the imposition or load of the separation area. All particles that have an equal or higher sedimentation velocity vs compared to the flow velocity v will be separated. Applying Stoke’s Law for sedimentation of particle in static fluids, the maximum flow rate V can be calculated by:

where delta ρ describes the density differences between particle and liquid, and ηL the viscosity of the liquid. The critical particle diameter can be calculated by:

These parameters were calculated as applicable in this work. A scale down model for these centrifugation steps and centrifuges did not exist internally. Therefore, the traditional parameters described above needed to be utilized for scale up and transfer.
Results and Discussions
Analyzing Performance of the Initial Operational Parameters at Full Scale
The initial test and engineering runs in the new facilities were conducted with the operational parameters shown in Table 1 (gray shadows – condition 0). The cell culture performance was proven comparable in terms of product titers, viability, cell densities, and product quality in the supernatant as described above. The total LDH activity in the supernatant of all three production lines was 1683 U/L +/- 362 U/L and showed no significant differences. In-process controls for the harvest process particle distribution and LDH activity were determined. No impact to separation efficiency was detected (not shown). However, a statistical significant increase of LDH activity in the clarified cell culture fluid (CCF) was measured. Figure 2 shows the increase of LDH activity during the overall harvest process for the new production lines.
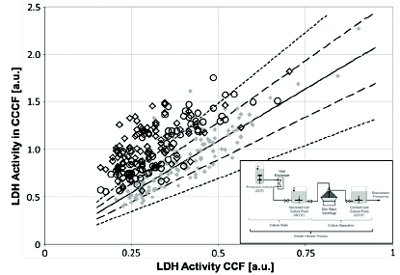 Figure 2. LDH activity measured in the clarifi ed cell culture fluid (CCCF) vs. LDH activity in the cell culture fluid measured in the bioreactor before harvest. Established production process production line (PL) 2: grey diamonds incl. average as solid black line and 1 and 2 sigma range as dotted lines. PL 6: Open diamonds; PL 7: Open circles.
While showing comparable LDH activity in the cell culture fluid (CCF) before harvest, the release of LDH is significantly higher during the overall process. Most data points for the new production lines 6 and 7 are outside of the 2-sigma range derived from the historical data from production line 2.
 Figure 3. Comparison of bioreactor drain process for the different production lines. Production line (PL) 2: grey diamonds incl. average as solid black line and 1 and 2 sigma range as dotted lines. PL 6: Open diamonds; PL 7: Open circles
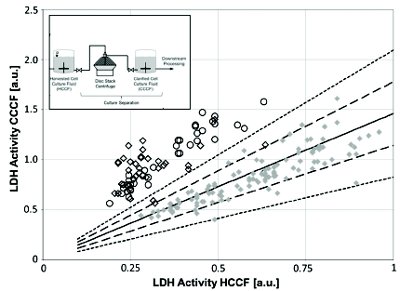 Figure 4. Comparison of separation process for the different production lines. Production line (PL) 2: grey diamonds incl. average as solid black line and 1 and 2 sigma range as dotted lines. PL 6: Open diamonds; PL 7: Open circles.
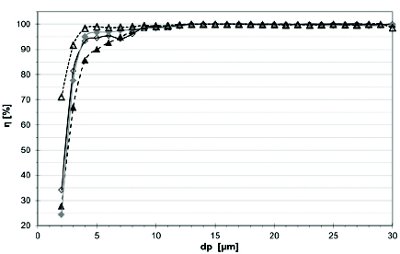 Figure 5. Separation efficiency for modified operating conditions for production line 6 in comparison to the established production process using centrifuge 1. Production line (PL)2: grey diamonds; PL 6, Condition 0: open diamonds; PL 6, Condition 1 = black triangle; Condition 2 = open triangle.
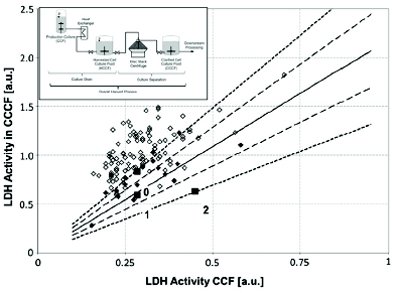 Figure 6. Performance of the diff erent operating conditions compared to the historical average of production line 2 (average as solid black line and 1 and 2 sigma range as dotted lines). Test for standard condition 0 and conditions one and two are labeled in the diagram and plotted as black squares. Additional test runs using condition 2 are shown as black diamonds. The results of the initial test and engineering runs are shown as open diamonds for comparison.
In order to analyze the harvest process, the two sub-processes (culture drain and culture separation) were analyzed in more detail. A trend toward higher cell lysis during the culture drain was observed, surprisingly, for the established production line 2. Figure 3 shows the results of the studies for the bioreactor drain operations. Although most results were within the 2 sigma range, a noticeable lower LDH release for production line 7 and a comparable release to production line 6 were detected. The most likely root cause for the increased LDH release during the drain of the culture was attributed to piping differences and the use of a plate heat exchanger instead of a tube bundle heat exchanger. When replacing or bypassing the heat exchanger, a significant decrease of LDH activity during culture drain could be achieved (not shown). Figure 3 shows an increased release of LDH during the production line 6 drain operation in some cases. This could be associated with a partially open harvest valve leading to increased harvest flow velocities causing shear stress and cell lysis.
At this point three conclusions were drawn:
- First, the piping and installation significantly influences the drain process.
- Second, the operational functionality of all valves and peripheral equipment needs to be routinely verified and assessed.
- Third, ongoing process monitoring and statistical process control helps to identify process issues and drive active process improvements.
A significant difference in cell lysis appeared during the separation step utilizing the three centrifuges (Figure 4). Hold time influences were not observed during the studies (data not shown). The highest shear force leading to lysis of cells is generated by the separation step. All centrifuges used a hydro-hermetic inlet. The centrifuges were not geometrically similar, but were generally capable of providing gentle and lysis-free separation of animal cells as demonstrated by production line 2 historical data and other authors [13, 16-18]. Closer analysis of operating conditions showed significant differences of the specific characteristics as potential root cause for the observed performance. Based on the operational parameters and the geometries of the centrifuges, the relevant characteristics were concluded by applying equations 2 to 7 and are shown as relative measures in Table 1 (details confidential).
As can be seen in Table 1, the initial operational parameters (gray) showed significant differences amongst the centrifuges resulting in increased tip speeds, centrifugation acceleration number (Z), and lower load imposition v compared to the centrifuge 1. Since in all cases sufficient separation efficiency compared to the existing production line 2 during initial test runs was achieved, the operating conditions were adapted as shown in to mitigate the risk of higher cell lysis while achieving comparable separation efficiency. Conditions 1 and 2 for each of the centrifuges were tested with cell culture fluid at scale to assess the impact of the modifications. Lower or equivalent tip speed at the outer bowl diameter and comparable load of the separation area v were applied as scale-up rules. The adapted operating conditions were tested at scale and the results are discussed in the following text.
Test runs with optimized operational parameters at Full scale
Separation efficiency and LDH release at the adapted operating conditions 1 and 2 shown in Table 1 were assessed for both production lines. In order to allow a more structured discussion, the different production lines are shown separately in the following text.
Table 2. Average LDH release for the diff erent conditions production line 6 for the separation process only.
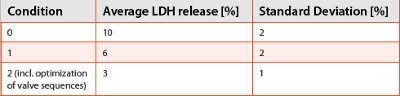
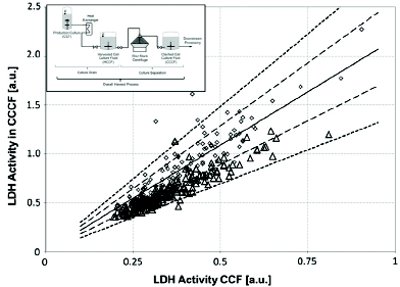 Figure 7. Performance of the new established condition on production line 6 (open triangles) compared to the established production line 2 (grey diamonds).
 Figure 8. Ratio of LDH activity in the CCF to CCCF for production line 6 from engineering runs, optimization and routine production including continuous improvement measures in comparison to the historical data from production line two. Average PL 2: black solid line, incl. 1 and 2 sigma ranges as dotted line. Initial operating conditions: open diamonds, condition 1 = black triangles, condition 2: grey filled diamonds; Continuously improved automation: shown open diamonds.
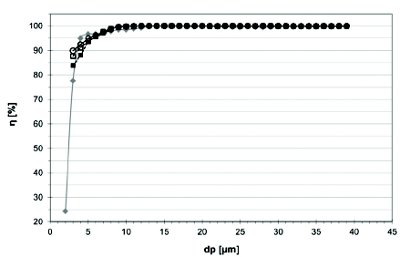 Figure 9. Separation effi ciency for modifi ed operating conditions for production line 7 in comparison to the established production process using the centrifuge 1. Historical data Production line (PL)2: grey diamonds. PL 7, Standard conditions 0: open circle; PL 7, conditions 1: open square; PL 7, conditions 2: filled square.
Figure 8 shows the course of performance for the production line over the batch number for the different improvements performed. Continuous improvement of the harvest step via sound process monitoring and rigid data analyses decreased process variability.
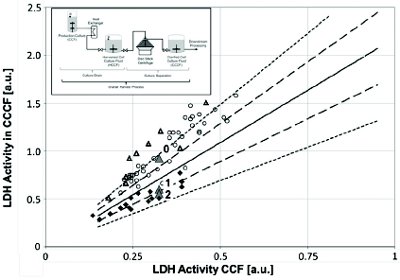 Figure 10. Performance of the harvest process in production line 7 comparing LDH activity for diff erent conditions. Open circles represent results achieved during initial operation. Grey Triangles represent the test runs– standard Condition 0, condition 1 and condition 2. Open triangles: Optimized bowl speed (condition 2) in routine operations. Reduced bowl speed (condition 2) with optimized automation control black diamonds.
Production Line 6
Table 3. Average LDH release for the diff erent conditions production line 7 for the separation process only.

The separation efficiency for production line 6 is shown in the following figure. Two at-scale runs were used for the determination of the separation efficiency for the adapted operating conditions 1 and 2 according to Table 1. Figure 5 shows comparable performance of all conditions for particle sizes above 7μm. Slight, but acceptable differences became obvious, however, at lower particle diameters for condition 1. Condition 2 showed comparable performance. The overall retention and separation efficiency was comparable for all tested conditions. These results were comparable to results published by other authors [13, 16, 18, 22, 23].
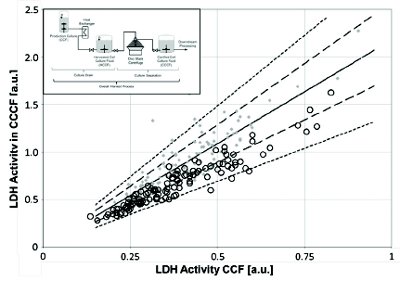 Figure 11. Performance of the harvest process in production line 7 (open circles) during established routine operations compared to the established production line 2 (grey triangles).
The impact of the new operating conditions on LDH release was tested by assessing overall process performance - including culture drain and separation.
As can be seen in Figure 6, a decrease of LDH release for the different operating conditions could be seen (see 1 and 2 in Figure 6). Condition 2 shows the lowest impact regarding LDH release representative for cell lysis. Hence, further tests were performed using the decreased bowl speed and operational setting for condition 2. The performance could be significantly increased during following test runs (Figure 7). Most results were within the 2 sigma range of the historical data. The adapted operating conditions were implemented in routine production following characterization and validation. Additional optimization of valve sequencing decreased the LDH activity further (Figure 8), emphasizing the needed end-to-end view of all process elements and peripheral equipment. An isolated view on type and operation of the centrifuge alone is not sufficient to describe the harvest process. This is comparable with results described by other authors for different aspects (e.g. hold times in pool vessels, pH control) [23-25]. On average, only an additional 3% LDH release could be seen for the separation process compared to total LDH activity in the culture. Upon adaptation of operational conditions the LDH release could be decreased from approximately 10% to 3% at condition 2 (Table 2), which is comparable to results published by Tebbe [16] for a comparable type of disk stack centrifuge using hybridoma cells at high cell densities. The batches performed in routine operation compared to the historical data for the overall process shown in Figure 7 clearly shows an improved performance.
Production Line 7
For production line 7 the separation efficiency and the LDH activity were measured for the different process conditions shown in Table 1. All operating conditions showed comparable performance and sufficient separation efficiency compared to the established production line 2. In this case the bigger capillary of 150 μm was used allowing only measurements of minimum particle size of 3 to 40μm instead of 1.4 to 30μm (see Analytical Methods). However, a comparable performance for production line 7 was concluded.
To assess the LDH release of the different operating conditions, first, the established condition followed by condition one and two were tested, each utilizing 1/3 of the HCCF at full scale. Figure 10 indicates the achieved results for the tested conditions including some additional tests, which will be explained in the following text.
Operating Conditions 1 and 2
As can be seen in Figure 10 the reduction of the bowl speed from the original condition to the two tested conditions led to a significant decrease of LDH release (gray triangles of standard condition 0 and adapted conditions 1 and 2). Although the impact of the decreased bowl speed in conditions 1 and 2 could be clearly seen during the test runs, when implemented for a full run, the effect unfortunately was not translated (open triangles) and LDH activity was comparable to the previously established condition showing significant increased LDH levels (open circles). Upon analysis, erroneous flow control was identified as a potential root cause for this overlaying effect.
As seen at production line 6, the valve sequencing and flow control can have significant input on harvest process performance due to perturbations in turbulence, flow velocities, and pressure drops.
Therefore, further analysis and optimization of valve sequencing and flow control was performed and led to enhanced in process performance. The improvement of adapting operating conditions as outlined in combination with valve sequencing, etc., led more consistent performance of the harvest operation during routine operations (Figure 11). Starting at an additional LDH release of 17%, the measures led to a significant decrease in shear force in the centrifuge. An average of 10% was achieved in condition 2 without optimized equipment conditions such as valve sequencing. For the further operationally optimized valve sequencing an average LDH release of 3% was achieved, consistent with low shear operations. The effect of the operational improvements can be seen in Table 3.
Conclusions
During the transfer and scale up of a large scale mammalian cell line manufacturing process for the production of a pharmaceutical active protein, signifi cantly different harvest performance in terms of cell lysis (release of LDH) was observed. The study shows that a systematic and knowledge-based approach is required to minimize impact on process performance. An initial facility assessment including peripheral equipment and process control capabilities is essential to exclude negative impacts to the process. In addition, detailed analysis and clear scale up criteria of the designed unit operations are required to mitigate risks during tech transfer and scale up. Simulation tools such as computational fluid dynamics and model particle systems might further enhance the knowledge base and decrease risks upfront. Other authors [32, 36] describe the successful application of CFD simulation and/or scale down studies to determine operational parameters and predicting at scale performance for industrial scale performance process and prevent pitfalls during scale up. In general, the simple application of traditional scale up parameters like equivalent settling velocity, tip speed, etc., might not predict at scale performance and therefore scale down models and simulation tools such as CFD help to mitigate risks during scale up. Here, these models were not available after initial failure a more including more traditional approach including full-scale studies was used to improve equipment and processes. Thorough review of all process steps during start up, qualification, and validation by a sustainable process monitoring concept is essential to drive excellence in operations and improve processes as required by the health authorities. A detailed analysis of each process step including solid risk assessments is needed to minimize impacts and accelerate trouble shooting. The knowledge increase during the performed studies will be subsequently applied to comparable processes and yield further enhancements. The utilization of scale down models to avoid costly failures at scale should be considered as well. Herein three major goals were achieved: detailed and structured analysis of the existing system and production process; optimization of the new production line; and improvement of the existing production line to increase process consistency across different facilities utilizing a conventional approach.
Acknowledgements The authors acknowledge the manufacturing staff from Roche Diagnotics GmbH, Penzberg, Germany.
References
- Reichert JM. Monoclonal antibodies in the clinic. Nat Biotechnol. 2001; 19:819–822.
- Reichert JM. Therapeutic monoclonal antibodies. Trends in development and approval in the US. Curr Opin Mol Ther. 2002; 4:110–118.
- Reichert JM, Pavolu A. Monoclonal antibodies market. Nat Rev Drug Discov. 2004; 3:383–384.
- Drapeau M, Sullivan, F, Moniz Carpenter, J. Special Report: Blockbuster Then and Now- Trends for Billion-Dollar Drugs. Spectrum Therapy Markets and Emerging Technologies. 2007; 12:1–39.
- Munos B. Lessons from 60 years of pharmaceutical innovation. Nature Reviews. 2009; 8:959–968.
- Xie L. Wang DIC. Integrated approaches to the design of media and feeding strategies for fed batch cultures of animal cells. Trends Biotechnol. 1997; 15(3):109–13.
- Qi HN, Goudar CT, Michaels JD, Henzler HJ, Jovanovic GN, Konstantinov KB. Experimental and theoretical analysis of tubular membrane. Biotechnol Prog. 2003; 19(4):1183– 1189.
- Wurm FM. Production of recombinant protein therapeutics in cultivated mammalian cells. Nat Biotechnol. 2004; 22:1393–1398.
- Sethuramann N, Stadheim TA. Challenges in therapeutic glycoprotein production. Curr Opin Biotechnol. 2006; 17(4):341–346.
- Heath C, Kiss R. Cell Culture Process Development: Advances in Process Engineering. Biotechnol Prog. 2007; 23:46–51.
- Su WW. Bioreactors, Perfusion. Encyclopedia of Cell technology. 2003; 978–993. John Wiley & Sons. Inc.
- Shukla A, Thömmes J. Recent Advances in Large-Scale Production of Monoclonal Antibodies and Related Proteins. Trends in Biotechnol. 2010; 28:253–261.
- Kempken R, Preissmann A, Berthold W. Clarification of Animal Cell Cultures on a Large Scale by Continuous Centrifugation. J Industr Microbiol. 1995; 14:52–57
- Seewoester T. Cell Separation and Product Capture. In: Oztuk S, Hu W-S. Editors, Cell culture technology for pharmaceutical and cellular therapies. New York: Taylor and Francis; 2006; 417–438
- Van Reis R, Leonard LC, Hsu CC, Builder SE. Industrial Scale Harvest of Proteins from Mammalian Cell Culture by Tangential Flow Filtration. Biotechnol & Bioeng. 1991; 38:413–422.
- Tebbe H, Luetkemeyer D, Gudermann F, Heidemann R, Lehmann J. Lysis Free Separation of Hybridoma Cells by Continuous Disc Stack Centrifugation. Cytotechnol. 1996; 22:119– 127.
- Wiesmann U, Binder H. Biomass separation from liquids by sedimentation and centrifugation. Advances in Biochemical Engineering. 1982; 24:119–171.
- Brunner KH, Hemfort H. Centrifugal Separation in Biotechnological Processes, In: Editor Mizrahi. Downstream Processes and Equipment and Techniques, Advances in Biotechnological Processes and Techniques, New York, A R Liss, 1991; 8:1–50.
- Dahlstrom DA, Bennet RC, Emmet RC. Liquid Solid Operations and Equipment: Centrifuges. In: Perry RH, Green SDW, Maloney JO. Editors, Perry’s Chemical Engineering Handbook, New York, McGraw Hill. 1997; 7th edition, 18–106.
- Mannweiler K, Hoare M. The Scale Down of an Industrial Disc Stack Centrifuge, Bioprocess Eng. 1992; 8:19–25.
- Hamamoto K, Ishimaru K, Toshiaki M. Perfusion Culture of Hybridoma Cells Using A Centrifuge to Separate Cells from Culture Mixture. Cytotechnol. 1990; 3:329.
- Pham C. Solid Liquid Separation of Mammalian Cell Culture Suspension Using a Continuous Disc Stack Centrifuge. Presentation Recovery and Purification. November 2002.
- Trexler-Schmidt M, Sargis S, Chiu J, Sze-Khoo S, Mun M, Kao YH, Laird MW. Identification and Prevention of Antibody Disulfide Bond Reduction During Cell Culture Manufacturing. Biotechnol & Bioeng. 2010; 106:452–461.
- Mullan B, Dravis B, Lim A, Clarke A, Janes S, Lambooy P, Olson D, O’Riordan T, Ricart B, Tulloch AG. Disulphide Bond Reduction of a Therapeutic Monoclonal Antibody during Cell Culture Manufacturing Operations. BMC Proceedings 2011; 5(Suppl.8):P110.
- Kao YH, Hewitt DP, Trexler-Schmidt M, Laird MW. Mechanism of Antibody Reduction in Cell Culture Production Process. Biotechnol & Bioeng. 2010; 107:622–632.
- Robert F, Bierau H, Rossi M, Agugiaro D, Soranzo T, Broly H, Mitchell-Logean. Degradation of an Fc-Fusion Recombinant Protein by Host Cell Protease: Identification of a CHO Cathepsin D Protease. Biotechnol and Bioeng. 2009; 104(6):1133–1141.
- Takagi M, Ilisa M, Yoshida. Selective Retention of Active Cells Employing Low Centrifugation Force at Medium Change During Suspension Culture of Chinese Hamster Ovary Cells Producing tPA. J Biosci Bioeng. 2000; 89:340–344.
- US Department of Health and Human Services, Food and Drug Administration. Guidance for Industry – Process Validation: General Principles and Practices, Jan 2011; Rev 1.
- Babson AL, Babson SR. Kinetic colorimetric measurement of serum lactate dehydrogenase activity. Clin Chem. 1973; 19:766–769.
- Legrand C, Bour JM, Jacob C, Capiaumont J, Martial A, Marc A, Wudtke M, Kretzmer G, Demangel C, Duval D, Hache J. Lactatae Dehydrogenase activity of the number of dead cells in the medium of cultured eukaryotic cells as marker. J Biotechnol. 1992; 25:231–243.
- Wagner A, Marc A, Engasser JM. The USE of LDH Release kinetics for the Evaluation of Death and Growth of Mammalian Cells in perfusion Bioreactors. Biotechnol and Bioeng. 1992; 39:320–326.
- Boychyn M, Yim SSS, Bulmer M, More J, Bracewell DG, Hoare M. Performance prediction of industrial centrifuges using scale down models. Bioprocess Biosyst Eng. 2004; 26:385-391.
- Boychyn M, Doyle W, Bulmer M, More J, Hoare M. laboratory Scaledown of Protein Purification Processes Involving Fractional Precipitation and Centrifugal Recovery. Biotechnol and Bioeng. 2000; 69:1-10.
- Hutchinson N, Bingham N, Murrel N, Farid S, Hoare M. Shear Stress of mammalian Cell Suspensions for Prediction of Industrial Centrifugation and Its Verification. Biotechnol and Bioeng. 2006;95:483-491.
- Tustian AD, Salte H, Willoughby NA, Hassan I, Rose MH, Baganz F, Hoare M, Titchener- Hooker NJ. Adapted Ultra Scale-Down Approach for Predicting the Centrifugal Separation Behavior of High Cell Density Cultures. Biotechnol Prog. 2007; 23:1404-1410.
- Tait AT, Aucamp JP, Bugeon A, Hoare M. Ultra Scale Down Model prediction Using Microwell Technology of Industrial Scale Clarification Characteristics by Centrifugation of Mammalian Broths. Biotechnol and Bioeng. 2009;104:321-329.
Author Biography
Michael Pohlscheidt, Ph.D., received his degree in bioengineering in 2001 from the University of Applied Sciences in Aachen, Germany. His Ph.D. thesis was performed at Bayer HealthCare AG and Bayer Technology Services and guided by the University of Magdeburg, Germany (2005). From 2005 to 2010, he worked in different positions at Pharma Biotech Production & Development, Roche Diagnostics GmbH, Penzberg, Germany. Since 2010, he has worked at Genentech Inc., Oceanside, CA, first as an associate Director Manufacturing Science and Technology and since 2012 as Director of Manufacturing Operations.