Introduction
The interest in two-dimensional HPLC (2DLC) in pharmaceutical analysis has been increasing quickly in recent years as illustrated by recent journal publications and presentations at analytical conferences. Although two-dimensional separation technology and theory was introduced more than 30 years ago [1-3], the liquid chromatography applications were mostly in proteomics, natural products, biological samples and polymers, and were limited in pharmaceutical analysis until recent years. The increased interest is probably due to new challenges in pharmaceuticals and the recent advances of 2DLC hardware, software and column technologies. Most of the 2DLC applications reported thus far used “homemade” instruments and software. The recent commercialization of 2DLC instrumentations and software plays an important role in the growing interest to apply this technology in pharmaceutical analysis.
Peak Capacity and Orthogonality in 2DLC
In multidimensional liquid chromatography, the sample or a portion of the sample is subject to more than one separation mechanism. The multiplicity of the peak capacity is a major attraction for multidimensional separation. As illustrated in Figure 1a, the peak capacity of 2DLC is the product of peak capacity of each dimension in an ideal situation where the two dimensions are totally orthogonal. Peak capacity is the maximum number of peaks that can fit into the retention space. Liu and co-workers [4] proposed a geometric approach to factor analysis to evaluate the practical peak capacity and effective orthogonality of 2D separation. Choosing orthogonal separation mechanisms in each dimension is critical to maximize the peak capacity in 2DLC. Figure 1b shows a case where two HPLC methods are orthogonal and Figure 1c shows a case where two methods are not orthogonal.
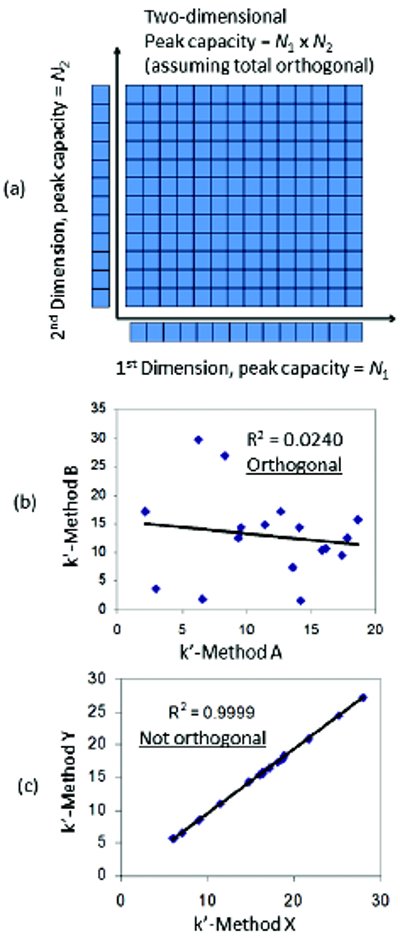
Figure 1. (a) 2DLC peak capacity illustrated by retention plane in a perfect case of two dimensions are totally orthogonal (b) The correlation of the retention factors k’ of method A and method B (c) The correlation of the retention factors k’ of method X and method Y
Challenges in HPLC analysis of pharmaceuticals
Bringing well-characterized, high quality drug to patients quickly is a major task in pharmaceutical analysis. 2DLC has been used to solve the separation challenges that cannot be achieved by one-dimensional HPLC (1DLC), and to increase the separation speed of 1D separation. Figure 2 illustrates some key challenges of using conventional HPLC in pharmaceutical analysis. These are listed below.
- Peak co-elution is a major concern. Peaks could co-elute with API and other impurities or components.
- Poorly retained peaks that eluted in the solvent front are frequently overlooked.
- Impurities with no UV-chromophores are easily missed by commonly-used HPLC-UV method.
- Phosphate buffers are frequently used for better chromatographic performance, but they are not MS compatible.
- Multiple HPLC methods are needed for chiral compounds, especially those with multiple chiral centers.
- Some strongly-retained components may not elute in the method run time.

Figure 2. Challenges in pharmaceutical analysis illustrated by a simulated chromatogram
For these challenges, while the overly-retained components are manageable by holding the organic solvent at higher percentage for a longer time, others are difficult to overcome by a conventional, onedimensional separation.
It is important to note that impurity levels are typically low in pharmaceutical materials since the safety bar is high and the regulatory requirements are strict. This is different from proteomics and natural products, where multiple components may present at relatively higher levels. The different sensitivity requirement and number of components make a difference when choosing the best 2DLC mode for analysis. Pharmaceutical materials are typically made from high purity starting materials and strictly-controlled manufacturing process are used to ensure the impurities are controlled at low levels. Multiple factors must be considered when setting the criteria for impurity control, but generally ICH Q3A [5] guidance recommends setting 0.05% as the reporting limit, 0.10% as the identification limit and 0.15% as the quantification limit for drug substance, and ICH Q3B [6] is referred to for drug product analysis. In the case of genotoxic impurities, ppm level control may be required.
2DLC separation modes
Heartcutting 2DLC
Heartcutting 2DLC is an effective way to resolve pharmaceutical challenges [7-11]. It typically transfers one or two fractions of interest from the first dimension (1st D) to the second dimension (2nd D). The instrumentation setup is simple and data analysis is straightforward. A distinct advantage of heartcutting is the 2nd D method run time is independent of the sampling rate from the 1st D; therefore a relatively longer method can be used to increase resolution and sensitivity. These factors are particularly important for trace level analysis. The tradeoff is longer separation time especially when multiple peaks are of interest. To mitigate this issue, we developed an on-line multiheartcutting 2DLC system [9]. In pharmaceutical analysis, normally only certain peaks or certain regions in the 1st D are of interest and it is not necessary to transfer the entire 1st D eluent to the 2nd D. The on-line multi-heartcutting mode allows greater fl exibility.
Comprehensive 2DLC
Comprehensive-mode 2DLC typically transfers the entire 1st D eluent in fractions into the 2nd D. A comprehensive profile of the sample can be obtained in a short time period by using this mode. It is popular for samples containing a large number of relatively high-level components, such as proteomics, natural products and polymers. Stoll gave an excellent review of recent progress in online comprehensive 2DLC for non-proteomic applications [12]. The applications of on-line comprehensive 2DLC in pharmaceutical analysis remain limited in the literature although this has increased in recent years [13-15] .
In comprehensive 2DLC mode, the 2nd D separation must be very fast to accommodate the 1st D sampling rate and avoid sample loss. For a fast method, for instance with a 24-second cycle time, the chromatographic performance such as resolution and sensitivity can be significantly reduced, especially for low level impurities. The introduction of UHPLC and new column technologies such as sub-2 μm and core-shell (or fused-core) particles greatly improved this issue. The selective comprehensive separation mode reported by Stoll and co-workers is an effective way to resolve this issue [16-17]. Elevated temperature is also a popular approach to increase the separation speed, but it is not preferred for pharmaceutical tests due to the uncertainty of compounds stability under high temperature.
On-line comprehensive 2DLC can generate a large amount of data in a short time, but the data analysis is challenging. The background noise from the valve switching can significantly interfere with the lowlevel peak signal. Improved hardware as well as advanced software is critical to fully utilize the separation power of on-line comprehensive 2DLC in pharmaceutical analysis for complex samples, such as forced degradation studies.
Offline 2DLC
Offline 2DLC transfers the fractions from the 1st dimension to the 2nd dimension not in real time. It can be carried out on a conventional 1D HPLC. The fractions are collected manually or by a fraction collector, and then re-injected to the same or different HPLC for further analysis, typically with a different column or mobile phase. It can be operated in either heart-cutting or comprehensive modes. Because of its simplicity and fl exibility of the sample fraction treatment, such as evaporating the solvent to concentrate the sample, it is still popular in research [18- 19], as well as in practical use. Offl ine 2DLC is popular in pharmaceutical Labs for qualitative work, e.g. separate matrix or buffer interference in the 1st D and do MS structure elucidation in the 2nd D. Apparently, it is more time- and labor-consuming.
Applications of 2DLC in pharmaceutical analysis
1. Peak Co-Elution and Peak Purity

Figure 3. Peak co-elution analysis using 2DLC
A major application of 2DLC is to separate peaks that co-eluted in the conventional HPLC methods [9, 10, 15]. This is the basis for peak purity assessment, method specificity, stability-indicating method development and many other applications in the below sections. Figure 3 shows the 2DLC separation of a stability sample of an active pharmaceutical ingredient (API) spiked with three processrelated impurities. The 1st D used a typical reversed-phase column and phosphate buffer/acetonitrile gradient separation. The API and three impurities were separated. Each of the four peaks were further evaluated in the 2nd D by using on-line multi-heartcutting 2DLC technology to evaluate if there are any hidden impurities. The 2nd D method used a different type of reversed-phase column and formic acid/ACN gradient separation. Each of the fractions were found to have small peaks that were hidden by co-elution in the 1st D.
2. Method Specificity and Stability-indicating Method Development
Method specificity is a component of method development and validation. Specificity is the ability to assess the analyte unequivocally in the presence of impurities, degradants, the matrix, etc. There are two ways to use 2DLC for method specificity and similarly for stabilityindicating method development. One approach is to check the specificity of an established 1DLC method. In this case, the established method is used in the 1st D, and orthogonal methods are used in the 2nd D to screen the appropriate sample set to check if there is any peak that might be missed by the established method. The 1DLC method may need to be updated based on the findings from 2DLC. The other approach is to use 2DLC in the situation that a 1DLC method is in lack of specificity, and then a 2nd D separation is used to compensate the method specificity.
3. Impurity and Degradation

Figure 4. The 2D (top) and 3D (bottom) profi les of a pharmaceutical material with structure-related impurities using comprehensive 2DLC
Profiling Forced degradation samples are typically more complicated than the clinical materials. Rapid comprehensive impurity profiling is highly desirable in evaluating the stability of drug candidates, as well as developing a stability-indicating HPLC method. Using UHPLC in the 2nd D is highly effective to facilitate the comprehensive impurity profi le screening [19].
Figure 4 shows the separation of a pharmaceutical material with structure-related impurities by using on-line comprehensive mode 2DLC. A commercial software was used to generate the profile plots. Different columns and mobile phases were used in each dimension to maximize the method orthogonality and consequently peak capacity in the 2D space.
Hyphenated detection is highly desirable for complete sample profiling. As indicated earlier, some of the components or impurities may not have UV-chromophores. Multi-dimensional separation coupled with hyphenated detection is a powerful way to get a complete profile of a sample [18, 20]. Our lab uses UV-CAD-MS detection in 2DLC work for impurity and degradation profiling [9].
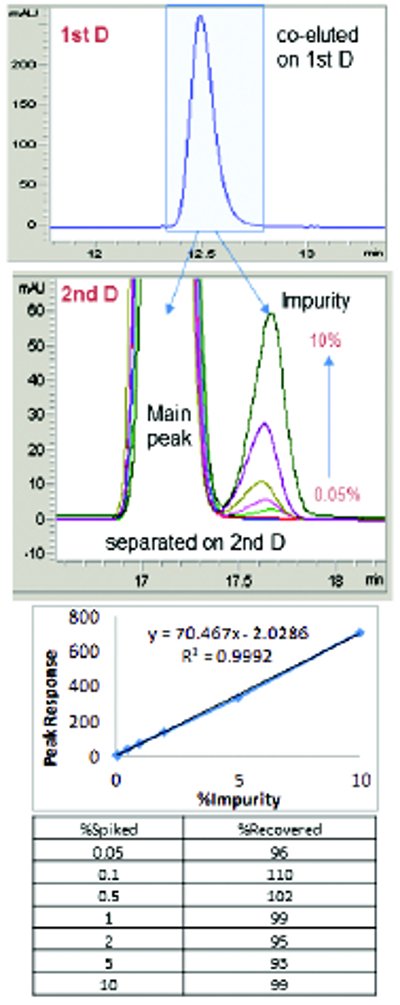
Figure 5. 2DLC separation and quantifi cation of an impurity that co-eluted with the main peak in the fi rst dimension
4. Quantification by 2DLC
Figure 5 shows the 2DLC separation and quantification of a lowlevel impurity that co-eluted with the main peak in the first dimension. Single complete heart-cutting of the whole peak in the 1st dimension was employed. The single complete heart-cutting is a preferred separation mode for quantification because there is no sample loss and data analysis is straightforward. The impurity spiked at levels from 0.05% to 10% was sensitively quantifi ed with good linearity and accuracy. Comprehensive 2D mode quantification using advanced software was reported by Reichenbach et al. and Mondello et al. [21-23].
5. 2DLC-MS
Low-level impurities that co-elute with or elute close to the major component or stronger ionization species could be significantly suppressed, and thus undetected. 2DLC-MS is an effective way to reduce signal suppression caused by matrix interference from strongly ionized components, as well as non-volatile buffers, such as phosphate buffers. 2DLC-MS enables using phosphate buffer in the 1st dimension to achieve the desired chromatographic performance, while using MS compatible mobile phases in the 2nd D to obtain the MS structural information [9, 24]. Additionally, 2DLC-MS gives unambiguous peak tracking. Mass spectrometry sometimes is treated as a “third added dimension” to 2DLC to generate more information of compounds that may not be fully resolved chromatographically [11, 25].
6. Chiral Separation
Using one dimension to separate achiral impurities or matrix and the other dimension to separate enantiomers or derivatives have been reported for 2DLC chiral separation of amphetamine , pantoprazole and lansoprazole , and for the determination of enantiomeric excess in reaction mixtures [26-28]. There are also applications reported for chiral separation of amino acids [29, 30].
7. Others
2DLC can also be used as a tool to remove sample matrix, and thus to reduce the sample preparation or purification work [8, 28, 31]. Other 2DLC applications have included preparative scale separation and purification, on-line concentration for the analysis of low-level impurities [32, 33].
Platform 2DLC strategy
2DLC method development is much more complicated than 1DLC. In addition to the factors that must be considered in 1DLC, many more factors are involved in 2DLC method development. These include, but are not limited to, sampling rate and fraction volume from the 1st D, the loop size, organic and buffer strengths in different fractions, and solvent compatibility between two dimensions. At the same time, the components, impurities and degradation products in pharmaceutics could have a wide range of physical and chemical properties. To turn 2DLC from a special research tool into routine use, especially in a regulated environment, a platform 2DLC strategy is highly desirable, including instrumentation, software and implementation strategy. The platform strategy is particularly desirable for pharmaceutical analysis, where reproducibility, accuracy, sensitivity, robustness and method transferability are critical factors. A generic platform 2DLC strategy with easy-to-use software and hardware will provide the busy analysts a solution or at least a readily available starting point for their applications.
Summary
2DLC greatly enhances the separation power of one-dimensional separation. The interest in 2DLC in pharmaceutical analysis has increased rapidly in recent years due to the advances and commercialization of 2DLC hardware, software, and new column technologies. 2DLC has been applied to address pharmaceutical challenges such as resolving peak co-elution, impurity quantification, peak purity assessment, stability-indicating method development, 2DLC-MS, chiral separation, etc. A platform strategy is highly desirable when using 2DLC routinely. An increase in 2DLC applications for pharmaceutical analysis is expected in the years to come.
Author biographies
Kelly Zhang, Ph.D., is a Scientist in the Small Molecule Analytical Chemistry and Quality Control group at Genentech. She obtained her Ph.D. in Analytical Chemistry in 1999 from Wuhan University, China. Prior to joining Genentech in 2007, she was a Senior Scientist at Allergan and Pfizer.
Jenny Wang M.S., is a Research Associate in the Small Molecule Analytical Chemistry and Quality Control group at Genentech. She was formerly Scientist/Associate Scientist at Allergan, Arena Pharmaceutical and Pfizer. She holds a Master’s degree in Chemistry from the University of Scranton.
Midco Tsang B.S., is a Research Associate in the Small Molecule Analytical Chemistry and Quality Control group at Genentech. She earned a B.S. in Biochemistry from California State University. Her research interests involve HPLC method development for chiral and achiral pharmaceutical compounds and 2DLC. She was an analytical chemist for Chevron Corporation.
Larry Wigman Ph.D., is an Analytical Chemist by training with his doctorate from Duke University. Larry has held various positions including: Senior Research Scientist at Pfizer, Manager at Mylan, Associate Director at Sanofi, Principal Consultant at Regulitics LLC; and, most recently Senior Scientific Manager of the Small Molecule Analytical Chemistry and Quality Control Group at Genentech.
Nik Chetwyn Ph.D., is the Head of the Small Molecule Analytical Chemistry and Quality Control group at Genentech. Prior to joining Genentech, he was an Associate Director at Pfizer and a Research Investigator at GlaxoSmithKline. Nik received his Ph.D. from the University of Kansas.
References
- Erni F, Frei RW. Two-dimensional column liquid chromatographic technique for resolution of complex mixtures. Journal of Chromatography A 1978, 149 (0), 561-569.
- Guiochon G, Beaver LA, Gonnord MF, Siouffi AM, Zakaria M. Theoretical investigation of the potentialities of the use of a multidimensional column in chromatography. Journal of Chromatography A 1983, 255 (C), 415-437.
- Giddings JC. Two-dimensional separations: concept and promise. Analytical Chemistry 1984, 56 (12), 1258A-1270A.
- Liu Z, Patterson DG, Lee ML. Geometric Approach to Factor Analysis for the Estimation of Orthogonality and Practical Peak Capacity in Comprehensive Two-Dimensional Separations. Analytical Chemistry 1995, 67 (21), 3840-3845.
- International Conference on Harmonization (ICH) Guidelines. Impurities in new drug substances Q3A (R2). October 2006.
- Internatinoal Conference on Harmonization (ICH) Guidelines. Impurities in new drug products Q3B (R2). June 2006.
- Sheldon EM. Development of a LC–LC–MS complete heart-cut approach for the characterization of pharmaceutical compounds using standard instrumentation. Journal of Pharmaceutical and Biomedical Analysis 2003, 31 (6), 1153-1166.
- Schadt HS, Gössl R, Seibel N, Aebischer CP. Quantification of vitamin D 3 in feed, food, and pharmaceuticals using high-performance liquid chromatography/tandem mass spectrometry. Journal of AOAC International 2012, 95 (5), 1487-1494.
- Zhang K, Li Y, Tsang M, Chetwyn NP. Analysis of pharmaceutical impurities using multiheartcutting 2D LC coupled with UV-charged aerosol MS detection. Journal of Separation Science 2013, 36 (18), 2986-2992.
- Lee C, Zang J, Cuff J, McGachy N, Natishan TK, Welch CJ, Helmy R, Bernardoni F. Application of Heart-Cutting 2D-LC for the Determination of Peak Purity for a Chiral Pharmaceutical Compound by HPLC. Chromatographia 2013, 76 (1-2), 5-11.
- Matejicek D. Multi heart-cutting two-dimensional liquid chromatography–atmospheric pressure photoionization-tandem mass spectrometry method for the determination of endocrine disrupting compounds in water. Journal of Chromatography A 2012, 1231 (0), 52-58.
- Stoll DR. Recent progress in online, comprehensive two-dimensional high-performance liquid chromatography for non-proteomic applications. Analytical and Bioanalytical Chemistry 2010, 397 (3), 979-986.
- Venkatramani CJ, Zelechonok Y. An automated orthogonal two-dimensional liquid chromatograph. Analytical Chemistry 2003, 75 (14), 3484-3494.
- D’Attoma A, Grivel C, Heinisch S. On-line comprehensive two-dimensional separations of charged compounds using reversed-phase high performance liquid chromatography and hydrophilic interaction chromatography. Part I: Orthogonality and practical peak capacity considerations. Journal of Chromatography A 2012, 1262, 148-159.
- Alexander AJ, Ma L. Comprehensive two-dimensional liquid chromatography separations of pharmaceutical samples using dual Fused-Core columns in the 2nd dimension. Journal of Chromatography A 2009, 1216 (9), 1338-1345.
- Groskreutz SR, Swenson MM, Secor LB, Stoll DR. Selective comprehensive multidimensional separation for resolution enhancement in high performance liquid chromatography. Part II: Applications. Journal of Chromatography A 2012, 1228 (0), 41-50.
- Groskreutz SR, Swenson MM, Secor LB, Stoll DR. Selective comprehensive multi-dimensional separation for resolution enhancement in high performance liquid chromatography. Part I: Principles and instrumentation. Journal of Chromatography A 2012, 1228 (0), 31-40.
- Schiesel S, Lämmerhofer M, Lindner W. Comprehensive impurity profiling of nutritional infusion solutions by multidimensional off-line reversed-phase liquid chromatography×hydrophilic interaction chromatography-ion trap mass-spectrometry and charged aerosol detection with universal calibration. Journal of Chromatography A 2012, 1259, 100-110.
- Huidobro AL, Pruim P, Schoenmakers P, Barbas C. Ultra rapid liquid chromatography as second dimension in a comprehensive two-dimensional method for the screening of pharmaceutical samples in stability and stress studies. Journal of Chromatography A 2008, 1190 (1-2), 182-190.
- Ni Y, Liu Y, Kokot S. Two-dimensional fingerprinting approach for comparison of complex substances analysed by HPLC-UV and fluorescence detection. Analyst 2011, 136 (3), 550-559.
- Reichenbach SE, Kottapalli V, Ni M, Visvanathan A. Computer language for identifying chemicals with comprehensive two-dimensional gas chromatography and mass spectrometry. Journal of Chromatography A 2005, 1071 (1–2), 263-269.
- Reichenbach SE. Quantification in Comprehensive Two-Dimensional Liquid Chromatography. Analytical Chemistry 2009, 81 (12), 5099-5101.
- Mondello L, Herrero M, Kumm T, Dugo P, Cortes H, Dugo G. Quantification in Comprehensive Two-Dimensional Liquid Chromatography. Analytical Chemistry 2008, 80 (14), 5418-5424.
- Conti M, Motta R, Puggioli C, Brambilla P. Surface-activated chemical ionization-electrospray ionization mass spectrometry combined with two-dimensional serial chromatography is a powerful tool for drug stability studies. Rapid Communications in Mass Spectrometry 2013, 27 (11), 1231-1236.
- Donato P, Cacciola F, Tranchida PQ, Dugo P, Mondello L. Mass spectrometry detection in comprehensive liquid chromatography: Basic concepts, instrumental aspects, applications and trends. Mass Spectrometry Reviews 2012, 31 (5), 523-559.
- Pastor-Navarro MD, Porras-Serrano R, Herráez-Hernández R, Campíns-Falcó P. Automated determination of amphetamine enantiomers using a two-dimensional column-switching chromatographic system for derivatization and separation. Analyst 1998, 123 (2), 319-324.
- Barreiro JC, Vanzolini KL, Cass QB. Direct injection of native aqueous matrices by achiral-chiral chromatography ion trap mass spectrometry for simultaneous quantification of pantoprazole and lansoprazole enantiomers fractions. Journal of Chromatography A 2011, 1218 (20), 2865-2870.
- Liu Q, Jiang X, Zheng H, Su W, Chen X, Yang H. On-line two-dimensional LC: A rapid and efficient method for the determination of enantiomeric excess in reaction mixtures. J Sep Sci 2013, http://dx.doi.org/10.1002/jssc.201300412.
- Hamase K, Morikawa A, Ohgusu T, Lindner W, Zaitsu K. Comprehensive analysis of branched aliphatic d-amino acids in mammals using an integrated multi-loop two-dimensional columnswitching high-performance liquid chromatographic system combining reversed-phase and enantioselective columns. Journal of Chromatography A 2007, 1143 (1–2), 105-111.
- Venkatramani CJ, Wigman L, Mistry K, Chetwyn N. Simultaneous, sequential quantitative achiral–chiral analysis by two-dimensional liquid chromatography. Journal of Separation Science 2012, 35 (14), 1748-1754.
- Jayamanne M, Granelli I, Tjernberg A, Edlund PO. Development of a two-dimensional liquid chromatography system for isolation of drug metabolites. Journal of Pharmaceutical and Biomedical Analysis 2010, 51 (3), 649-657
- Rezadoost H, Ghassempour A. Two-dimensional hydrophilic interaction/reversed-phase liquid chromatography for the preparative separation of polar and non-polar taxanes. Phytochemical Analysis 2012, 23 (2), 164-170.
- Yamamoto E, Niijima J, Asakawa N. Selective determination of potential impurities in an active pharmaceutical ingredient using HPLC-SPE-HPLC. Journal of Pharmaceutical and Biomedical Analysis 2013, 84, 41-47.