Introduction
This article focuses on the capability of portable and benchtop Raman spectrometers for the conformation of authenticity of pharmaceutical products, including the detection of counterfeit products. Counterfeiting is an ongoing global problem for the pharmaceutical industry.1 Most importantly, it poses a serious risk and threatens the lives of patients. The technological advancement of optical components, CCD detectors, and solid state lasers allowed the miniaturization of Raman spectrometers.2 Portable Raman spectrometers have proven to be suitable tools for raw material identification including direct testing in warehouses or at incoming inspection3 and their benefits have been discussed in the literature at great lengths.4 The technology is also implemented for verification of counterfeit medicine5 and allows the user to “bring the lab” closer to the area where the counterfeit activities are taking place (such as deceitful manufacturing facilities, pharmacies, hospitals, warehouses, and storage facilities).
Verification of suspect product is performed by acquiring a spectrum and correlating it with the library spectra collected from authentic product. This can be performed by using either the probabilistic p-value test or spectral correlation algorithm. The portable Raman instrument used in this study is equipped with a built-in algorithm that generates the ‘Pass/Fail’ result based on p-value. However, there is a misconception that minimal knowledge is required to understand or even question the outcome of `Pass/Fail’ test results displayed by the portable Raman units. Portable technology is gaining a larger audience but the users should have an understanding of its capabilities as well as its limitations since the Raman spectral measurements can be affected by various factors such as fluorescence, spectral noise, poorly resolved peaks, and others that can influence the ‘Pass/Fail’ results.
This article illustrates two examples related to the identification of counterfeit drug products. One study discusses how the p-value can be influenced by the low-dosage drug formulations, while the second study shows the effect of the sample dilution on the `Pass/Fail’ results. The authors of this article aim to answer the following questions: Can an analysis performed using the handheld unit alone truly authenticate the suspect material? How reliable is the result? What are the aspects to consider, especially when using the technology for suspect/counterfeit verification? In summary, in certain cases, further testing with a benchtop system needs to be performed to verify the authenticity of the product in question.
The p-value in a portable Raman spectrometer is based on the null hypothesis test that helps to answer a question about the likelihood of the sample being what it is supposed to be above a certain confidence level.6 The p-value can range from 0 to 1 indicating either no agreement (for p-value = 0) or a perfect match (p-value = 1) between the collected spectrum of the suspect sample and the signature spectra of an authentic library.7 The confidence level in portable unit is set to 95% providing a cut off for ‘Pass’ and ‘Fail’ determination. The p-value equal to or above 0.05 generates a ‘Pass’ result while a p-value of less than 0.05 indicates that the sample spectrum is significantly different from the authentic spectrum and the null hypothesis should be rejected. This generates a ‘Fail’ result for the analysis of the suspect product.
The benchtop unit used in this study is a Fourier Transform (FT) Raman system that uses the spectral correlation algorithm by performing a cross-correlation between the spectrum of a measured sample and the validated spectral library of authentic sample. The spectral library must contain the spectrum similar to unknown spectra for the search to be useful. The correlation algorithm results in a match value that ranges from 0 to 100. The higher the match value the stronger the resemblance between the unknown spectrum and the chosen library. The library search does not populate ‘Pass/Fail’ results, however, the user can establish the correlation search limits so that a ‘Match/No Match’ decision is displayed. To improve the spectral match outcome, high-resolution spectra with acceptable Signal-to-Noise ratio (S/N) should be collected when developing the libraries. In some cases, performing a library search using a specific spectral region can also improve the match value.8 This particular practice, if used appropriately, proves to be valuable when dealing with low-dosage drug formulations for suspect and counterfeit products. The absence of an active pharmaceutical ingredient (API) in counterfeit formulations can also be verified by a lack of Raman bands in the sample spectrum corresponding to the API. Therefore, confirming the presence of characteristic Raman bands in a selected spectral region provides another way of verification when using library searching.
Case 1–Counterfeit and Authentic Tablets Identification Generates Similar Results for p-Values
Method Development for Portable and Benchtop FT-Raman Spectrometers
Two individual methods were developed for each of the Raman spectrometers using reference spectra collected from 3 authentic drug tablets. No spectral pre-processing was performed on the acquired Raman spectral data. Two placebo tablet samples were investigated using handheld and benchtop FT-Raman spectrometers. The placebo tablets were not true counterfeits, however, since they contained no API, they were considered ‘working’ counterfeit samples and are referred to as ‘counterfeit tablet samples’.
To build the method for the handheld unit, 2 signature spectra were acquired from each of the 3 authentic tablet samples for a total of 6 signature spectra which were used to build the authentic spectral library method. The spectral acquisition parameters such as scanning time and the number of acquisitions were automatically determined by the portable unit based on the strength of the Raman signal from the authentic tablets. Each of the 6 signature spectra was computed by averaging spectra collected during acquisition time for each signature and therefore, resulted in a high-quality spectrum with high S/N ratio. The developed method containing all the 6 spectra was then validated using a new batch of authentic tablet samples. After validation, the method was subsequently used to verify the identity of the counterfeit tablet samples. It is important to note that during the verification process and later counterfeit identification, the handheld unit collects a single Raman spectrum against the developed method. The collection time and quality of the single spectrum differ from that of signature spectrum simply because it is a single spectral acquisition and not an average of many spectra. The single spectrum typically shows a low S/N ratio and is of poor spectral quality when compared to the signature. The user cannot select the same spectral acquisition parameters for verification and counterfeit identification that were used to acquire signature spectra during the method development. This is one of the major limitations in the portable Raman spectrometer used in this study. The p-values for the counterfeit tablet samples are summarized in Table 1.
Table 1. The p-Values and Match Values for Counterfeit and Authentic Tablets Generated with Portable and Bench Top FT- Raman Spectrometers.
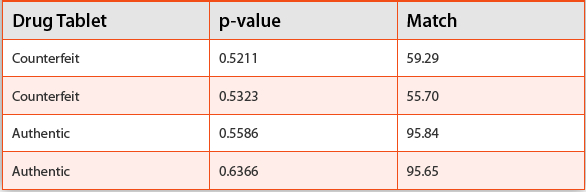
For the benchtop FT-Raman unit, the reference library was developed by collecting 2 spectra from each of the 3 authentic tablets. The acquisition parameters were optimized so that the resulting library spectra were of high resolution and showed a high S/N. As before, each library spectrum was averaged over multiple scans. To check the validity of the match values, 2 additional spectra were collected from a new batch of authentic tablet samples and run against the developed library. Once the library was validated, 2 Raman spectra for each counterfeit tablet samples were collected using the same spectra acquisition parameters. With a benchtop FT-Raman unit, the user has the flexibility to apply the same acquisition parameters used for collecting the library spectra. The counterfeit spectra, therefore, are averaged over a number of scans and show similar strong S/N as that of the library spectra. The match values for the authentic and counterfeit tablet samples are presented in Table 1.
Results and Discussion
In general, if a chemical compound is Raman active, it will generate a fingerprint pattern that is unique and well defined and can be used to identify the compound, similar to the way human fingerprints are used to identify a specific person. The spectral region between 200 and 1800 cm-1 is referred to as the fingerprint region since it corresponds to molecular vibrations. Additionally, the C-H vibrations are typically observed around 3000 cm-1 whereas the lattice vibrational modes of crystalline structures are predominantly observed at frequency below 200 cm-1.
Figures 1 and 2 present three Raman spectra corresponding to the signature, authentic, and counterfeit tablet samples acquired with portable Raman spectrometer. Due to different spectral acquisition parameters, it can be seen that the signature spectrum is of the highest quality when compared to the authentic and counterfeit Raman spectra. All 3 spectra are dominated by 3 strong Raman bands below 700 cm-1 corresponding to titanium dioxide coating. When evaluating the signature spectrum, other less intense Raman bands that correspond to excipients and the active ingredient can be identified. In the case of a low-dosage drug form, Raman bands characteristic of the API can be weak and overshadowed by excipient bands that are present at much higher concentrations. In our example, the investigated tablets consisted of only 5 mg of API but the API used in this particular drug formulation exhibits a distinctive C≡N stretch band at 2242 cm-1 as shown in Figure 4. The location of C≡N stretch band made it highly suitable for discrimination between the authentic and counterfeit tablets since there are no Raman bands from any of the excipients in the tablet in that spectral region. However, Raman spectra of authentic (used for verification) and counterfeit tablet samples were collected with a single scan and resulted in poor spectral quality with a high noise level. Consequently, C≡N stretch band in the spectrum for an authentic tablet appeared to be buried in the noise of the baseline and resembled the Raman spectrum of the counterfeit tablet sample. The p-values for authentic and counterfeit tablet samples were found to be similar. The builtin p-value algorithm failed to differentiate between the 2 types of tablet samples.
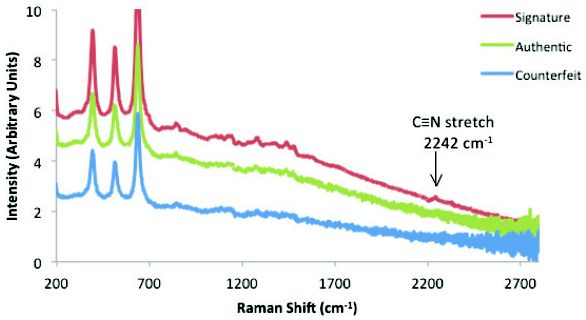 Figure 1. Raman Spectra for Signature, Authentic, and Counterfeit Tablet Samples Collected with Portable Raman Spectrometer.
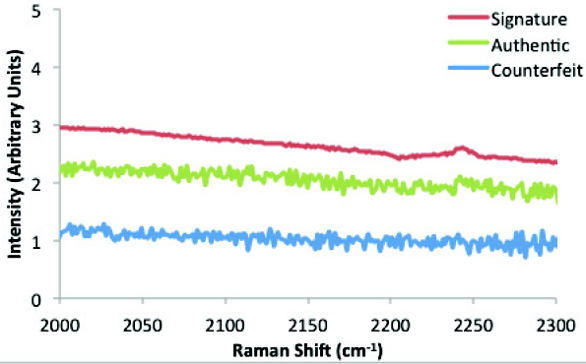 Figure 2. Spectral Range Showing the Characteristic C≡N Stretch Band at 2242 cm-1 in Raman Spectra of Signature, Authentic, and Counterfeit Tablet Samples Collected with Portable Spectrometer.
The analysis was repeated using the benchtop FT-Raman spectrometer. A reference spectral library was created with high resolution Raman spectra from authentic tablet samples. Spectra collected for counterfeit tablet samples were of comparable spectral quality since the same spectral acquisition parameters were used. Figure 3 depicts the Raman spectra corresponding to authentic and counterfeit tablet samples.
 Figure 3. Spectral Range Showing the Characteristic C≡N Stretch Band at 2242 cm-1 in Raman Spectra of Spectra for Authentic and Working Counterfeit Tablet Samples Collected with Bench Top FT-Spectrometer.
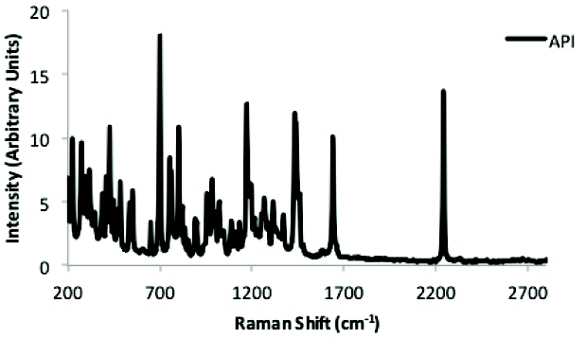 Figure 4. Raman Spectrum of API with Characteristic C≡N Stretch Band at 2242 cm-1 collected with Bench Top FT-Raman.
The library matching was performed by matching Raman spectra of counterfeit tablets against a developed library. Since the C≡N stretch band was determined to be highly indicative of the API, the library searching was performed using the specific spectral search region from 2225 cm-1 to 2260 cm-1 that encompasses the frequency of the C≡N band. The calculated match values discriminated between the 2 types of tablets presented in Table 1. Selecting the spectral match range and also collecting high-resolution Raman spectra under the same acquisition parameters as the library spectra resulted in a more credible classification between the 2 types of tablets. The p-value results generated by portable Raman spectrometer were highly influenced by the noise in the collected spectra which is likely due to the single scan acquisition. In addition, the compact design, optics, and the CCD detectors in portable Raman spectrometers result in lower signal sensitivity than in the benchtop unit.
Case 2–Identification of Diluted Drug Capsules Results in False Positive p-Values
Method Development for Portable and Benchtop FT-Raman Spectrometers
Two authentic 200-mg capsules from 2 individual batches were used to develop the portable Raman signature. Validation of the method was performed by scanning 2 additional authentic 200-mg capsules and generating ‘Pass’ results. The specificity of the method developed for the portable Raman spectrometer was tested by running a set of diluted samples made from 200-mg authentic capsules. The capsules were prepared in duplicates by mixing the content with lactose—a commonly used pharmaceutical excipient—at 40% and 50% weight dilutions. The diluted drug capsules, therefore, produced ‘working counterfeit’ samples. A true counterfeit drug capsule was also included in the study.
For the benchtop FT-unit, Raman spectra from 2 different batches and from 2 authentic capsules for each batch were collected and added to the spectral library. Prior to the analysis of diluted and counterfeit capsules, the library match was validated by collecting spectra from a new batch of authentic capsules. No spectral pre-processing was performed on any of the acquired Raman data. The match values were calculated using the full spectral range. The p-values and match values for diluted drug and true counterfeit capsules are summarized in Table 2.
Table 2. The p-Values and Match Values for Authentic, Diluted and Counterfeit Drug Capsules Collected with Portable and Benchtop FT-Raman Spectrometers.

Results and Discussion
When the working counterfeit samples were tested against the developed method using a portable unit, the two 50% diluted drug capsules generated false positive results and were incorrectly identified as authentic drug products. The generated p-values of 0.0594 and 0.0563 were just above the threshold limit of 0.05 which is set automatically in the portable unit. An analysis of the 40% dilutions showed contradicting results. One of the capsules passed with p-value of 0.0828 and the second failed with p-values of 0.0494. The method was further challenged and ultimately verified with 30% working counterfeit capsules which generated ‘Fail’ result (ie, as not authentic). The library search performed on the Raman spectra for diluted drug capsules collected with the benchtop unit showed the match values to be more indicative of the dilutions. The match values of 93.79 and 98.95; and 88.19 and 69.77 were calculated for capsules with 50% and 40% diluted drug, respectively, whereas the authentic 200- mg capsule showed almost perfect match of 99.2. The match value variability among the diluted samples is attributed to the collection of a single spectrum from a single spot for each analyzed sample. It should be noted that the true counterfeit drug capsule was properly identified on both portable and the benchtop units. Figure 5 depicts Raman spectra of authentic and diluted drug capsules whereas, and Figure 6 shows Raman spectrum of true counterfeit drug capsule. In both figures, the signature spectrum was added for comparison.
 Figure 5. Raman Spectra for Signature, Authentic, and Diluted Drug Capsules Collected with Portable Raman Spectrometer.
 Figure 6. Raman Spectra for Signature and Counterfeit Drug Capsules Collected with Portable Raman Spectrometer.
Conclusion
Raman spectroscopy has rapidly evolved over the past 10 years and offers many benefits that include smaller, faster, and portable units that can be very advantageous especially when working to verify counterfeit medicine. This technology is here to stay, and although it brings many advantages, users need to be mindful that the use of portable instruments for counterfeit verification is not without limitations. The degree of uncertainty in the results can be due to spectral features such as S/N, fluorescence, sample properties, or another random variability of the spectral data. The users should consider using more than 1 correlation method and/or spectral technique for product authentication when the result generated by the Raman portable instrument is close to the threshold value (ie, a p-value of 0.05). The results are not necessarily trust-worthy until further verification is performed. A complementary spectroscopic technique such as near infrared spectroscopy is a suitable choice.
References
- Newton PN, MD Green, FM Fernandez. Impact of Poor-quality Medicines in the ‘Developing’ World. Trends in Pharmacological Sciences. 2010;31:99-101.
- Schneider T. Non Linear Optics in Telecommunications, Springer-Verlag. 343-367.
- Green, R, et al. Verification Methods for 198 Common Raw Materials Using a Handheld Raman Spectrometer. Pharmaceutical Technology. 2009:33(10).
- Kalyanaraman R, Dobler G, Ribick M. Portable Raman Spectroscopy for Pharmaceutical Counterfeit Identification. European Pharmaceutical Review. October 2012;17(5):35-39.
- Kalyanaraman R, et al. Screening and Detecting Counterfeit Biologics Drugs. BioPharma Asia. January/February, 2013:58-64.
- Snijders TAB. Hypothesis Testing, in International Encyclopedia of the Social and Behavioral Sciences. Elsevier, Ed. Amsterdam. 2001:7121-7127.
- Bugay DE, Brush RC. Chemical Identity Testing by Remote-Based Dispersive Raman Spectroscopy. Applied Spectroscopy. 2010;64(5):467-475.
- Improving Search Results Using High Resolution Libraries. In Application Note: 50745, Thermo Scientific.
Author Biographies
Anna Luczak, PhD, is a Scientist at Bristol-Myers Squibb Company in the Global Analytical Technology group with Global Manufacturing and Supply and is currently working on development of novel spectroscopic method for detection of counterfeit biologics. She received her PhD in Analytical Chemistry from New Jersey Institute of Technology under the direction of Prof. Zafar Iqbal where she explored Raman spectroscopy for various pharmaceutical applications. Before joining BMS in 2014, she worked at Johnson and Johnson where she was responsible for process improvements of existing products including scale-up and transfer to the supplier site.
Ravi Kalyanaraman, PhD, is an Associate Director at Bristol-Myers Squibb Company in the Global Analytical Technology group with Global Manufacturing and Supply. He received his PhD from the University of Idaho in 1996 and did his post-doctoral work at the University of Puerto Rico. He has been with Bristol-Myers Squibb since 2002. His recent work with Bristol-Myers Squibb has been focused on developing new and novel techniques to detect pharmaceutical counterfeits, raw material identification using vibrational spectroscopic techniques, such as Raman, mid-, and near-infrared. He also leads the analytical team that is involved in the analysis of products received from complaints and from corporate security groups.