Abstract
PAT scientists are needed for the continuing progress of this important regulatory initiative. This review describes experiments useful in training students to understand two essential PAT tools: near infrared (NIR) and Raman spectroscopy. The first experiment has helped students understand the effect of baseline and optical path length on NIR spectra. The second experiment is essential to understand NIR and Raman spectra. The fundamental aspects from these experiments are discussed and reference is made to a number of scientific articles where they are further illustrated.
Introduction
The implementation of the PAT Guidance as A Framework for Innovative Pharmaceutical Development, Manufacturing, and Quality Assurance requires thorough process understanding of pharmaceutical processes.1 The Guidance includes tenets such as:
- “Within an established quality system and for a particular manufacturing process, one would expect an inverse relationship between the level of process understanding and the risk of producing a poor quality product.”
- “For processes that are well understood, opportunities exist to develop less restrictive regulatory approaches to manage change (eg, no need for a regulatory submission).”
These tenets require personnel with process knowledge; experience in risk management and quality systems; regulatory knowledge; and expertise in the design, analysis, and control of processes. The high degree of complexity of these fields and procedures require a PAT team, since it will be difficult to find a person with expertise in all fields.2 The PAT team or group may include specialists in the analytical spectroscopic techniques and chemometrics, but also requires industry veterans with knowledge of pharmaceutical processes. Training of the PAT teams is necessary for team members to understand each other. PAT challenges have encouraged industrial veterans to learn about NIR and Raman spectroscopy, two of the most commonly used techniques in the PAT toolbox. At the same time, industrial leaders have asked academic groups to encourage more students to become involved in PAT research efforts. Academic research groups are now developing a “pipeline” of human resources in support of the PAT and QbD initiatives. The two experiments described in this article have been used successfully in training industry veterans and students new to NIR and Raman spectroscopy.
There are several reasons why both Raman and NIR spectroscopy are widely used in PAT applications. Both techniques are non-destructive analytical techniques, capable of analyzing materials in their current state without sample preparation (without dissolving the materials). Spectral acquisition is sufficiently fast in both techniques, permitting the monitoring of pharmaceutical processes as these occur. Both techniques permit non-invasive analysis where the probe is not directly in contact with process materials.3 Thus, the physical properties of samples are retained while NIR and Raman spectra are obtained. The measurement of physical properties reduces the risk of producing a poor quality product by addressing the root causes of manufacturing problems as particle size distribution and powder flow could lead to segregation while crystal form affects the drug’s solubility. NIR methods have been developed providing valuable information on powder flow properties, particle size distribution and also crystal form.4–7 Raman spectroscopy has been especially valuable in monitoring crystal form and film coating thickness.8–13 Thus, a Raman or NIR spectrum may be used to determine the concentration of an API and also study its physical properties.14,15 In summary, both analytical techniques reduce the risk of manufacturing a poor quality product by addressing the root causes of product performance issues.
NIR spectroscopy
Newcomers to NIR spectroscopy are often uncomfortable with the baseline differences observed in NIR spectra, thinking that these are related to instrument instability.
A simple experiment with a plastic sheet protector can be used to understand the baseline changes often observed in NIR spectra. The plastic sheet can be cut into smaller pieces sufficiently large enough to cover the system’s integrating sphere window. The light source within the integrating sphere accessory then illuminates the film from below as shown in the top right photograph in Figure 1. The NIR spectrum is then obtained and a high baseline is observed as seen in Figure 1. The high baseline is explained by the following equations:
Absorbance = log (1/R) = log (I0/Ir) (1)
R = Ir/I0 (2)
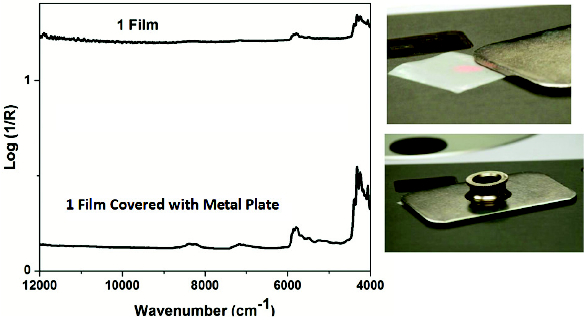 Figure 1. NIR diffuse reflectance spectra obtained with a single polymeric film placed over the window of the system’s integrating sphere (photo top right). The bottom spectrum is obtained by covering the film with a metal plate (photo bottom right).
where Ir is the intensity of the radiation that returns to the diffuse reflectance detector, and I0 is the total radiation intensity that goes to the detector from the reference ceramic used in the NIR spectrometer. The high baseline obtained with one film is due to Ir values substantially lower than I0. When the spectrum of the thin film is obtained some of the radiation is absorbed by the film, and some is remitted (back scattered) and focused on the integrating sphere detector (below the film). However, most of the radiation is transmitted through the thin film and lost, as it never reaches the integrating sphere detector leading to the low Ir values and the high baseline. The film may then be covered with a metal plate forcing the radiation to come back through the film on its way to the integrating sphere and detector. The baseline of the covered film will be significantly less, and actually close to a value of 0. The radiation passed through the film is no longer lost, Ir/ Io approaches a value of 1, and the baseline is now close to 0 as seen in Figure 1.
The bottom spectrum in Figure 1 also shows stronger bands than the top spectrum. The stronger bands are the result of absorption when light from the source hits the film and also when the radiation is forced by the metal plate to come back through the film. The distance traveled through the film increased when the metal plate was placed over the film. The experiment shows that higher baseline does not mean higher absorbance. Higher baseline means that less light is reaching the detector when the spectrum of a sample is obtained, than when the spectrum of the reference material was obtained, IrI0. Figure 2 shows spectra obtained when 1, 5, 10, or 20 plastic sheets (films) are placed over the integrating sphere’s window. The baseline decreases as the number of films is increased, since less light is lost through transmission. Figure 2 also shows that absorbance bands increase as the number of films increase. The radiation that is transmitted through the first film could be absorbed by the second film, or back scattered and transmitted through the first film to the detector. As the number of films is increased there are more opportunities for light to be absorbed as it travels towards the outer films or when it travels back to the detector. Each film receives less light than the previous film. This experiment was used to develop the representative layer theory of diffuse reflectance, a theory that is based on the interaction of light with particles.16–18 The theory associated with the experiment is complex and beyond the scope of this article. The experiment is important in teaching the need to visualize the interaction between light and particles (sample). The analyst must visualize the number of film layers to understand remission and transmission and to ensuing increase in absorbance. Visualization is not necessary in analytical techniques where samples are dissolved and the solid-state structure is lost. Visualization is essential in a non-destructive analytical technique such as NIR spectroscopy, and its understanding requires studying the interaction between light and particles.
 Figure 2. NIR diffuse reflectance spectra obtained as the number of polymeric films placed over the window of the system’s integrating sphere was increased. 100% T line obtained by using the reference ceramic as both sample and reference spectrum.
The same experiment also explains the concept of depth of penetration of NIR radiation. The absorbance bands will stop increasing after about 22 to 23 films are measured and the baseline will no longer be reduced. The sample is then considered “infinitely thick”, and increasing the film layers will not change the spectrum or the sample volume interrogated by the NIR radiation. Figure 2 also shows the 100%T line, obtained when Ir= I0, obtained simply by measuring the spectrum of the ceramic reference as both the sample spectrum and the reference spectrum. The 100% T line will be very close to zero, as it is essentially the log of 1. The baseline of the “infinitely” thick samples will not reach zero, as some radiation will not return to the integrating sphere detector.
The depth of penetration of NIR radiation is extremely important in the comparison NIR results with those obtained with sample destructive techniques such as high performance liquid chromatography (HPLC). The HPLC method will dissolve the entire sample. However, NIR spectra might analyze only the top 200 milligrams of the sample, leading to differences in the results from the two methods. This sampling error is often the main reason for differences between NIR and HPLC methods, and now many NIR methods provide an estimate of the sample volume analyzed.19–21
Changes in the NIR spectral baseline are also observed for flowing powders, samples with different particle sizes, or samples with uneven surfaces. In all of these cases, the fraction of light received by the detector is not constant. The powder flow or uneven surface, may lead to radiation going in a direction that is not collected by the optical system and not focused on the detector. Thus, if only a fraction of the remitted radiation (Ir) reaches the detector (Idet), this relationship may be described by equation (4)
Idet= 1/c x Ir (4)
In a flowing powder or uneven surface, 1/c, is constantly changing. If Ir is substituted into Eq (1) by Idet then:
Absorbance = log (I0/Idet)
= log c + log (I0/Ir) = c’ + A
The fraction 1/c then becomes the spectral off set c’.22 The baseline will change according to the changes in 1/c. This relationship was observed in a set of experiments where NIR spectra were obtained as a funnel filled with powder was emptied.4–6 Powder flow was not constant and as a result 1/c varied constantly. The same effect may be observed for NIR spectra of particles suspended in air during drying in a fluid bed granulator.14,23
Raman spectroscopy
In Raman spectroscopy radiation from a laser interacts with the electron cloud, creating a short-lived virtual state that is not stable and, consequently, the radiation is quickly reradiated. Thus, the intensity of Raman bands depends on the change in the polarizability of the electron cloud around the molecule. In NIR spectroscopy, O-H bands will be strong but weak in Raman spectroscopy. This advantage makes Raman spectroscopy a choice technique for monitoring crystallization in aqueous solutions.24,25 The simpler spectra with narrower bands has also lead to an increasing use of Raman spectroscopy in the identification of raw materials used in pharmaceutical and API bands and in other pharmaceutical applications.21,26
The acquisition and comparison of NIR and Raman spectra is extremely valuable in understanding the two spectroscopic methods. Figure 3 shows Raman and NIR spectra for ibuprofen. The Raman spectrum is characterized by a series of sharp bands, while the NIR spectrum shows a number of wide overlapping bands.
 Figure 3. Raman and NIR spectra for ibuprofen. The Raman spectrum is characterized by narrow bands while the NIR spectrum shows wide overlapping bands.
Figure 4 shows a pharmaceutical formulation with microcrystalline cellulose (MCC) obtained with a Raman instrument that includes a 785-nm laser. The use of MCC leads to the low frequency noise (wide curved band under the spectra) due to fluorescence (Figure 4 top spectrum). Mixtures of ibuprofen and MCC still show the narrow bands from ibuprofen but convoluted with MCC spectrum. The MCC fluorescence signal can be removed using derivatives.3
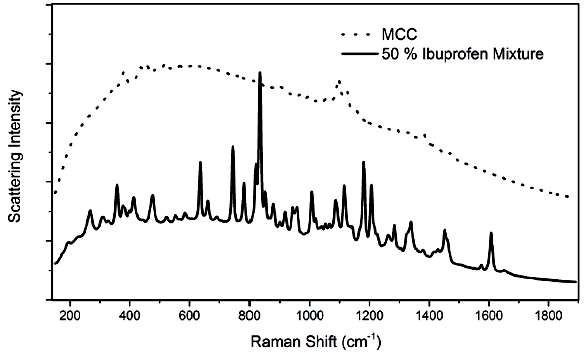 Figure 4. Raman spectrum for MCC (top) and 50% (w/w) ibuprofen and MCC mixture (bottom). The sharp ibuprofen bands are still observed but convolved with the low frequency noise associated with MCC.
Figure 5 shows NIR and Raman spectra for crospovidone, a super disintegrant used in pharmaceutical formulations. NIR spectra show wide overlapping bands, making it difficult to assign these bands to a specific functional group. Raman spectra show much narrower bands that may be assigned to functional groups. The intensity of NIR bands depends on the change in the dipole moment during the vibration. Thus, O-H bands will be strong in NIR spectroscopy, but very weak in Raman spectroscopy. Figure 5 clearly shows that differences in the O-H bands observed in the NIR spectra in the fi rst overtone band (~6900 -6600 cm-1), and the combination band (~5300- 5100 cm-1).
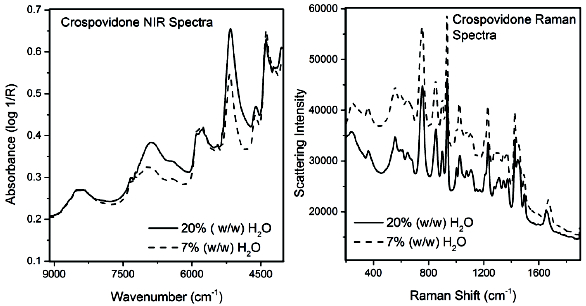 Figure 5. Crospovidone NIR and Raman spectra equilibrated to two different moisture levels.
Take-home message
NIR and Raman spectroscopy play a very important role in the PAT regulatory initiative. The use of experiments (hands-on experience)as described in this article can be very valuable in workshops to train industry veterans as well as undergraduate and graduate students.
Acknowledgments
The NSF ERC program and its funding of the Center for Structured Organic Particulate Systems grant number EEC-0540855 was essential to the progress of these experiments. Don Dahm is thanked for unforgettable discussions that shaped the NIR baseline experiment.
References
- Guidance for Industry PAT — A Framework for Innovative Pharmaceutical Development, Manufacturing, and Quality Assurance. Rockville, MD; 2004:1-16.
- Romanach RJ. PAT — a team effort. Pharm Technol Eur. 2008;20(10):44-46.
- Romero-Torres, S, Huang J, Hernandez-Abad P. Practical Considerations on PAT Analyzer Selection - Raman vs. NIR Spectroscopy. Am Pharm Rev. 2009;12(December):5-10.
- Barajas MJ, Cassiani AR, Vargas W, et al. Near-infrared spectroscopic method for real-time monitoring of pharmaceutical powders during voiding. Appl Spectrosc. 2007;61(5):490-6. doi:10.1366/000370207780807713.
- Ropero J, Beach L, Alcalà M, Rentas R, Davé RN, Romañach RJ. Near-infrared Spectroscopy for the In-line Characterization of Powder Voiding Part I: Development of the Methodology. J Pharm Innov. 2009;4(4):187-197. doi:10.1007/s12247-009-9069-z.
- Beach L, Ropero J, Mujumdar A, Alcalà M, Romañach RJ, Davé RN. Near-Infrared Spectroscopy for the In-Line Characterization of Powder Voiding Part II: Quantification of Enhanced Flow Properties of Surface Modified Active Pharmaceutical Ingredients. J Pharm Innov. 2010;5(1- 2):1-13. doi:10.1007/s12247-010-9075-1.
- Dziki W, Bauer JF, Szpylman JJ, Quick JE, Nichols BC. The use of near-infrared spectroscopy to monitor the mobility of water within the sarafloxacin crystal lattice. J Pharm Biomed Anal. 2000;22(5):829-48.
- Rantanen J, Wikström H, Rhea FE, Taylor LS. Improved understanding of factors contributing to quantification of anhydrate/hydrate powder mixtures. Appl Spectrosc. 2005;59(7):942-51. doi:10.1366/0003702054411670.
- Romero-Torres S, Wikström H, Grant ER, Taylor LS, Wikstrom H. Monitoring of Mannitol Phase Behavior during Freeze-Drying Using Non-Invasive Raman Spectroscopy. PDA J Pharm Sci Technol. 2007;61(2):131 - 145.
- Żarów A, Zhou B, Wang X, Pinal R, Iqbal Z. Spectroscopic and X-ray Diffraction Study of Structural Disorder in Cryomilled and Amorphous Griseofulvin. Appl Spectrosc. 2011;65(2):135-143. doi:10.1366/10-06024.
- Romero-Torres S, Pérez-Ramos JD, Morris KR, Grant ER. Raman spectroscopic measurement of tablet-to-tablet coating variability. J Pharm Biomed Anal. 2005;38(2):270-4. doi:10.1016/j. jpba.2005.01.007.
- Hagrasy AS El, Chang S, Desai D, Kiang S. Raman spectroscopy for the determination of coating uniformity of tablets : assessment of product quality and coating pan mixing efficiency during scale-up. J Pharm Innov. 2006;1(October):38-43.
- Müller J, Knop K, Thies J, Uerpmann C, Kleinebudde P. Feasibility of Raman spectroscopy as PAT tool in active coating. Drug Dev Ind Pharm. 2010;36(2):234-43. doi:10.3109/03639040903225109.
- Blanco M, Bautista M, Gonzalez JM. On-Line Monitoring of A Granulation Process By NIR Spectroscopy. J Pharm Sci. 2010;99(1):336-345. doi:10.1002/jps.
- Blanco M, Alcalà M, Menezes J, et al. Near-infrared Spectroscopy in Laboratory and Process Analysis. In: Encyclopedia of Analytical Chemistry; 2012:1-46. doi:10.1002/9780470027318. a9361.
- Dahm DJ, Dahm KD, Norris KH, Road M. Test of the representative layer theory of diffuse reflectance using plane parallel samples. J Near Infrared Spectrosc. 2000;8:171-181.
- Dahm D, Norris K, Mark H, Batten G, Marbach R, Dahm K. Speaking theoretically ...Things nobody knows but me. NIR News. 2010;21(2):14. doi:10.1255/nirn.1176.
- Dahm, DJ, Dahm K. Interpreting Diffuse Reflectance and Transmittance. A Theoretical Introduction to Absorption Spectroscopy of Scattering Materials. Chichester: NIR Publications; 2007:286.
- Iyer, M, Morris, HR, Drennen J. Solid dosage form analysis by near infrared spectroscopy: comparison of reflectance and transmittance measurements including the determination of effective sample mass. J Near Infrared Spectrosc. 2002;10:233-245.
- Popo M, Romero-torres S, Conde C, Romañach RJ. Blend Uniformity Analysis Using Stream Sampling and Near Infra- red Spectroscopy. AAPS PharmSciTech. 2002;3(3):1-11.
- Bellamy LJ, Nordon A, Littlejohn D. Real-time monitoring of powder mixing in a convective blender using non-invasive reflectance NIR spectrometry. Analyst. 2008;133(1):58-64. doi:10.1039/b713919e.
- Næs, T, Isaksson, T, Fearn, T DT. A user-friendly guide to Multivariate Calibration and Classification. NIR Publications; 2002:344.
- Rantanen J, Wikström H, Turner R, Taylor LS. Use of in-line near-infrared spectroscopy in combination with chemometrics for improved understanding of pharmaceutical processes. Anal Chem. 2005;77(2):556-63. doi:10.1021/ac048842u.
- Hu Y, Liang JK, Myerson AS, Taylor LS. Crystallization Monitoring by Raman Spectroscopy: Simultaneous Measurement of Desupersaturation Profile and Polymorphic Form in Flufenamic Acid Systems. Ind Eng Chem Res. 2005;44(5):1233-1240. doi:10.1021/ie049745u.
- Mercado J, Alcalà M, Karry KM, Ríos-Steiner JL, Romañach RJ. Design and In-line Raman Spectroscopic Monitoring of a Protein Batch Crystallization Process. J Pharm Innov. 2008;3(4):271-279. doi:10.1007/s12247-008-9046-y.
Bloomfield M, Andrews D, Loeffen P, Tombling C, York T, Matousek P. Non-invasive identification of incoming raw pharmaceutical materials using Spatially Offset Raman Spectroscopy. J Pharm Biomed Anal. 2013;76:65-9. doi:10.1016/j.jpba.2012.11.046.
Author Biographies
Rodolfo J. Romañach, PhD is Professor of Chemistry, and site leader for the NSF-ERC on Structured Organic Particulate systems (ERC-SOPS) at Mayagüez.
Eduardo HernándezTorres is a PhD candidate in the Chemistry Department and his research is focused on the development of non-destructive NIR methods to prediction dissolution in solid oral dosage forms.
Andres Román Ospino is a PhD candidate in the Chemistry Department and his research is focused on the real time prediction of drug concentration in continuous manufacturing of solid oral dosage forms.
Isamar Pastrana Otero is an undergraduate Chemical Engineering Student. She has research experience in NIR and Raman spectroscopy focused in the development of PAT methods for the pharmaceutical industry. She participated in the RiSE Summer Internship at Rutgers University during the summer of 2013.
Fabiola M. Semidei Ortiz is an undergraduate Chemical Engineering Student who will complete a Certificate in Pharmaceutical Engineering and has worked in the development of NIR and Raman methods for pharmaceutical applications.