Introduction
This article is the second part of an article titled, “How Clean is Clean in Drug Manufacturing?” The first article reminded practitioners that Cleaning is an official process, and introduced the term Equipment Cleaning Process (ECP) which will be used in this part as well. In addition, that article described tools that may aid practitioners in the establishment of appropriate residual limits. This article will present a number of tools that may be utilized for the measurement of ECP during all 3 stages of its continuum:
- Development of Cleaning Procedures by Research and Development groups (if it exists)
- Validation of Cleaning Procedures by Technical or Quality groups
- Application of Cleaning Processes by Operations/ Manufacturing organizations.
The key to control for any process resides in the understanding of its variability. How much do we know about the variation of our processes or systems and are we in the state of control? These questions require answers to achieve success in the execution of ECP. Understanding, detection, response, and control, from input through output of variation, consumed a focus of the revised FDA Process Validation Guidance1 to Industry (Figure 1).2,3
 Figure 1. Revised FDA process validation guidance.
Stage 1: ECP Design and Development
So how does one go about control of variation? To do that one has to enable a Risk Management System.2 To be highly effective, a Risk Management System needs to be initiated early on during the design and development of ECP. A rigorous application of Risk Management tools during Stage 1 (Process Design Stage) will help the practitioner to assess, understand, and ultimately control the level of variation in systems and processes. Therefore, Critical Quality Attributes and Critical Process Parameters should be established during risk assessment exercises. In addition to Risk Assessment exercises, experiments should be conducted to attain data about cleaning process being developed and understood. These Stage 1: Process Design studies should preferably utilize a statistical Design of Experiments (DoE) where appropriate. DoE is “a structured, organized method for determining the relationship between factors affecting a process and the output of that process.”4
As stated in the FDA Process Validation Guidance, “risk analysis tools can be used to screen potential variables for DoE studies to minimize the total number of experiments conducted while maximizing knowledge gained.” Further, this guidance says “the results of DoE studies can provide justification for establishing ranges of incoming component quality, equipment parameters, and in-process material quality attributes.”4 At the time of the Process Design, it is generally recognized that not all possible sources of variability will be known, however; if risk management is exercised to develop insightful DoE studies, they should help developing low variability process.
Additionally, comparative cleanability studies could be performed to compare products. For instance, Figure 2 shows Total Organic Carbon (TOC) results from such a study of 4 products. The study, the results of which are illustrated in Figure 2, was performed side-by-side by spiking coupons with products’ residuals and cleaning them using a worst case cleaning method used for all 4 products. The time taken to remove residuals was measured and compared. Prior to the experiment, all 4 products were evaluated by applying the firm’s theoretical “Worst Case” product matrix. Companies often use these matrices to determine the worst case product which ultimately will be used for a cleaning validation study. Typical evaluation factors include (but are not limited to):
- Solubility of active
- Cleanability of the active concentration
- Toxicity
- Complexity of the cleaning procedure
 Figure 2. Total organic carbon results from comparative cleanability studies.
The first 2 products (Product A and Product B) during this theoretical evaluation showed very similar scores. It should be noted here that active pharmaceutical ingredients (API) used in these products were very similar compounds, had similar solubility, and therefore were expected to show similar results for their cleanability. However, as seen in Figure 2, the study results were strikingly different. In order to conduct a side-by-side evaluation, the data for all products were normalized. This example shows how important it is to evaluate and compare all of the parameters by normalizing the data and plotting them on the same plane. What Figure 2 shows is that although Product B contains almost twice the concentration of an API, which, as we said earlier was theoretically very similar in solubility to Product A, it took approximately half the time to clean, as was measured by visual observation. In this case, although initial evaluation of the products, information did not reveal any significant differences, the results of the study and subsequent investigation showed that chemical interactions of ingredients in the formulation of Product A significantly contributed to a longer time to remove residuals. This was important to learn because just a theoretical evaluation wouldn’t have revealed this complexity. Therefore, it is recommended to perform studies and plot data normalizing them when appropriate so that they could be presented on the same plane so that previously unknown sources of variability could be found.
Stage 2: ECP Performance Qualification
The second stage of validation is called Performance Verification. This stage is customarily referred to as Cleaning Validation. Usually, 3 consecutive successful runs are performed to qualify the process using a well-characterized, well-documented, and consistent cleaning procedure. During these studies, one cleans the equipment, collects appropriate samples, and evaluates the data using pre-defined statistical tools. We should mention here that for years, it was not habitual to use statistics to evaluate ECP, and it might be a new concept for many readers.
The author of this article strongly encourages the usage of such methods as they will provide meaningful insights into sources of ECP variability. Remember that a result that you did not expect or is hard to explain still tells you something, and thus becomes part of the “story.” And we believe that each process tells a “story.” So what statistical methods should we employ during Stage 2: Process Qualification? We should first take into consideration what types of variability exist in a process. These types of variability are:
- Variability within each individual cleaning run (also called “inter-run” variability)
- Variability between the cleaning runs (also known as “intra-runs” variability)

The examination of variability within the cleaning run often reveals those parts of the equipment train or individual parts of equipment that perhaps are harder to clean or sample, thus possibly causing variable or aberrant results. However, if the cleaning process is consistent, the results of the validation studies should illustrate this consistency. The first step in the review of the data would be checking their normality. Don’t be discouraged, though, if your data set is non-normal. Non-normal is a very typical outcome of a cleaning validation study since the point of ECP is to remove manufacturing and cleaning process residuals completely. Therefore, the results of many sampling and tests yield either “0” or close to “0.” Upon finding out how normal your data is, one should calculate confidence intervals around sample results population data set.
A Confidence Interval (CI) gives an estimated range of values which is likely to include an unknown population parameter, the estimated range being calculated from a given set of sample data. If independent samples are taken repeatedly from the same population (consistent cleaning process should produce same results), and a CI calculated for each sample, then a certain percentage (confidence level) of the intervals will include the unknown population parameter. CIs are typically calculated so that this percentage is 95%, but we can produce 90%, 99%, 99.9%, etc, confidence intervals for the unknown parameter. Then we can examine tolerance intervals5 and perform early process capability analyses using normal and non-normal capability analyses (depending on normality of the data sets). When data are found to be non-normal, find the best fitting model.
The following inter-cleaning run variability analyses can be utilized for cleaning process qualification study examination:
- Individual value plot
- Box-plot
- ANOVA
- Two-sample t-test
- Two one-sided t-test
- Non-parametric tests (eg, Mann-Whitney test)
We will illustrate some of these tools in the following few examples. Figure 3 shows a Box-plot of TOC results of the cleaning studies of 7 products that utilize the same clean-inplace (CIP) cycle.
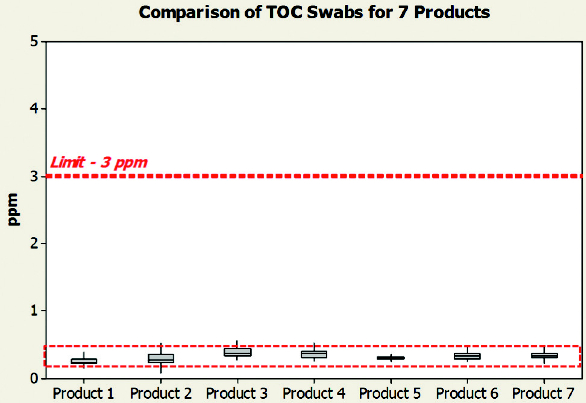 Figure 3. Comparison of total organic carbon for 7 products.
As we can see in Figure 3, all of the cleaning studies are quite similar and are well within set default limit of 3 ppm.*
Another test to evaluate the difference between cleaning validation runs is to use 2 sample t-tests to compare data populations for 2 runs. Figure 4 shows the result of such tests as produced by statistical package Minitab.
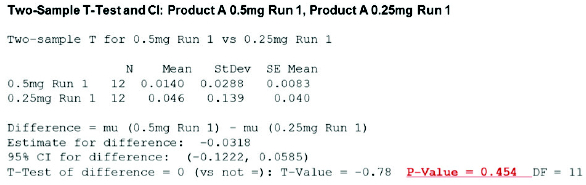 Figure 4. Results of 2 sample t-tests.
We may inspect a number of parameters presented in the Figure 4 summary. However, the most important one we are looking for is a p-value. The p-value or calculated probability is the estimated probability of rejecting the null hypothesis of a study question when that hypothesis is true. When the p-value is above 0.05 when using it to test null hypothesis that both cleaning runs represent same sample populations (because ECP should be consistent), then we can say that 2 population means are the same with 95% confidence. In this case, the p-value is 0.454 which well above a 0.05 p-value.
Additionally, two one-sided t-test (TOST) can be used to determine the equivalence of 2 data sets. When a regular t-test is used to conclude there is a substantial difference, we must observe a difference large enough to conclude it is not due to sampling error, p-value above pre-set α (eg, 0.05). TOST applies with equivalence testing to conclude there is not a substantial difference we must observe a difference small enough to reject that closeness is not due to sampling error from distributions centered on large effects (within 95%, 90%). Figure 5 illustrates the difference in the population tail examination between a regular t-test and TOST.
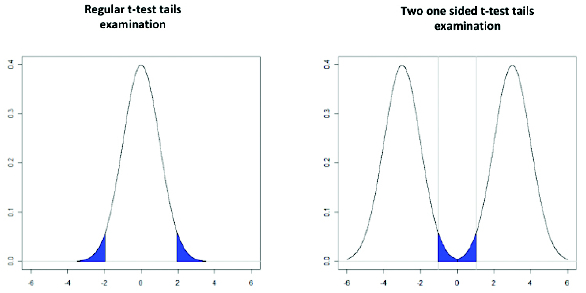 Figure 5. Difference in population tail examination between a regular t-test and TOST.
TOSTs may be used to evaluate the manufacturing process residual removal time for 2 cleaning validation runs or cleaning runs for 2 products using the same ECP. The swab tests’ TOC results for 2 data sets may be analyzed using Minitab software. The prerequisite for this kind of test is an equivalent sample size for both populations and normality of both populations. Provided these prerequisites are met, Figure 6 shows the outcome of this analysis for 2 products.
 Figure 6. Equivalence test results.
In the case of a cleaning evaluation (as seen in Figure 6), this statistical approach has been applied to determine the relative cleanability of 2 products.
The TOST compares 2 group means and their confidence intervals by comparing them to a predefined equivalence limit (90% in this example). The predefined equivalence limit is established by evaluating the variability involved with such evaluations. It should be noted that TOST is a statistical method accepted for evaluation of the equivalency between 2 groups of data such as bioequivalence (±20%)6 and Cleaning Validation.7
In addition, if it is possible to pool samples from all runs, individual run charts can be plotted, and overall ECP capability examined.
One more example of intra-run variability is non-parametric analysis. Since the population of TOC or other ECP results could be non-normally distributed, a non-parametric test for medians could be used to compare cleaning validation swab test results. The Mann–Whitney test is such a non-parametric test of the null hypothesis that is used to show that 2 populations are the same against an alternative hypothesis, especially when a particular population tends to have larger values than the other.
This test has a greater efficiency than the t-test on non-normal distributions, a mixture of normal distributions, and it is nearly as efficient as the t-test on normal distributions. Therefore, it could be used to compare any distribution. Minitab software was used to perform the test. In order to perform this test, certain procedures should be followed, particularly for the coding of data. In the example shown in Figure 7, TOC results from 0 to 1 ppm were coded as 1 and results 1.1 to 100 ppm were coded as 2. The Minitab summary shown in Figure 7 illustrates that 2 populations are similar with 0.9103 (91.03%) significance, thus proving their equivalence from 0 to 1 ppm, which was appropriate for examined ECP.
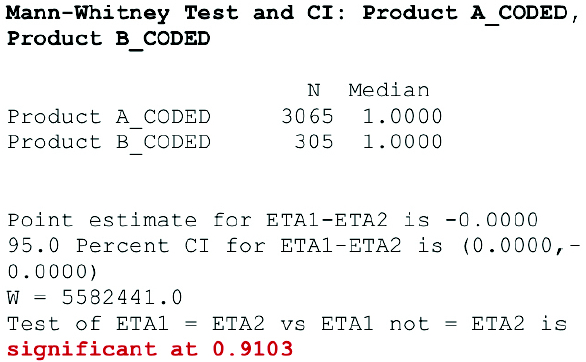 Figure 7. Mann-Whitney test results.
Stage 3: ECP Continued Process Verification
The last and the longest stage of validation is Stage 3, which encompasses validation maintenance or in other words verification that qualified cleaning process continues to perform consistently. It is also called continued verification process or CPV. Obviously, any changes to the process made since an initial qualification should be evaluated to assess the impact of each individual change, as well as a cumulative impact of all changes. However, it is also important to evaluate not only changes but also to establish meaningful verification program which would collect, evaluate, and trend data from each cleaning as well as conduct periodic cleaning verifications to assure that data attained during an original qualification study are representative of the cleaning process performed.
Typically one should see process capability improve as manufacturing operation groups should become more proficient in performing qualified ECP. Figure 8 illustrates 3 years’ worth of continued verification studies.
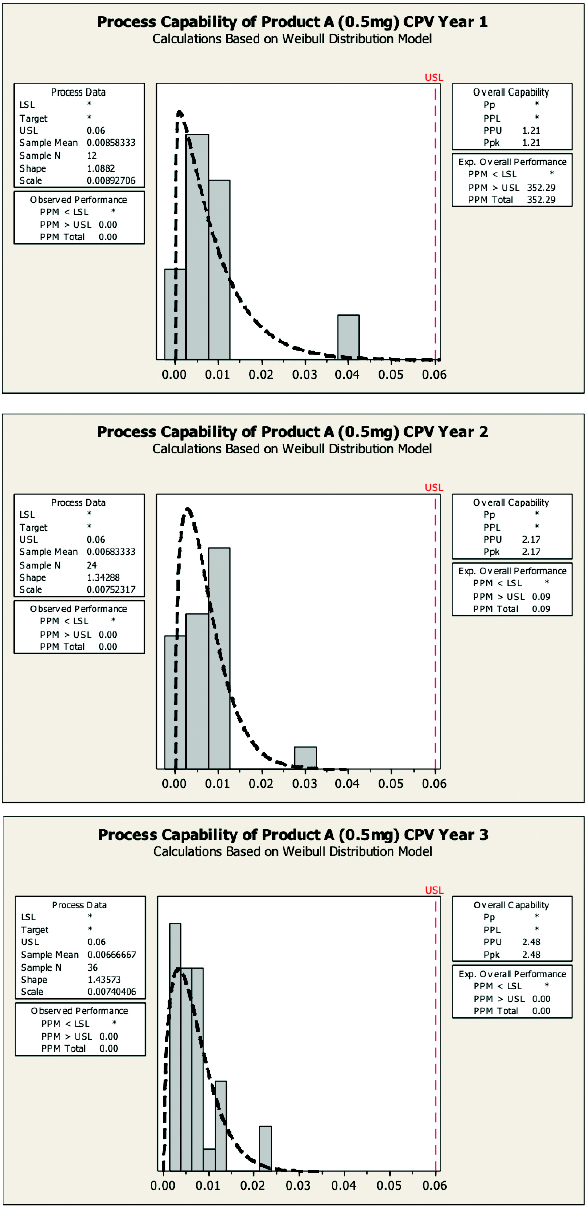 Figure 8. Process capability of Product A.
As shown in Figure 8, process capability indices of ECP improved from Ppk = 1.21 in Year 1 to Ppk = 2.17 in Year 2 and finally to Ppk = 2.43 in Year 3. One should notice that non-normal process capability analyses were used in these examples since the data sets were found to be non-normal.
It also should be noted that the goal of CPV should not only be confirmation of qualified cleaning methods but more important optimizations of ECP through learning and knowledge management. Because the cleaning of equipment is a critical official process, it should be treated as such and therefore be validated, in the same way, as a manufacturing process would be.
Conclusion
In conclusion, it is evident that a Process Validation lifecycle approach with its use of statistics is applicable to ECP validation. The risk and knowledge management methodology help us understand our process (eg, ECP), the products of the processes (eg, a clean surface), our variables, and ultimately gives us confidence during commercial production. Finally, utilization of statistics and statistical process controls are essential to effective and efficient ECP post-performance qualification monitoring programs. One more word of caution: it is recommended “that a statistician or person with adequate training in statistical process control techniques develop the data collection plan and statistical methods and procedures used in measuring and evaluating process stability and process capability.”1
References
- U.S. Department of Health and Human Services; Food and Drug Administration; Center for Drug Evaluation and Research (CDER); Center for Biologics Evaluation and Research (CBER); Center for Veterinary Medicine (CVM). Guidance for Industry. Process Validation: General Principles and Practices. January 2011. Available at: www.fda.gov/downloads/Drugs/GuidanceCompliance- RegulatoryInformation/Guidances/ucm070336.pdf. Accessed December 1, 2014.
- Technical Report No. 60: Process Validation: A Lifecycle Approach; Parenteral Drug Association: 2013. www.pda.org/bookstore (accessed March 14, 2013)
- Basemen H. Parenteral Drug Association (PDA) Process Validation Process Validation Training Course, 2013.
- U.S. Department of Health and Human Services; Food and Drug Administration; Center for Drug Evaluation and Research (CDER); Center for Biologics Evaluation and Research (CBER). Guidance for Industry. Q8(R2) Pharmaceutical Development. November 2009. Available at: http://www.fda.gov/downloads/Drugs/.../Guidances/ucm073507.pdf. Accessed December 1, 2014.
- ISO16269-6 Statistical interpretation of data—Part 6: Determination of statistical tolerance Intervals.
- U.S. Department of Health and Human Services; Food and Drug Administration; Center for Drug Evaluation and Research (CDER); Guidance for Industry. Statistical Approaches to Establishing Bioequivalence. January 2001. Available at: http:// www.fda.gov/downloads/Drugs/Guidances/ ucm070244.pdf. Accessed December 1, 2014.
- Chambers D, et al. Analytical method equivalency: an acceptable analytical practice. Pharm Technol. 2005;9:64–80.
Author Biography
Igor Gorsky has over 30 years of experience leading validation, technology transfer, quality assurance, and manufacturing functions in a wide range of pharmaceutical, biotechnology, and medical devices for generic and brandname firms. Currently, Igor is a Senior Consultant at ConcordiaValsource, LLC. Igor is a frequent speaker/writer on topics such as Cleaning Validation, Critical Utilities, Process Scale-Up and Validation, as well as Knowledge Management. He is active at PDA where he leads the Water Interest Group. Igor is one of the co-authors of PDA Technical Report 29—Points to Consider for Cleaning Validation and PDA Technical Report 60—Process Validation: A Lifecycle Approach. Igor holds a Bachelor's Degree in Electrical-Mechanical Engineering Technology from Rochester Institute of Technology.
*Default is limit presented for illustration only. Limits for each cleaning process should be determined and evaluated separately. Please refer to Part 1 of this article for information on determining product-specific limits.