The mention of specific products/instruments in this manuscript is for information purposes only and does not constitute an endorsement by the Food and Drug Administration and/or the Forensic Chemistry Center.
Abstract
Field and laboratory screening methods have been described for detecting counterfeit pharmaceutical packaging (cartons, bottles, etc) and finished dosage forms (tablets, capsules, etc) using an inhouse-developed novel handheld alternate light source (ALS) in combination with commercially available portable infrared and Raman spectrometers. The procedures developed using these technologies are fast, effective, and easy to learn, even for non-experts, and can be applied to both small and large-scale field operations.
Introduction
The United States Food and Drug Administration’s (FDA) Forensic Chemistry Center (FCC) has been involved in the analysis of counterfeit products since the early 1990s.1 The first counterfeit examinations conducted by the FCC focused on active pharmaceutical ingredients (APIs) and have since expanded to include finished product packaging materials (cartons, bottles, etc), finished dosage forms (tablets, capsules, solutions for injection, etc) and other products regulated by FDA such those listed in Table I .
Table 1. Counterfeit Products Examined by FDA’s Forensic Chemistry Center
The FCC uses a multidisciplinary approach to detect (screen) and characterize (source) counterfeit pharmaceuticals.1,2
Regarding counterfeit detection, most studies in the current literature focus on the finished product because it poses the highest risk to the consumer.1-6 Researchers have reported effective and straightforward laboratory-based analysis procedures for differentiating counterfeit and authentic finished dosages according to their API concentrations, impurities, chromatographic profiles, core/capsule content formulations, coating formulations, etc. Infrared and Raman spectroscopy have been employed for the analysis of counterfeit pharmaceuticals both in the laboratory and in the field using benchtop2-6 and handheld or portable units,7-9 respectively. Although handheld IR and Raman spectrometers are often able to examine finished dosages as well as the as-received state of the sample (typically consisting of some type of packaging), sample throughput is a major limitation because they are only able to examine one sample at a time. As a result, use of these techniques for large-scale field analyses is often prohibitively time consuming. However, these techniques are much more useful when used in conjunction with a visual screening tool that is able to rapidly examine large sample sizes.
The CDx is a novel ALS handheld device developed and built by the FCC that consists of several single-wavelength light-emitting diode (LED) light sources ranging between ultraviolet (UV) and short wavelength infrared (IR). The device is useful for providing visual comparisons between suspect and authentic products (both finished dosage and packaging).10-11 The unit contains 2 charge coupled device (CCD) cameras, each displaying on 2 separate screens, which allows for simultaneous UV, Visible, and IR mode viewing. Various color or cut-off filters can be placed on the CCD camera lenses to block the incident LED light wavelength allowing for better visualization of the differences between the suspect and authentic products. The two separate screens also permit the user to view a live image of the sample on one screen and a stored library image of the authentic product for comparison. The cameras can be used to capture digital images and videos on the other screen. The device also contains an external digital microscope that provides magnifications of 45× or 400×, which is useful for determining printing processes on packaging materials.
While the CDx is extremely versatile for screening large quantities of product (its finished dosage and packaging), its major limitation is a lack of chemical specificity. These advantages and limitations characteristic of the CDx device are the exact opposite of and the perfect complement to the those of the handheld IR and Raman instruments described above that yield high chemical specificity but a low sample throughput. For example, portable Raman spectrometers provide a unique chemical signature primarily based mainly on a material’s non-polar functional groups. It is non-destructive, requires no sample preparation, contains user-generated authentic product reference spectra, and is useful for examining minimally fluorescent products. Examination yields a spectrum characteristic of the intact tablet’s coating and core. Significant limitations include samples that exhibit strong fluorescence, only being able to examine 1 finished dosage at a time, and common excipients used to manufacture dosage forms are traditionally weak Raman scatters. Portable Infrared spectrometers provide a unique chemical signature primarily based on a material’s polar functional groups and are not hindered by fluorescence. This technique contains user-generated authentic product reference spectra and examination of intact tablets yields a spectrum characteristic of only the coating. However, it does require some sample preparation to achieve intimate sample/internal reflection element (IRE) contact and is also only able to examine a single finished dosage at a time. As indicated in Table 2, these techniques complement each other well when used collectively for screening counterfeit pharmaceuticals, which is why the FCC uses them regularly in an investigation .
Table 2. Handheld Instruments used by FCC in the Field

The intent of this manuscript is to describe how FCC uses these techniques for screening packaging materials and counterfeit finished dosage forms in and out of the laboratory for a more complete sample analysis .
Experimental
All suspect samples discussed were from criminal cases that have been adjudicated and all authentic products were received directly from the manufacturer. Detailed descriptions of the CDx, its operating principle, and previous versions of the device can be found elsewhere.10-15 Briefly, the device was used to illuminate suspect and authentic products (packaging and finished dosages) with different LED wavelengths (UV, visible, and infrared light) to highlight visual differences. Images were captured using the CDx’s CCD cameras. Images of printing processes were captured using the CDx digital microscope. In-lab screening was conducted using a forensic light source. The forensic light source uses a broadband tungsten light with different bandpass filters to illuminate counterfeit and authentic products (packaging and finished dosages) with UV, visible, and short wave near infrared wavelengths of light to highlight visual differences. Digital images were captured using a 35-mm digital single-lens reflex (SLR) camera fitted with either yellow or orange glass filters to block the incident wavelengths of light from the forensic light source.
Raman data were collected on an unmodified handheld Raman spectrometer which contains a 785-nm excitation laser. Spectra were collected from 250 to 2875 cm-1 with a resolution ranging between 7 and 11 cm-1. Infrared data were collected on an unmodified FTi handheld FT-IR spectrometer, which contains an attenuated total reflection (ATR) accessory with a diamond IRE. Spectra were collected from 4000 to 650 cm-1 with a resolution of 4 cm-1. Suspect product Raman spectra were compared to authentic product “methods” and Raman reference spectra stored in the portable units. The FT-IR spectra collected of the suspect samples were downloaded from the portable FT-IR and searched using application specific software.
Results
Over the years, FCC has received suspect counterfeit products from FDA regulatory and criminal investigators, other federal agencies, and other government regulatory agencies, ranging from a few tablets to several hundred cartons. When necessary, FCC analysts have been deployed into the field with 1 or more of the portable instruments described above to help screen products on site and to prioritize which samples will be sent back to the laboratory for confirmation. FCC analysts have validated 4 of these instruments internally and have successfully employed them domestically as well as internationally in Laos and Ghana.7-8,12-15 In fact, FDA field investigators are currently using the CDx at international mail facilities (IMFs) and other border entry points within the United States to screen packages for counterfeit pharmaceuticals.
Screening in the Field
ALS
Large sample sizes encountered in the field and/or large sample submissions received by the laboratory are often screened initially using normal/white light and an alternate light source (ALS). For example, the CDx was used to collect the images shown in Figure 1. Based on the white light image in Figure 1a, the suspect cartons appear similar to those of the authentic (outlined by the red box). However, clear differences are observed between the suspect and authentic cartons in the ALS images. In the infrared image provided in Figure 1b, “alli” is clearly visible on the authentic carton whereas the “a,” first “l,” and “i” are all invisible on each of the suspect cartons. In Figure 1c, the authentic paper board is brighter and “alli” is clearly visible using a monochromatic wavelength of visible light. On the other hand, the suspect paperboard is darker, the “a” and “i” in “alli” are nearly invisible, and the second “l” is much brighter than that of the authentic. Regarding the bottles and capsules, the suspect products (right) appear visually consistent with those of the authentic (left) based on the white light image provided in Figure 1d. While the suspect capsules are much brighter than those of the authentic based on the infrared image provided in Figure 1e, few differences were observed between the suspect and authentic bottle labels. However, when examined using monochromatic visible light image in Figure 1f, both the suspect and authentic bottles and capsules can be easily differentiated; the suspect label is darker, the suspect label printing is brighter, and the suspect capsules exhibit stronger fluorescence. This latter example demonstrates the importance of using more than 1 illumination wavelength when using ALS to compare suspect and authentic products. In general, ALS examinations using the CDx take less than 1 minute per sample to make an acceptance/rejection decision (ie determining if the sample needs to be sent to the laboratory for further analysis) .
 Figure 1. Normal/white light (a, d), monochromatic infrared light with IR cutoff filter (b, e), and monochromatic visible light with visible color filter (c, f) images of authentic and counterfeit product cartons (a, b, c) and bottles/capsules (d, e, f) collected with the CDx device. The middle carton (outlined with a red box) in the top images is authentic and the surrounding cartons are counterfeit. The authentic bottles/capsules in the bottom images are on the left and the counterfeit bottles/capsules are on the right.
Once the suspect packaging is examined using the ALS features on the CDx, printing processes on the suspect product are determined using either a hand magnifier included in the CDx kit or the digital microscope coupled to the CDx. Microscopic examination of the authentic and counterfeit packaging can reveal differences in the printing process as indicated by the images provided in Figure 2. The authentic carton graphics were printed using offset lithography with a green spot color ink, which is characterized by an even distribution of the solid green ink color (Figure 2a). The counterfeit carton graphics were printed using 4-color halftone offset lithography, which is characterized by an even ink distribution of 5 halftone dots using the subtractive primary (process) colors cyan, magenta, and yellow (Figure 2b). Based on years of historical data generated by FCC, this printing process is often used by counterfeiters, likely due to its low cost and wide availability. The authentic bottle label graphics were printed using flexography with a green spot color ink, which is characterized by the darker outline, or halo, of ink around the periphery of the printed image (Figure 2c). The counterfeit bottle label graphics were printed using 4-color halftone offset lithography with cyan, magenta, and yellow ink (Figure 2d). In general, printing process examinations take less than 1 minute per sample to make an acceptance/ rejection decision.
 Figure 2. CDx images highlighting the offset printing on the authentic carton graphics (a), 4-color halftone offset printing on the suspect carton graphics (b), flexographic printing on the authentic bottle label graphics (c), and 4-color halftone offset printing on the suspect bottle label graphics (d). Scale bars equal 0.25 mm.
Raman/IR
CDx examinations of the finished dosage form are often confirmed using a portable Raman and/or infrared spectrometer. For example, the 3 suspect tablets shown in Figure 3 (top left, top right, bottom left) were not visually consistent with the authentic tablets (bottom right) using ALS. An infrared spectrum of 1 suspect tablet coating (Figure 3b) exhibited several spectral differences between it and the authentic tablet coating (Figure 3c). The Raman spectrum of the suspect tablet only exhibited fluorescence (Figure 3d), which is confirmed by the bright orange color observed in the ALS image. Although the Raman spectrum did not exhibit structural features, in this case, the fluorescence can be used to differentiate between counterfeit and authentic finished dosage forms. However, the discriminating power of this technique is significantly hindered for instances where the authentic and suspect products both exhibit strong fluorescence. In general, Raman and IR analyses take 1 to 3 minutes per sample to make an acceptance/rejection decision.
 Figure 3. First-generation CDx image of suspect tablets (top left, top right and bottom left) compared to authentic tablets (bottom right), (a), infrared spectrum of a suspect tablet coating using a handheld unit (b), infrared library spectrum of an authentic tablet coating (c), Raman spectrum of an intact suspect tablet using a handheld unit, (d) and Raman library spectrum of an intact authentic tablet using a handheld unit (e).
Although some suspect finished dosage forms can be easily differentiated from authentic products using all 3 portable devices, no single portable device can be used to analyze all possible sample types encountered outside the laboratory. For example, ALS analysis of another sample (Figure 4a) showed a very minor visual difference between the suspect tablets (top left, top right, and bottom left) and the authentic tablet (bottom right). Even though the infrared spectrum of the suspect tablet coating (Figure 4b) exhibited numerous IR absorbance band differences between it and the authentic tablet coating (Figure 4c), the signal-to-noise ratio (SNR) of the suspect coating is much lower, which is the result of poor sample-IRE contact due to the curvature of the tablet (better SNR was observed in the previous example since the tablet was flat). While it would be difficult to make an acceptance/ rejection decision using ALS or the handheld IR for this example, the Raman spectrum of the suspect tablet (Figure 4d) exhibited several differences compared to that of the authentic tablet (Figure 4e). The data provided in Figures 1 through 4 demonstrate the importance of using the multidisciplinary approach outlined in this manuscript for screening counterfeit pharmaceuticals in the field. The approach is effective because the strengths of the handheld ALS, Raman, and IR instruments compensate for each other’s limitations .
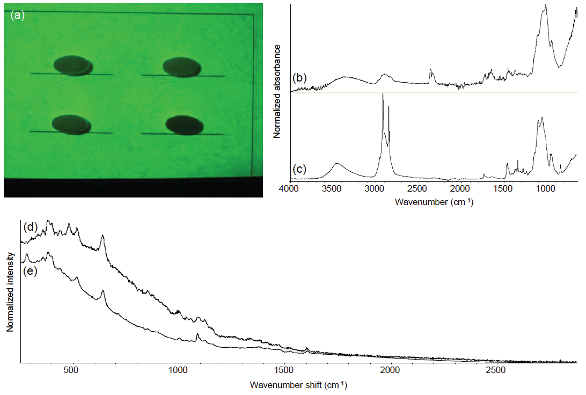 Figure 4. First-generation CDx image of suspect tablets (top left, top right, and bottom left) compared to an authentic tablet (bottom right) (a), infrared spectrum of a suspect tablet coating using a handheld unit (b), infrared library spectrum of an authentic tablet coating (c), Raman spectrum of an intact suspect tablet using a handheld unit (d), and Raman library spectrum of an intact authentic tablet using a handheld unit (e).
Screening in the Laboratory
Field screening of suspect pharmaceuticals is typically employed to make an acceptance/rejection decision based on visual similarities/differences between a suspect and authentic product. For samples that are not screened in the field, more exhaustive screening is typically required prior to more conventional analytical testing. FCC analysts typically screen samples in the laboratory using either the CDx or a similar benchtop ALS, which offers comparable capabilities as the CDx but with higher output illumination, sensitivity, and selectivity. In addition to determining if a suspect product is visually consistent with an authentic, laboratory screening is employed to establish if subunits (cartons, bottles, capsules, tablets, etc) within a suspect product are visually consistent. For example, the tablets shown in Figure 5a were received as a single item and appeared to be consistent with each other using white light (with the exception of a white foreign material on one tablet). However, 3 different-colored tablets were observed using ALS (Figure 5b). This example is not an isolated incident and the visual differences are typically more subtle as indicated another single-item submission shown in Figures 5c and d .
 Figure 5. Benchtop ALS normal/white light (a, c) and 455-nm visible light with a yellow filter (b, d) images of single submission of suspect Viagra 100-mg tablets (a, b) and a single submission of suspect Cialis 20-mg tablets (c, d).
Further examination using benchtop FT-IR spectroscopy indicated that each uniquely colored tablet had a different formulation, which demonstrates why it is necessary to separate suspect samples based on visual characteristics prior to confirmatory analyses. Specifically, an inaccurate assessment of the suspect product will result if tablets with different excipients are not separated into unique groups prior to making multi-tablet/capsule composites for more compendial testing. The benefit of using ALS allows for the separation of unique tablets within a group, and provides more information which can be used in origin analysis or sourcing of counterfeit products.
Conclusion
Fast, effective, and simple-to-use field-based and laboratory-based screening procedures have been described for detecting counterfeit pharmaceutical packaging and finished dosage forms. The procedures include using alternate light source technology in combination with portable Raman and infrared spectrometers. These methods have been employed for FCC casework on a routine basis over the last several years and have recently been validated based on comparisons to more established spectroscopic and chromatographic approaches. Specifics of this comparison will be the focus of a future publication.
Acknowledgement
The authors would like to thank Dr. Cheryl Flurer from the Forensic Chemistry Center.
References
- Kaine LA, Heitkemper DT, Jackson DS, Wolnik KA. Use of Ion Chromatography for the Verification of Drug Authenticity. J of Chromatogr A. 1994; 671: 303–308.
- Lanzarotta A, Lakes K, Marcott CA, Witkowski MR, Sommer AJ. Analysis of Counterfeit Pharmaceutical Tablet Cores Utilizing Macroscopic Infrared Spectroscopy and Infrared Spectroscopic Imaging. Anal Chem. 2011; 83: 5972–5978.
- Witkowski MR. The Use of Raman Spectroscopy in the Detection of Counterfeit and Adulterated Pharmaceutical Products. Am Pharm Rev. 2005; 56: 58–62.
- Adar F, Lee E, Whitley A, Witkowski M. Single-Point Analysis and Raman Mapping of Tablet Dosage Formulation as a Means for Detecting and Sourcing Counterfeit Pharmaceuticals. Raman Technology for Today’s Spectroscopists. 2007: 8–20.
- Ricci C, Eliasson C, Macleod NA. Newton PN, Matousek P, Kazarian SG. Characterization of Genuine and Fake Artensunate Anti-Malarial Tablets Using Fourier Transform Infrared Imaging and Spatially Offset Raman Spectroscopy Through Blister Packs. Anal Bioanal Chem. 2007; 389: 1525–1532.
- Ricci C, Nyadong L, Fernandez FM, Newton PN, Kazarian SG. Combined Fourier Transform- Infrared Imaging and Desorption Electrospray-Ionization Linear Ion-Trap Mass Spectrometry for Analysis of Counterfeit Antimalarial Tablets. Anal Bioanal Chem. 2007; 387: 551–559.
- Batson J, Witkowski M, Andria S, Fulcher M, Swortwood M. Real or Fake? The Screening of Pharmaceutical Drugs with Handheld Raman Spectroscopy to Determine Authenticity. Presented at the Federation of Analytical Chemistry and Spectroscopy Societies annual conference, 2009. Abstract number 503.
- Albright D, Andria SE, Batson J, Crowe JB, Fulcher M, Kremer S, Lanzarotta A, Platek SF, Ranieri N, Witkowski MR. Food and Drug Administration Forensic Chemistry Center, Trace Examination Section, unpublished results.
- Hajjou M, Qin Y, Bradby S, Bempong D, Lukulay P. Assessment of the Performance of a Handheld Raman Device for Potential use as a Screening tool in Evaluating Medicines Quality. J Pharm Biomed Anal. 2013; 74: 47–55.
- Ranieri N, et al. CDx Provisional and Pending Patents: 1) Provisional U.S. Patent No . 61/165,395; filed on March 31, 2009; 2) Provisional U.S. Patent No. 61/734,829; filed on December 7, 2012; 3) Patent Pending: U.S. Patent Application Serial No.: 621110,090; filing date: January 30, 2015; NIH.
- Ranieri N, et al. CDx Patent Cooperative Treaty (PCT), international patents: 1) US Provisional Patent Application No. 61/165,395; EP Patent Application No. 107284765.5 filed March 31, 2010; International Patent Application No. PCT/US2010/029502; 2) US Provisional Patent Application No. 61/734,829; EP Patent Application No. 201110915. filed December 7, 2012; International Patent Application No. PCT/US20131073526.
- US Food and Drug Administration, 2013. CD-3: A New Tool in FDA’s Fight Against Counterfeit Products. Available at: http://www.youtube.com/watch?v=mfYUkiKAJvA. Accessed September 16, 2014.
- Ranieri N, Tabernero P, Green MD, Verbois L, Herrington J, Sampson E, Satzger RD, Phonlavong C, Thao, K, Newton PN, Witkowski MR. Evaluation of a New Handheld Instrument for the Detection of Counterfeit Artensunate by Visual Fluorescence Comparison. Amer Tropical Medicine and Hygiene. 2014; 91: 920–924 .
- Green MD, Hostetler DM, Nettey H, Swamidoss I, Ranieri N, Newton PN. Integration of Novel Low-cost Colorimetric, Laser Photometric and Visual Fluorescent Techniques for Rapid Identification of Falsified Medicines in Resource-poor Areas: Application to Artemetherlumefantrine. Accepted for publication in Amer Tropical Medicine and Hygiene. Feb 2015.
- US Food and Drug Administration article (page last updated: 06/17/2014) titled "Memorandum of understanding between US agency for international development and US Department of Health and Human Services Food and Drug Administration to collaborate on testing the counterfeit detection device." http://www.fda.gov/InternationalPrograms/Agreements/MemorandaofUnderstanding/ucm401201.html
Author Biographies
Adam Lanzarotta, PhD, is currently a chemist in the Trace Examination Section at the US FDA’s Forensic Chemistry Center (FCC). His expertise includes the analysis of tampered, adulterated, and counterfeit FDA-regulated products using vibrational spectroscopy with a focus on infrared spectroscopic imaging. He earned his PhD in Analytical Chemistry from Miami University and a BS in Forensic Science from Eastern Kentucky University.
Nicola Ranieri is currently a research biologist in the Trace Examination Section at the US FDA’s FCC. He received his BS in Biology from the University of Cincinnati. His 25 year career experience with the agency has warranted him numerous awards in trace analysis of counterfeited, diverted, and tampered products.
Douglas C. Albright is currently a chemist in the Trace Examination Section at the US FDA’s FCC. Prior to the FCC, Douglas worked as the Supervisory Counterfeit Specialist in charge of the forensic analysis of counterfeit U.S. currency at the U.S. Secret Service Criminal Investigative Division Counterfeit Laboratory. He earned his B.S. in Forensic Chemistry from Ohio University.
Mark R. Witkowski, PhD, is currently a chemist in the Trace Examination Section at the US FDA’s FCC. He earned his PhD in Analytical Chemistry from Kansas State University and a BS in Chemistry from the University of Pittsburgh.
JaCinta S. Batson is currently a Supervisory Chemist with the US FDA’s FCC and is responsible for the planning, directing, and coordinating the work of scientists engaged in carrying out the functions in the Trace Examination Section. She earned her MBA in Finance from Xavier University, MS in Physical Chemistry and BS in Chemistry from Wright State University.
Moseley Fulcher is currently a biologist in the Trace Examination Section at the US FDA’s FCC. He received his A.S. in Communication Electronics from Georgia Military College and has over 26 years of military experience. He also has attended the University of Cincinnati, Cincinnati State Technical College and Coastal Carolina Community College.