Introduction
Chemical and post-translational modifications, including asparagine (Asn) deamidation, aspartate (Asp) isomerization, methionine (Met) oxidation, and crystallizable fragment (Fc) glycosylation, that occur in the marketed IgG1 antibody trastuzumab have been extensively reviewed.1-7 Recombinant monoclonal antibodies (mAbs) are exposed to process and storage conditions that might influence the rate and extent of these modifications.8 In case of trastuzumab, a loss of potency is caused by the isomerization of heavy chain Asp-102 (CDR 3). Deamidation of the light chain Asn-30 (CDR 1) only moderately affects trastuzumab potency, whereas heavy chain Asn-55 (CDR 2) was found to be less prone to deamidation.1,3 Oxidation of Met residues in the constant domains of recombinant IgG1 antibodies has been demonstrated to affect the interaction with protein A, the neonatal Fc receptor, and binding to the Fcγ receptors.9-12 Glycosylation of therapeutic proteins is crucial for their biological activity.13,14 Glycosylation profiles vary depending on, for example, production cell type used, fermentation process, or even production scale.15,16 Variability in glycan patterns based on manufacturing variability has also been described for marketed antibody products.17,18
In the present study, an approach employing robotics for high-throughput sample preparation (purification and proteolytic cleavage) combined with fast quantitative LC-MS analysis for the accurate, robust and highly automated quantification of Asn deamidation, Asp isomerization, Met oxidation, and Fc glycosylation was developed. This test system allowed us to monitor all relevant chemical and post-translational modifications in the variable and constant region of trastuzumab.
Experimental Procedures
The recombinant IgG1 antibody trastuzumab was expressed in a chinese hamster ovary cell system and manufactured at Roche Diagnostics, Penzberg, Germany using standard cell culture and purification technology. Trastuzumab was formulated at a concentration of 25 mg/mL in a His-HCl buffer system (5 mM) at pH 6.0.
Sample Preparation for Tryptic Peptide Mapping
High-throughput peptide mapping was designed in a 96 well format using the Agilent Bravo Automated Liquid Handling Platform (Agilent Technologies, Waldbronn, Germany). With this protocol 8 to 96 samples can be handled simultaneously in a single run. For the detection and quantification of chemical and post-translational modifications at the peptide level, 120 μg Trastuzumab was diluted with 20 mM His-HCL, 10 mM methionine, pH 6 to a final volume of 20 μL. For denaturation and reduction, 100 μL of 0.2 M His-HCl, 8 M Gua-HCl, 25 mM dithiothreitol (DTT), pH 6.0 was added followed by incubation at 50 °C for 1 h. In case Protein A purification was performed, 50 μL of eluate was mixed with 70 μL 0.2 M His-HCl, 8 M Gua-HCl, 25 mM dithiothreitol (DTT), pH 6.0. Next, the buffer was exchanged to a digestion buffer (0.02 M His-HCl, pH 6.0 with 10 mM methionine used as antioxidant) using 1 mL PhyTip gel filtration columns filled with 600 μL 10 K resin (PhyNexus, San Jose, CA, USA). In advance, the columns were equilibrated with 1.4 mL digestion buffer. 100 μL of denatured and reduced sample was transferred to the columns. Subsequently, 200 μL eluate was mixed with 5 μL of a 0.25 mg/mL trypsin solution (10 mM HCl, Trypsin Proteomics grade, Roche Diagnostics, Penzberg, Germany) and incubated at 37 °C for 18 h.
Liquid Chromatography-Mass-Spectrometry and Data Analysis
Tryptic peptides resulting from ~3 μg digested protein were injected and separated on an ACQUITY UPLC system (Waters Corp., Manchester, UK) using BEH C18 RP-columns (1.7 μm 2.1 × 150 mm, Waters Corp.) at 65 °C and analyzed online with a Waters Synapt G2 mass spectrometer (Waters Corp.). The mobile phases consisted of 0.1% formic acid in water (solvent A) and 0.1% formic acid in acetonitrile (solvent B). The chromatography was carried out using a linear gradient from 1 to 30% solvent B in 15 min and from 30 to 80% solvent B in additional 3 min at a flow rate of 300 μL/min. Data acquisition was controlled by MassLynx™ software (Waters Corp.). Instrument parameters for mass spectrometric detection were adjusted according to general experience available from peptide analysis of recombinant antibodies.
The multi-step automatic data analysis of MassLynx™ raw data was performed by MassMap® (MassMap GmbH & Co. KG, Wolfratshausen, Germany) and GRAMS AI software (Thermo Fisher Scientific, Dreieich, Germany). The MassMap® software was applied for the generation of specific ion current (SIC) chromatograms of relevant peptides on the basis of their monoisotopic masses, isotope distributions and detected charge states. For the semi-quantification of chemical and post-translational modifications at peptide level, SIC chromatograms were automatically integrated using an in-house array basic program integrated in GRAMS AI. More detailed, all SIC chromatograms of the first data set (typically the reference sample) were integrated manually determining the integration limits for each peptide peak. The software facilitated then a batch modus integration for the SIC chromatograms of the entire sample set. Relative amounts of modification levels were calculated using the resulting peak areas of the modified and unmodified (wild-type) peptides.
Results and Discussion
At the Roche Pharma site for Technical Development in Penzberg (Germany) electrospray ionization mass spectrometry (ESI-MS) is routinely applied for the detailed characterization of therapeutic proteins. Often in combination with liquid chromatography, mass spectrometry (LC-ESI-MS) is utilized to verify the primary structure of proteins and to assess chemical and post-translational modifications such as glycosylation, oxidation, deamidation, isomerization, and glycation.1,4,19-22 Moreover, sensitive LC-ESI-MS is used to identify low-abundant product related variants (e.g. sequence variants) or process related impurities (e.g. host cell proteins).23-26 For the extended characterization of clinical development and marketed products, mass spectrometry is regularly applied to support batch comparability, protein isoform characterization, formulation and bio-process development studies, and for a range of analytical troubleshooting activities.
The developed test system for the fast, robust, and automated quantification of Asn deamidation, Asp isomerization, Met oxidation, and Fc glycosylation in recombinant antibodies employs automated proteolytic peptide mapping under mildly acid conditions combined with fast ultra-performance liquid chromatography tandem mass-spectrometry (UPLC-MS/MS). Since the relevant chemical and post-translational modifications sites of trastuzumab have been extensively studied, Herceptin® was employed as the model compound for the test system development. The experimental workflow adopted is summarized in Figure 1. The method presented involves automated protein denaturation and reduction without alkylation followed by proteolytic digestion in a histidine/HCl buffer system at pH 6.0.1
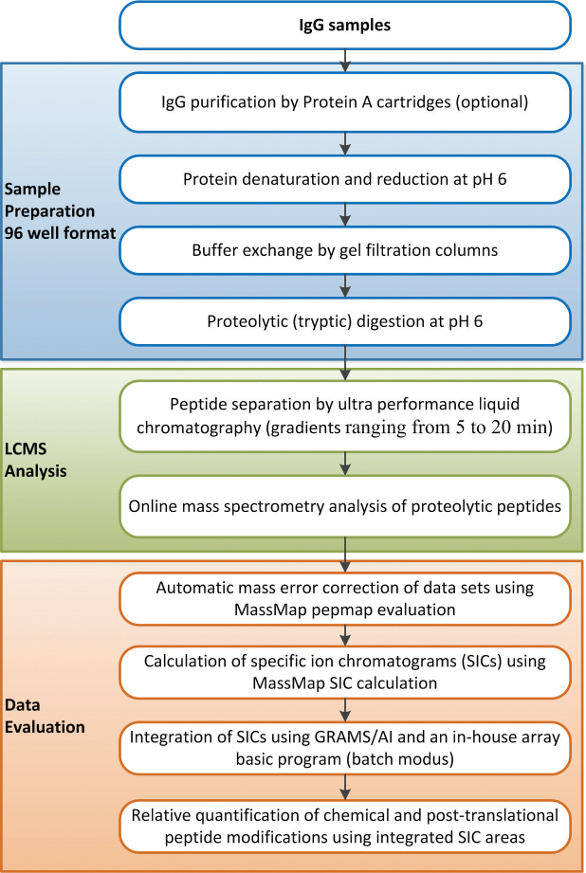 Figure 1. Experimental workflow for the (semi-automated) high-throughput analysis of chemical and post-translational modifications of trastuzumab.
To demonstrate that the semi-automated test system generates realistic values for chemical and post-translational modifications, reference material (stored at – 80°C) of trastuzumab was manually analyzed as recently published1,19 and according to the automated sample preparation procedure depicted in Figure 1. The extent of relevant Asn deamidation, Asp isomerization, Met oxidation, and Fc glycosylation (≥1% relative abundance) was determined by quantitative evaluation of specific ion current chromatograms (Table 1). Similar quantifications were obtained for all light and heavy chain chemical and post-translational modifications using the manual and the automated sample preparation procedures. Moreover, these results are in agreement with previous studies on trastuzumab.1,3,7
Table 1. Results from the analysis of relevant (≥ 1%) chemical and post-translational modifications in the light (LC) and heavy (HC) chain of trastuzumab reference material by LC-MS peptide mapping (n=8, mean ± S.D.). Relative quantification (in %) was conducted by specific ion current chromatogram analysis of tryptic peptides. deamid, total Asp/iso-Asp.

To illustrate the application of the semi-automated test system for the assessment of trastuzumab Asn deamidation and Asp isomerization sites, we exposed trastuzumab reference material to elevated pH and temperature conditions (pH 9.0 at 37°C). Subsequently, the stressed material was stepwise diluted with non-stressed reference material to determine the linearity of the quantitative analysis. Figure 2 summarizes the respective quantification results for the CDR-located trastuzumab amino acid residues that showed significant alterations in Asn deamidation or Asp isomerization. For LC-Asn-30 (located in the CDR 1) we found significantly increased levels of Asp and iso-Asp (from 8% up to 77% total deamidation). The HC-Asp-102 (located in the CDR 3) also displayed a demonstrative elevation in iso-Asp formation upon application of stress conditions (from 8% up to 20%). In contrast, the deamidation level of HC-Asn-55 (located in the CDR 2) was only moderately affected by the elevated pH and temperature conditions (1% to 12%).
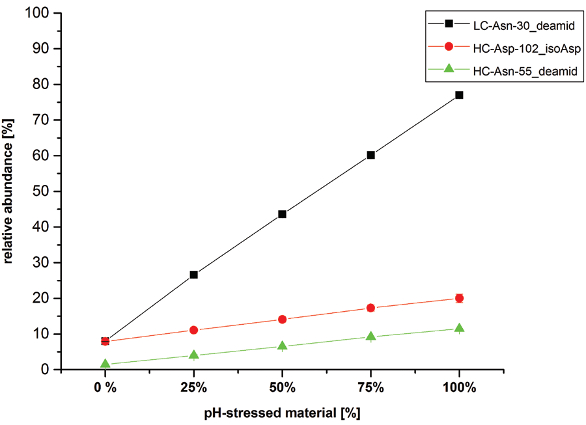 Figure 2. Linearity assessment of trastuzumab relevant Asn deamidation and Asp isomerization using elevated pH and temperature conditions (pH 9.0, 37°C).
These results are consistent with recent studies reporting detailed characterization of trastuzumab charge variant formation, in which LCiso- Asp-30 was also found as the predominant degradation product.1,3 As can be seen in Figure 2, excellent linearity was achieved over the dilution series for all 3 modifications shown. Furthermore, linearity correlation coefficients of (r) >0.99 were observed for the semiquantitative analysis of all the relevant trastuzumab variants listed in Table 1 (data not shown).
With respect to the quantitative analysis of mass spectrometric peptide data, it should however be noted that ionization efficiencies of peptides can differ significantly depending on their amino acid content and also the subsequent chemical modifications. Increasing hydrophobicity generally leads to enhanced ionic species formation. Variation of the pI value of peptides also alters the ionization efficiency. Consequently, different ionization efficiencies should be taken into account when discussing and interpreting the data obtained from the presented experiments. However, despite this acknowledged potential limitation of the semi-quantitation by LC-MS, our results for the detected levels of deamidated or isomerized tryptic peptide species are highly comparable with the data achieved by cation exchange chromatography coupled with UV detection (CEC) (see Figure 3). The lower determined levels with LC-MS demonstrate the correlation to the orthogonal CEC data due to that fact that the CEC measures the mAb on the intact level and the LC-MS at the reduced level (2-fold lower due separate quantitation of the two light chains). This data is also in agreement with previous studies on chemical modification testing of trastuzumab.1,3,19 In addition, the obtained quantitative data for Fc glycosylation (Table 1) were highly comparable with results from HILIC-UPLC analysis of 2-AB labeled Fc glycans (data not shown).
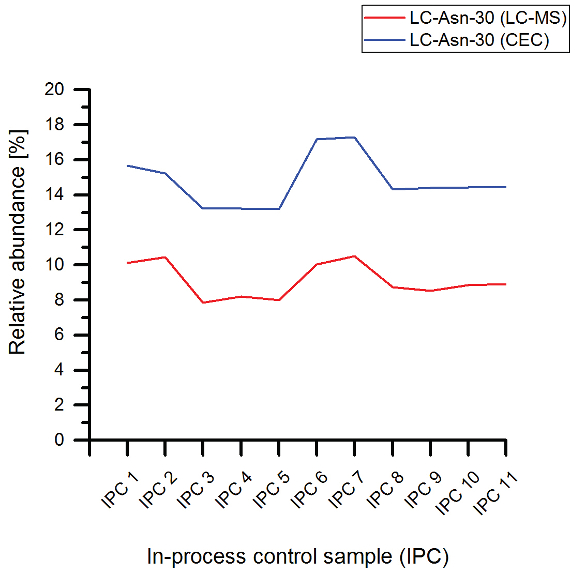 Figure 3. Analysis of light chain asparagine 30 (LC-Asn-30) in trastuzumab in-process control samples by cation-exchange chromatography (CEC) and liquid chromatography-massspectrometry (LC-MS) peptide mapping.
The semi-automated LC-MS peptide mapping test system described here was subsequently qualified following the International Conference on Harmonization (ICH) guideline on Validation of Analytical Procedures (Q2A and Q2B). Accuracy of mass determination and relative quantification of the trastuzumab variants, precision (repeatability, intermediate precision), robustness, and the linearity of quantification were assessed by analyzing trastuzumab batches with different chemical and post-translational amino acid modification contents.
Conclusion
Mass spectrometry based methods with quantitative data evaluation are typically applied in Quality by Design studies on chemical and post-translational amino acid modifications, host cell protein profiling, and sequence variant analysis. Consequently, this raises the question of whether multi-attribute testing at peptide level should be added to the conventional electrophoretic and chromatographic methods currently used for bio-process and formulation development, inprocess control testing, or product release analytics of recombinant antibodies and other biopharmaceuticals.
Due to the high sensitivity and resolution of modern mass spectrometric systems, the application of LC-MS peptide mapping for multi-attribute testing enables the site specific assessment of product variants which is essential to investigate structure-function relationships. On the other hand, multi-attribute testing using semiquantitative LC-MS peptide mapping needs to be carefully evaluated and established especially with respect to long-term robustness and method transferability to different mass spectrometric systems.
In summary, the application of automated sample preparation combined with fast quantitative UPLC-MS analysis was adequate to monitor all relevant chemical and post-translational modifications of trastuzumab. Accordingly, the methodology presented can be applied to the evaluation of bio-process, formulation, and storage conditions on antibody critical quality attributes by monitoring susceptible marker peptides of bio-therapeutic proteins.
Acknowledgements
We are indebted to all members of the laboratories in Roche Diagnostics GmbH Penzberg for valuable discussions and Prof. Dr. Oliver Eickelberg for manuscript proofreading.
References
- Diepold K, Bomans K, Wiedmann M, et al. Simultaneous assessment of Asp isomerization and Asn deamidation in recombinant antibodies by LC-MS following incubation at elevated temperatures. PLoS One 2012;7:e30295.
- Harris RJ. Heterogeneity of recombinant antibodies: linking structure to function. Dev Biol (Basel) 2005;122:117-27.
- Harris RJ, Kabakoff B, Macchi FD, et al. Identification of multiple sources of charge heterogeneity in a recombinant antibody. J Chromatogr B Biomed Sci Appl 2001;752:233-45.
- Reusch D, Haberger M, Falck D, et al. Comparison of methods for the analysis of therapeutic immunoglobulin G Fc-glycosylation profiles-Part 2: Mass spectrometric methods. MAbs 2015;7:732-42.
- Reusch D, Haberger M, Maier B, et al. Comparison of methods for the analysis of therapeutic immunoglobulin G Fc-glycosylation profiles--part 1: separation-based methods. MAbs 2015;7:167-79.
- Shen JF, Kwong, M.Y., Keck, R.G., Harris, R.J. The application of tertbutylhydroperoxide oxidation to study sites of potential methionine oxidation in a recombinant antibody. In: DR Marshak (Ed), Techniques in Protein Chemistry VII Academic Press Inc 1996:275-84.
- Haberger M, Bonnington L, Bomans K, et al. Application of Electrospray Ionization Mass Spectrometry in a Quality Control Laboratory. American Pharmaceutical Review 2016;19:78-81.
- Wang W, Singh S, Zeng DL, King K, Nema S. Antibody structure, instability, and formulation. J Pharm Sci 2007;96:1-26.
- Bertolotti-Ciarlet A, Wang W, Lownes R, et al. Impact of methionine oxidation on the binding of human IgG1 to Fc Rn and Fc gamma receptors. Mol Immunol 2009;46:1878-82.
- Haberger M, Heidenreich AK, Schlothauer T, et al. Functional assessment of antibody oxidation by native mass spectrometry. MAbs 2015;7:891-900.
- Loew C, Knoblich C, Fichtl J, et al. Analytical protein a chromatography as a quantitative tool for the screening of methionine oxidation in monoclonal antibodies. J Pharm Sci 2012;101:4248-57.
- Schlothauer T, Rueger P, Stracke JO, et al. Analytical FcRn affinity chromatography for functional characterization of monoclonal antibodies. MAbs 2013;5:576-86.
- Jefferis R. Recombinant antibody therapeutics: the impact of glycosylation on mechanisms of action. Trends Pharmacol Sci 2009;30:356-62.
- Jenkins N, Murphy L, Tyther R. Post-translational modifications of recombinant proteins: significance for biopharmaceuticals. Mol Biotechnol 2008;39:113-8.
- Ahn WS, Jeon JJ, Jeong YR, Lee SJ, Yoon SK. Effect of culture temperature on erythropoietin production and glycosylation in a perfusion culture of recombinant CHO cells. Biotechnol Bioeng 2008;101:1234-44.
- Pacis E, Yu M, Autsen J, Bayer R, Li F. Effects of cell culture conditions on antibody N-linked glycosylation--what affects high mannose 5 glycoform. Biotechnol Bioeng 2011;108:2348-58.
- Raju TS, Jordan RE. Galactosylation variations in marketed therapeutic antibodies. MAbs 2012;4:385-91.
- Schiestl M, Stangler T, Torella C, Cepeljnik T, Toll H, Grau R. Acceptable changes in quality attributes of glycosylated biopharmaceuticals. Nat Biotechnol 2011;29:310-2.
- Haberger M, Bomans K, Diepold K, et al. Assessment of chemical modifications of sites in the CDRs of recombinant antibodies: Susceptibility vs. functionality of critical quality attributes. MAbs 2014;6:327-39.
- Sydow JF, Lipsmeier F, Larraillet V, et al. Structure-based prediction of asparagine and aspartate degradation sites in antibody variable regions. PLoS One 2014;9:e100736.
- Hensel M, Steurer R, Fichtl J, et al. Identification of potential sites for tryptophan oxidation in recombinant antibodies using tert-butylhydroperoxide and quantitative LC-MS. PLoS One 2011;6:e17708.
- Andersen N, Vampola L, Jain R, Alvarez M, Chamberlain S, Hilderbrand A. Rapid UHPLC-HRMS peptide mapping for monoclonal antibodies. American Pharmaceutical Review 2014;17.
- Bomans K, Lang A, Roedl V, et al. Identification and monitoring of host cell proteins by mass spectrometry combined with high performance immunochemistry testing. PLoS One 2013;8:e81639.
- Doneanu CE, Xenopoulos A, Fadgen K, et al. Analysis of host-cell proteins in biotherapeutic proteins by comprehensive online two-dimensional liquid chromatography/mass spectrometry. MAbs 2012;4:24-44.
- Zeck A, Regula JT, Larraillet V, et al. Low level sequence variant analysis of recombinant proteins: an optimized approach. PLoS One 2012;7:e40328.
- Rogers RS, Nightlinger NS, Livingston B, Campbell P, Bailey R, Balland A. Development of a quantitative mass spectrometry multi-attribute method for characterization, quality control testing and disposition of biologics. MAbs 2015;7:881-90.