Department of Analytical Sciences
Department of Analytical Sciences
Department of Statistical Sciences
Department of Analytical Sciences
Introduction
Antibody drug conjugates (ADCs) are a class of biotherapeutics in which a cytotoxic drug, typically a small molecule, is conjugated to an intact monoclonal antibody (mAb), fragment antigen-binding fragment (Fab) or a bispecific monoclonal antibody (BsMAb). In general the antibody portion of ADCs binds to a specific target ligand, and is subsequently internalized. Upon internalization, the toxic payload is either cleaved or non-cleaved, and ultimately results in cell death (Figure 1). Two main pathways for cell death are either by disruption of microtubule polymerization or disruption of DNA replication due to cross-linking of cytotoxic drug payload to DNA. Although currently there is no specific regulatory guidance to industry on ADC development, it is recommended that a target binding assay should be incorporated into the lot release and stability testing program for mAb intermediate (unconjugated mAb) along with both target binding assay and cytotoxicity assay for lot release and stability testing of ADC (DS/DP). In order to demonstrate that the conjugation chemistry does not impact target binding, the same binding assay should be used for the mAb as is used for the ADC (DS/DP).
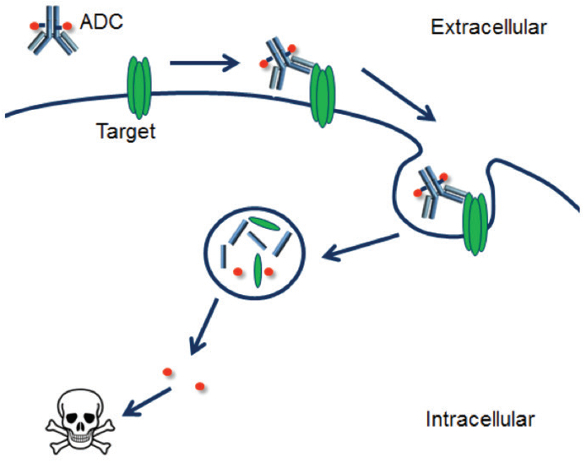 Figure 1. General mechanism of actions for ADCs.
Indirect ELISA or competitive ELISA formats are commonly used for binding assays. In the case of an indirect ELISA, either purified antigen or cells expressing antigen are coated on micro-well plates.
Subsequent to the coating step, an mAb intermediate or ADC is added over a range of concentrations. A labeled secondary antibody specific for the Fc domain of antibody is then added to detect binding of mAb or ADC to the antigen (Figure 2). The EC50 value represents the concentration of mAb intermediate or ADC at which half-maximal binding to the antigen is observed and can be determined using a four-parameter logistic (4PL) curve fit. In the competitive ELISA format, either purified antigen or cells expressing antigen are coated on microwell plates. After coating, mAb or ADC at a range of concentrations are mixed with a fixed concentration of a labeled version of mAb or ADC. The unlabeled molecule competes with the labeled molecule for binding to the antigen (Figure 3). The IC50 value represents the concentration of unlabeled molecule at which half-maximal inhibition of labeled molecule is being observed and can be determined using a 4PL curve fit. A number of different endpoint measurements can be used for the cytotoxicity assay. One commonly used approach is a luminescence-based cell viability assay. This assay is based on the quantitation of ATP, which is an indicator of metabolically active cells. As cell death occurs, ATP levels decrease in a concentrationdependent manner and an IC50 value represents the concentration of ADC, at which half-maximal ATP level occurs. Another approach that can be taken is to use a luminescence-based caspase 3/7 assay, which measures caspase-3 and -7 activities. Activation of caspase-3 and caspase-7 is an indicator of apoptotic cell death. An EC50 value represents the concentration of ADC at which half-maximal caspase activity occurs.
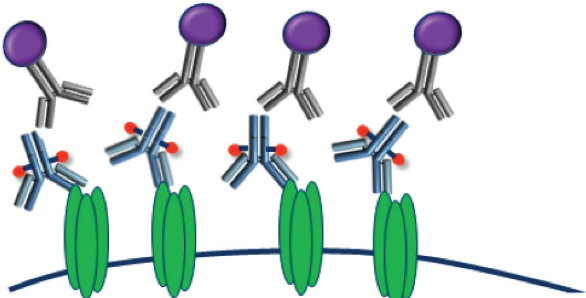 Figure 2. Indirect ELISA.
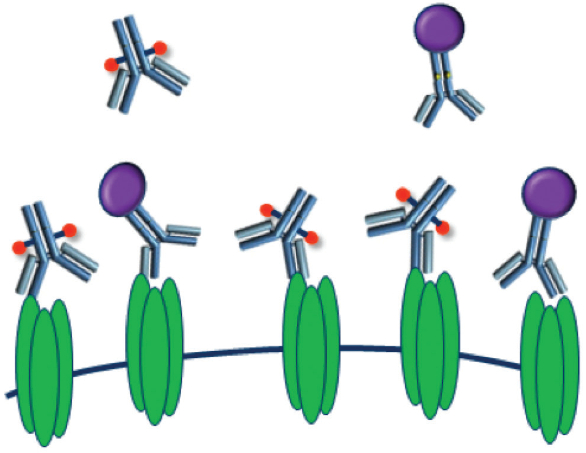 Figure 3. Competitive ELISA.
Quality by Design (QbD) for ADC Potency Assays
Quality by Design (QbD), has been established as a guideline for pharmaceutical product development and can also be used for the development of the target binding assays and the cytotoxicity assays. A QbD approach builds quality into the product. In this case, the product is the target binding assay or cytotoxicity assay. Using the QbD approach, assay development starts with the creation of an analytical target profile that defines method objectives, including critical method attributes (e.g. range, accuracy and precision) and key method attributes (e.g. data turnaround and assay transferability). Other considerations may involve, for example, the supply of critical reagents, such as cell lines and purified antigens from development to commercial and also through the entire product lifecycle. For lot release and stability testing assays, precision and robustness metrics yield important information required to meet release specifications, assay life cycles and potential worldwide method deployment in QC laboratories.
Once the analytical target profile has been established for a target binding assay or cytotoxicity assay, a proof-of-concept study is performed to establish preliminary method conditions. During this study, it is important to use a wide range of concentrations of mAb intermediate or ADC to allow for identification of the upper and lower asymptotes of the assay and an estimation of the concentration that results in half-maximal response. After establishing preliminary method conditions, important method factors are identified that can either be optimized or controlled to ensure that the targets in the analytical target profile are achieved. An Ishikawa (fishbone) diagram may be used to facilitate the factor identification process. The diagram helps to categorize experimental factors into different groups, such as equipment, analyst, environment, measurement, method and materials. Once factors have been identified, a cause-and-effects matrix can be used to rank them based on their potential impact on critical method attributes.
Typical factors that have the biggest impact on assay responses include cell density (cell-binding ELISA and cytotoxicity assay), antigen concentration (ligand binding ELISA) and assay incubation time. These factors can be explored by design-of-experiment (DOE) studies in order to determine the impact on the assay’s concentration-response relationship. For example, by modeling data with a 4PL curve, one may examine the upper asymptote, lower asymptote, ratio of upper/lower asymptote (S/N), curve shape and inflection point. It is also common to measure the accuracy at the lower end and upper end of the assay through concentration or dilution (e.g. 60% and 167%).
Screening DOE
A screening design DOE study can be used in order to observe multiple factors with wide high to low ranges in a reduced number of assays. The results of the screening DOE can be used to eliminate non-significant factors as well as reduce the high to low ranges. A screening DOE for 3 factors, which results in eight experimental runs, is constructed using high and low settings of the three factors. If more than three factors are to be evaluated by DOE, then one might consider using a fractional factorial screening design to reduce the number of runs, as shown in Figure 4.
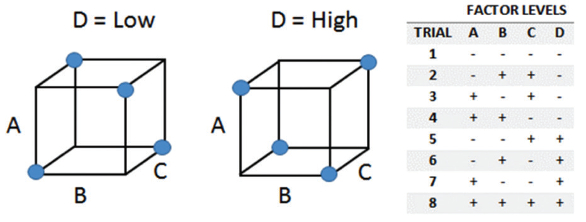 Figure 4. Screening design for four factors.
Response Surface Method (RSM) DOE
 Figure 5. Central composite (Response Surface) design for three factors.
In situations where there is prior knowledge about the important factors from other assays, one can forego the screening DOE and move directly into a response surface method (RSM) DOE. Generally in bioassays, the relationship between a factor (e.g. antigen concentration) and a response (accuracy at 60% potency level) is not linear, so a RSM design should be used to capture the curvature of the interaction in order to determine how changing the factors will impact the responses. There are two commonly-used response surface designs, the Box-Wilson Central Composite Design (central composite design) and the Box-Behnken design. For the purpose of this article, attention will be given to the central composite design, which is the most popular response surface design. The central composite design combines two-level fractional factorial points with a set of center points and a set of axial points (Figure 5). In the case where three high-impact factors are evaluated, the central composite design results in sixteen experimental runs. Since sixteen experimental runs all performed at one time might be difficult to manage, one might consider constructing a central composite design in blocks to reduce the number of experimental runs to be performed at one time. Once the experimental runs have been performed, statistical analysis software can be used to find the combination of factor settings that gives the highest desirability score. Maximizing the desirability score (a value between 0 and 1) allows for determination of the optimal assay conditions. In desirability profiling, a desirability function is specified for each response, where a desirability of 0 is unacceptable and a desirability of 1 is ideal. For example, because it is desirable to achieve 100% accuracy, the desirability function d for accuracy a may be given as d(a) = 1 – | a – 100 | / 15, whenever 85 < a < 115, and d(a)=0 otherwise. For those with access to more advanced statistical tools, the desirability function could also be expressed in terms of Bayesian probability; e.g., d(a) = Probability( 85 < a < 115 ). A RSM DOE study for a target binding assay is shown in Table 1. The factors that were evaluated during this study were (1) the concentration of purified antigen coated on a micro-well plate, (2) the assay incubation time and (3) the concentration of a labeled secondary antibody specific for the Fc domain of mAb. Each factor was evaluated at a high (H), medium (M) and low (L) level, and mAb was used as sample in the robustness DOE study. Once optimal assay conditions were determined using the mAb, three confirmatory runs were performed using the ADC. As mentioned previously, a robustness DOE using a central composite design can result in a significant number of runs to perform at one time. Table 2 shows an example of a RSM DOE study for a target binding assay in which a central composite design was constructed using two blocks. In this example, there were three factors evaluated: (1) the incubation time for coating of the purified antigen, (2) the assay incubation time and (3) the concentration of labeled secondary antibody, and each factor was evaluated at H, M and L level. Two blocks were used to allow for eight runs instead of sixteen runs to be performed at one time. Similar RSM DOE studies for caspase 3/7 luminescent assays (measure of cytotoxicity), are shown in Tables 3 and 4. A two-block robustness DOE study, in which cell density, assay incubation time and substrate incubation time, is shown in Table 3. For the RSM DOE study shown in Table 4, the only factors that were evaluated were assay incubation time and the substrate incubation time. By reducing the number of factors from three to two, only twelve runs were required using the central composite design with three center points. Table 5 shows the improvement in the accuracy of the assay over a range of samples from 60% to 167%. Prior to maximizing desirability, the accuracy over the range varied between 102% and 135% (Figure 6). By maximizing desirability, the variability in accuracy was limited between 96% and 108% (Figure 7). This improvement in accuracy is a result of the optimized assay conditions, consisting of higher cell density (threefold increase) and longer substrate incubation time (three-fold increase). Only a minor change (~25% decrease) was observed for assay incubation time upon maximizing desirability. The accuracy of 96% to 108% across the range of 60% to 167% was within the target range of 87% to 115% described in the analytical target profile. Two analysts performed three independent runs to confirm that the accuracy, repeatability and intermediate precision of the assay met the targets described in the analytical profile (Table 6). Once it was confirmed that these targets were met, the assay was declared as fitfor- purpose and was implemented as a lot release and stability test for Phase 1 clinical trial material.
Table 1. RSM DOE for target binding assay.

Table 2. Two-Block DOE for target binding assay.

Table 3. Two-Block DOE for Cytotoxicity Assay (Three Factors).
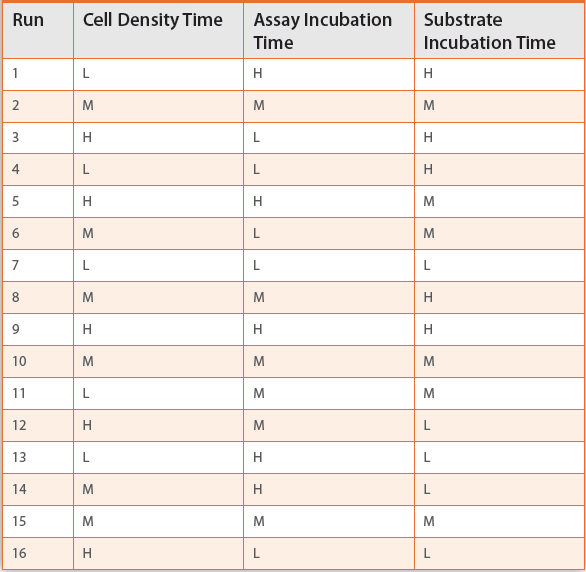
Table 4. RSM DOE for cytotoxicity assay (two factors).
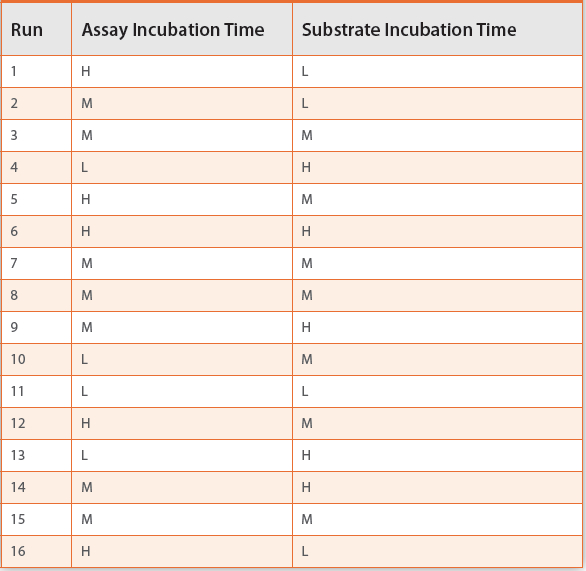
Table 5. Optimization of Maximum Desirability.
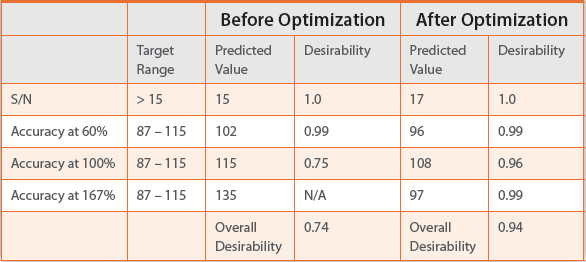
 Figure 6. Response Surface Profile – prior to maximizing desirability.
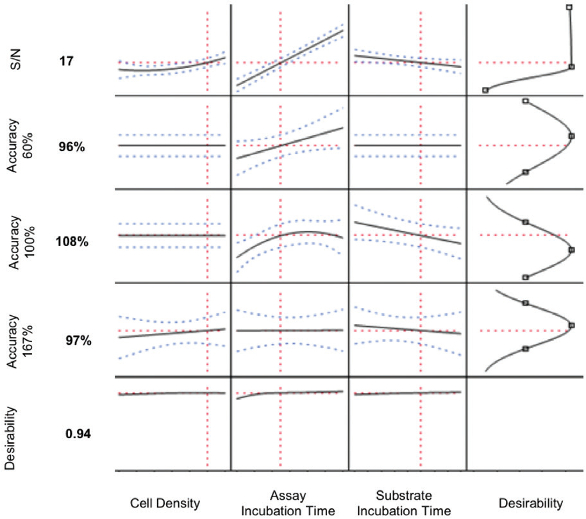 Figure 7. Response Surface Profile – after maximizing desirability.
Table 6. Qualification of method performance.

Continuous Performance Verification
Once an assay has been shown to be fit-for-purpose, routine monitoring of the assay is performed as part of a continuous performance verification program. Typically, the same responses that are measured as part of DOE studies (e.g. upper asymptote, lower asymptote, S/N, inflection point) are included in routine monitoring. Statistical control charts can be established to monitor the assay performance over time and differentiate between common cause variability (steady, random distribution) and special cause variability (non-random distribution).
Conclusion
When establishing cytotoxicity assays for ADCs and target binding assays for mAb intermediates and ADCs, a QbD approach that consists of DOE studies allows for a thorough understanding of the method design space. This knowledge can be beneficial when transferring the assays to other laboratories (e.g. internal QC testing group, external contract testing organizations). The knowledge gained from a QbD approach can also be applied to assay development for future ADC molecules, which is beneficial for accelerated project timelines. Finally, QbD allows for the establishment of high quality assays for lot release and stability that ensure the quality of ADCs as related to safety and efficacy.
Acknowledgements
We thank Kripa Ram (MedImmune) for helpful comments on the manuscript.