Introduction
Analysis of the solid state plays a key role in modern drug development during pharmaceutical process development and in support of regulatory filing activities [1-3]. The analytical techniques used in this field span the interface between physical chemistry, materials science, surface science, and supramolecular chemistry, and provide critical knowledge and understanding of complex phenomena such as polymorphism, disorder in the crystalline state, molecular-level interactions in crystalline and amorphous materials, and the formation of defects, inclusions, solid solutions, and related phenomena in materials. The analytical techniques used for these tasks include a variety of physical, thermal, spectroscopic, and diffractometric methods operating upon both bulk and spatiallyselective sample presentations [3,4]. The focus of this article is upon the use of spectroscopic or diffratometric methods, which provide some of the most effective and information-rich tools for solid-state analysis. Recent advances in the fields of solidstate spectroscopy and diffraction as applied to pharmaceutical materials, including active pharmaceutical ingredients (APIs) and formulations, have enabled more challenging solid-state analytical questions to be addressed. In particular, advances in vibrational spectroscopy, solid-state NMR (SSNMR), and X-ray diffraction (XRD) are presented and discussed. These advanced methods are often used in a multidisciplinary fashion for the most complex challenges, so that the data from each technique can be cointerpreted to form a more complete picture of the solid state [5].
The more advanced spectroscopic and diffractometric techniques of special interest here are relative newcomers to the field of pharmaceutical analysis, but fit within a well-established range of solid-state analysis methods, including thermal methods such as differential scanning calorimetry (DSC) and modulated DSC (mDSC), infrared (IR) and Raman spectroscopy and microscopy, optical and electron microscopy, and physical methods such as vapor sorption, particle size analysis, and surface area analysis [3,4]. Together these techniques are the primary tools for solid state analysis of oral and other solid-dose formulations. Because many analytical questions in solid-state analysis require the use of more than one technique, at least initially, the manner in which these techniques are used is critically important towards effective analysis. This can be illustrated by summarizing some of the more challenging questions regularly encountered in the field of solid-state analysis, as shown in Table 1, along with general approaches taken to address each question. With advances in solid-state analysis, the approaches suggested for each analytical question have been modified to incorporate many of the more advanced approaches discussed in this article and which involve vibrational microscopy and mapping, 2D SSNMR, and newer modes of XRD analysis.
Table 1

The approach to the assessment of phase purity shown in Table 1 exemplifies the use of both established and advanced techniques. Phase purity refers to the presence of a single dominant crystalline phase, which is generally a desirable attribute for an API [1-3]. Phase impurities are typically low levels of other concomitant polymorphs, alternative salt forms (such as a free base form when the primary phase is a salt), amorphous phases, or chemical impurities. Because of the control afforded by crystallization processes, phase purity can often exceed 99% w/w for typical APIs. Established analytical approaches to phase purity assessment involve recording powder XRD (PXRD) patterns of multiple batches produced from crystallization studies and identifying trends that help to determine the true pattern of a form, and obtaining a crystal structure using single-crystal XRD (SCXRD) and comparing a predicted pattern to an experimental PXRD pattern [3]. Alternatively, optical microscopy, vibrational spectroscopy, and DSC methods are also used in place of or in conjunction with PXRD. These established approaches can require a considerable amount of experimental work, often spanning several weeks. A more recent and efficient approach involves direct examination of the 13C SSNMR spectrum of a single sample for small peaks that are likely to be a phase impurity [5]; this approach requires less than a day of effort, but is highly dependent on the experience of the interpreting analyst. Recently, approaches have become available that rely on thorough indexing of high-quality transmission PXRD data, or the use of 2D SSNMR experiments that rely on spin diffusion effects (either directly observed or observed indirectly via 1H T1 relaxation) to prove phase association or separation [5-7]. Furthermore, modern techniques such as Raman microscopy now can supplement the use of optical microscopy to determine whether particles with a different habit are actually a different phase, improving confidence in more detailed investigations of phase purity.

Figure 1 - General classification of solid-state analytical techniques by time and information content. Basic techniques provide “fingerprint” information that is rapidly generated and requires little interpretation, but often does not directly answer the analytical question at hand. Intermediate and advanced techniques require more expertise and instrumentation, but can often directly answer more challenging solid-state analysis questions that would require excessive use of basic techniques, or would simply not be tractable using basic techniques. Note that analysis time is typically inversely related to cost.
Vibrational Spectroscopy and Microscopy
Vibrational spectroscopy and microscopy involve several techniques that probe molecular and crystal vibrational modes, including the major fields of IR and Raman spectroscopy [9,10]. Initial applications of IR and Raman spectroscopy within pharmaceutical analysis focused on the fingerprint nature of the techniques and derived only basic information content from the experiments. These applications are still popular for automated, high-throughput analyses and for quality control testing. Later, more detailed interpretation of vibrational spectra, particularly with respect to hydrogen bonding environments, became more common in pharmaceutical applications [3]. The development of quantitative vibrational spectroscopy methods for solid-state form has also increased dramatically over the past two decades, particularly with the advent of user-friendly multivariate analysis software. Over the years, IR sampling methods have expanded beyond transmission and diffuse reflectance methods and now include attenuated total reflectance (ATR) and microscopic sampling via transmission, reflection, or ATR approaches [10]. Raman spectroscopy has also advanced, particularly with the commercialization of sophisticated confocal instrument designs that are capable of quickly recording a Raman spectrum from a ~ 2 μm spot while mapping over wide sample areas. A typical design for a modern dispersive Raman microscope with mapping capability is shown in Figure 2, showing the nature of the depth selection (Z-axis) via focusing through the confocal hole, and XYmapping through the movable stage. This has in turn enabled the growth of Raman as a premier tool for chemical imaging, as discussed below. A number of other techniques based on vibrational spectroscopy have also been applied successfully, including reflectance near IR imaging [10]. Other imaging techniques based on vibrational spectroscopy, such as terahertz (THz) imaging, have found applications in specific roles such as the study of film coating thickness [11].
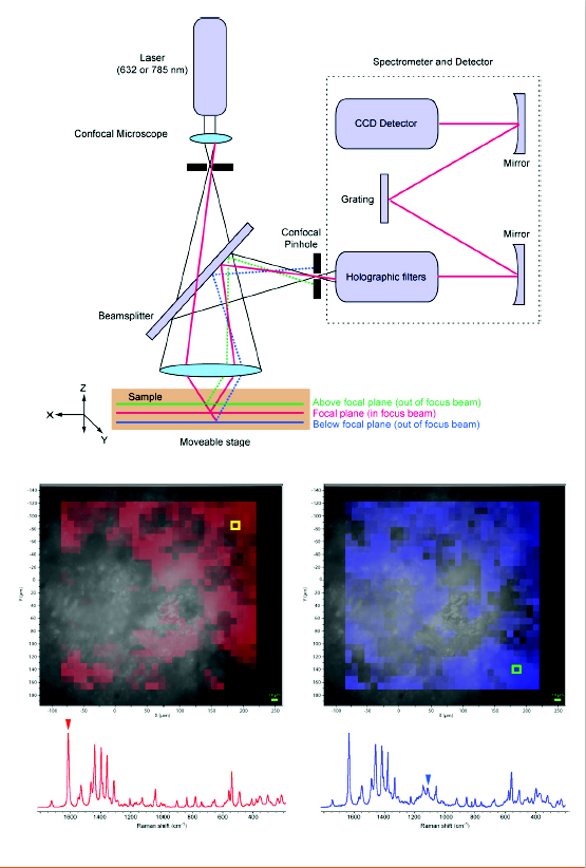
Figure 2 - (top) The basic design of a confocal Raman microscope suitable for mapping. (bottom) False-color Raman map of a 280 × 280 μm area of a cross-sectioned commercial levofloxacin tablet, superimposed on a brightfield optical image, showing areas of high drug content (red) via a Raman band at 1615 cm-1 and areas of high microcrystalline cellulose content (blue) via a Raman band at 1093 cm-1.
The increasing availability of confocal Raman microscopy and mapping has enabled effective solutions to a number of solidstate analytical challenges. For example, Raman microscopy has been used to study ethyl acetate and water trapped as inclusions within ciclopirox crystals [12]. Raman microscopy can thus determine whether solvent inclusion causes high residual solvent levels in API batches, which in turn can lead to potential process engineering solutions to the problem via alterations in crystal growth rate. Raman microscopy and mapping have also had a major impact on studies of oral dosage forms as well as a variety of less common formulations. For example, Raman microscopy and mapping have been used to study low-dose oral tablets, examine drug distribution and polymorphic form, and probe tablet coating homogeneity [13-15]. Raman spectroscopy and microscopy are particularly useful for examination of aerosols and powders intended for pulmonary delivery [16]. Raman microscopy can also be used to investigate microscopic phenomena that occur during dissolution processes, such as amorphous-to-crystalline transformations at the dissolving interface of a tablet, which in turn can explain unexpectedly poor dissolution from an amorphous API caused by recrystallization [17]. An example of the application of a modern Raman microscopic mapping method is shown in Figure 2. Here, a map of a 280 × 280 μm area of a cross-sectioned commercial levofloxacin tablet is shown. Raman spectral bands that are characteristic of microcrystalline cellulose and the API can be used to probe the concentration of each substance in the first few μm of the exposed surface. The brightfield optical images do not allow for easy discrimination between the components of the formulation, even with the use of polarized light. In addition, fluorescence microscopy and imaging can be combined with Raman microscopy in the same instrument to provide an orthogonal view of chemical distribution from fluorescent APIs. Chemical imaging information from Raman microscopy is finding increasing use in studies of the effects of changes to granulation and tablet compaction processes and parameters and to address product performance problems, such as dissolution failures.
X-ray Diffraction of Powders and Single Crystals
PXRD (also frequently referred to as X-ray powder diffraction, or XRPD) has for many years been a widely-used and highly discriminating solid-state analysis technique for characterization of pure crystalline active pharmaceutical ingredients (APIs). PXRD is sensitive to solid-state crystalline form because of diffraction of X-rays by periodic variations of electron density in crystals, leading to sensitive and specific diffraction patterns for different API forms. However, because of sensitivity limitations imposed by point detectors, PXRD was often unable to easily perform characterization of APIs in pharmaceutical blends or drug product samples. This limitation was related to correspondingly long collection times of samples containing low API loading and high excipient levels, or the interference of high intensity characteristic API diffraction peaks with crystalline excipient peaks. In recent years, advances in strip detectors have reduced data collection times for many drug product samples from hours to minutes. This in turn has allowed for the identification of API crystalline form in drug product samples containing low levels of API, or analysis of lower intensity but non-interfering characteristic peaks, and has further led to increased quantitative methods in situations where form control is an issue [18-20].

Figure 3 - Examples of PXRD data acquired using capillary transmission sampling and reflection sampling, for four different samples of the same compound exhibiting preferred orientation effects. The capillary transmission diffraction patterns provide more reliable analytical results than those obtained using reflection sampling.
Another more recent advancement in PXRD instrumentation has resulted from the engineering of multi-purpose systems that allow users to more easily and precisely change between various sample analysis geometries. Systems may be transformed from the standard Bragg-Brentano para-focusing “reflection” geometry typically used in the analyses of pharmaceutical powders in flat plate holders to the Debye-Scherrer “transmission” geometry typically used to analyze samples in capillaries or between thin films. It is generally accepted in the field that transmission analysis of samples in spinning capillaries reduces the effects of preferred orientation significantly and provides data with the most correct relative peak intensities. Preferred orientation results from the tendency of individual crystalline particle to lay parallel to the longer axes expressed by their habit; this in turn leads to a non-random distribution of crystallite orientations and effects upon PXRD peak intensities [21]. Data from unknown samples containing correct peak intensities may then be evaluated to quickly and directly determine the presence or absence of potential phase impurities. These same samples may have been difficult to characterize in typical Bragg-Brentano reflection mode because of preferred orientation effects. In Figure 3, this effect is illustrated for a series of samples showing preferred orientation. The diffraction patterns obtained with reflection PXRD sampling are strongly affected by preferred orientation, leading to deleterious effects on data analysis, interpretation, quantitative aspects, and assessment of phase purity. The effects are nearly eliminated by the use of capillary transmission PXRD sampling.

Figure 4 - VH PXRD data obtained using an environmental stage for a variable hydrate, illustrating the subtle peak shifting effects at higher relative humidity (% RH) indicative of lattice expansion. The inset shows the gravimetric vapor sorption isotherm observed for this material, showing the change in mass as a function of relative humidity.
Transmission analysis may also facilitate the development of quantitative or semi-quantitative methods with less sample manipulation, such as grinding samples prior to sample analysis, leading to less complex methods and a lessened chance of unexpected effects during sample preparation [22]. In addition, environmental XRPD techniques such as variable humidity (VH) or variable temperature (VT) are increasingly valuable in the elucidation of complex solid-state conversions, and provide more clearly understandable explanation for features observed in complimentary thermal and vapor sorption solidstate analyses [23]. For example, Figure 4 shows a typical example of a variable hydrate system characterized by VH PXRD experiments. A systematic shift in a particular reflection is shown that is caused by lattice expansion, which is in turn characteristic of water uptake in a variable hydrate. The improved designs of multipurpose PXRD systems allow experienced operators to swap system configurations quickly and thus more frequently apply environmental PXRD techniques.
Typically, PXRD analysis in the pharmaceutical industry has been used most extensively to study crystalline materials. More recently, amorphous characterization techniques have become crucial to understand the growing number of glassy amorphous materials as well systems that appear amorphous to PXRD (e.g. nano-crystalline systems) because of a lack of long-range order. Recent advancements in laboratory-accessible (non-synchrotron) X-ray sources, such as Ag sources, combined with the pair distribution function (PDF) data transformation technique, have opened a new avenue to study the amorphous state by PXPD with conventional laboratory instrumentation [24,25]. This has been increasingly and particularly useful when used in conjunction with other solid-state techniques such as those discussed in this review. There have also been significant advances in other XRD techniques used to study systems lacking long range order, such as small angle X-ray scattering (SAXS). Improvements in X-ray sources, optics, and detection systems have allowed the study of nanostructures by this method of analysis without the need for synchrotron sources [26].
While most innovations have occurred in the field of PXRD, singlecrystal diffraction studies have also benefited from improved detector and source designs. SCXRD analysis has become increasingly automated, allowing faster data collection and semi-automated structure determination for favorable systems. Improved SCXRD instrumentation also allows more thorough analysis of structural disorder commonly seen in pharmaceutical phases. Finally, SCXRD instrumentation has also benefited from development in parallel fields, such as macromolecular crystallography, leading to a general trend towards reduced crystal size requirements, which helps to alleviate the time-consuming step of single crystal growth [27].
SNMR Spectroscopy
SSNMR spectroscopy provides detailed short-range information about solid-state structure primarily by reporting on the electronic environment around atomic nuclei, and by reporting on effects mediated by dipolar coupling. It obtains this information through observation of the magnetic resonance spectra of various nuclear isotopes, which for pharmaceutical materials can include 13C, 1H, 15N, 19F, 23Na, and 31P. SSNMR has been applied in a number of pharmaceutical applications for many years, including studies of polymorphism [3-6], solvation [28], salts and cocrystals [6,29], and various types of formulations [31-33].
In the past ten years, the manner in which pharmaceutical SSNMR is applied has gradually shifted from the almost exclusive use of the basic 13C cross-polarization magic-angle spinning (CPMAS) experiment to more extensive use of multinuclear methods, 2D SSNMR, and relaxation time analyses [34]. This shift has coincided with advances in instrumentation, including more robust and flexible probe designs, higher MAS spinning rates, higher static field strengths, and electronics capable of rapid frequency, phase, and amplitude switching at high radiofrequency powers.

Figure 5 - Multinuclear SSNMR of a punched section of a 500 mg commercial levofloxacin tablet using (a) 13C CP-TOSS and (b) 19F CP-MAS experiments. Spectra were obtained at a field strength of 9.4 T using a 4 mm MAS probe at a spinning rate of 8 kHz.
The use of other nuclei beyond 13C in pharmaceutical SSNMR experiments has become more frequent, particularly in applications to drug product. For example, experiments that access the 19F nucleus are generally several times more sensitive than those that make use of the 13C nucleus, and also provide complementary chemical shift and dipolar connectivity information. Use of the 19F nucleus has enabled detection of phase impurities at the 1% w/w or less level in complex drug product matrices [35, 36]. A basic example of the multinuclear approach is shown in Figure 5. Here, the 13C cross polarization with total sideband suppression (CPTOSS) spectrum of a commercial levofloxacin tablet is compared with a 19F CP-MAS spectrum of the same sample, acquired in sequence on a 4-mm MAS probe. The 13C spectrum shows both the drug and organic excipients, but required 10 hours of acquisition time to obtain the spectrum shown; the 19F spectrum shows only the API, but only required 5 minutes of acquisition time to achieve a signal-to-noise of 374:1. Because of the complementary nature of the results, and the ease with which it can be obtained, it is increasingly common to record both 13C and 19F spectra for fluorinated APIs. Other common examples of multinuclear SSNMR make use of 1H, 23Na, 31P, and other common nuclei in pharmaceutical materials, as well as nuclei easily labeled via water exchange such as 2H and 17O [5,34].
Relaxation analysis has also been increasingly used in studies of pharmaceutical materials. Early work centered upon measurement of 13C spin-lattice relaxation times (T1), which can be related to molecular mobility especially when explored over a wide temperature range [3]. More recently, 1H spin-lattice relaxation times in the rotating frame (T1ρ) have been shown to be a more sensitive probe of glass transition and mobility changes in amorphous solids than DSC-based methods [37]. Because the observation of different 1H T1 values for different molecular components (e.g. via 13C -detection) can prove macroscopic phase separation, these values are often used to detect phase separation in crystalline and amorphous materials [30,38]. 1H T1 measurements are also highly useful in conjunction with CP buildup rate measurements to provide quantitative SSNMR analysis in systems for which standards are not available [39].
The use of 2D SSNMR has also increased in recent years, especially in applications that make use of the 1H nucleus through homonuclear dipolar decoupling and/or fast MAS. The primary benefit of 2D SSNMR is its ability to rapidly and definitively detect association between different molecules and phases in both crystalline and amorphous solids, which makes it ideally suited to analysis of cocrystals, amorphous dispersions, and phase mixtures of various types [28, 40]. For example, during the initial screening and preparation of cocrystals, it is common to use methods that produce powders in small quantities and may produce novel cocrystalline phases, novel polymorphs and solvates, or complex phase mixtures of known and novel phases. Because of the lack of reference spectra or patterns for the novel phases, comparison of 13C 1D SSNMR, PXRD or vibrational spectra with reference spectra of known phases is unable to directly confirm the desired molecular association. The cocrystal preparation methods are also not generally amendable to single-crystal production for SCXRD to show molecular association. 2D SSNMR can fill this gap, providing direct evidence of association to augment the detection of a novel phase by the other techniques, while also simultaneously observing hydrogen bonding and aromatic π–stacking environments of importance in many cocrystal structures [30]. Thus, in the context of Figure 1, 2D SSNMR does not provide the information content of SCXRD (a complete crystal structure), but provides the desired proof of molecular association more effectively.
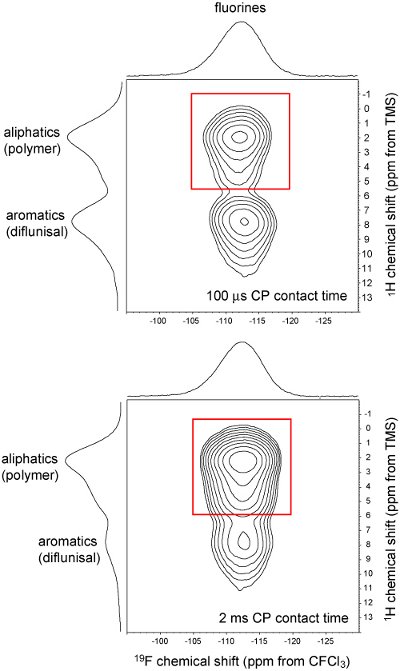
Figure 6 - 2D 1H-19F CP-HETCOR SSNMR spectra of a 20% w/w amorphous dispersion of diflunisal in a polyvinyl caprolactam/ polyvinyl acetate/polyethylene glycol copolymer. Spectra were obtained at a field strength of 9.4 T using a 4 mm probe at a spinning rate of 12.5 kHz. The peak within the red box arises primarily from direct dipolar transfers between drug and polymer, specifically between 1H and 19F nuclei (at the 100 μs contact time) and multi-step spin diffusion transfers amongst 1H nuclei prior to direct transfer to 19F nuclei (at the 2 ms contact time). The spectra provide direct evidence of molecular association between diflunisal and the polymer on a ~10 A scale.
2D SSNMR is similarly useful in the analysis of amorphous dispersions, where it is often desired to show glass solution formation and avoid the occurrence of small domains that range from nanometer-scale API domains within a polymer up to phaseseparated amorphous API [40]. Conventional approaches using mDSC to observe a single Tg event, known to be indicative of mixing on a scale of 50 nm or less [41], are often hampered by the inability to definitively assign or observe a separate Tg event for drug and polymer. Because 2D SSNMR experiments can be tailored to detect molecular association on different distance scales, they can be used to augment mDSC and show intimate API-polymer association on scales ranging from several Å up to hundreds of nm and beyond [40]. An illustration for a molecular dispersion is shown in Figure 6, where the 2D 1H-19F crosspolarization heteronuclear correlation (CP-HETCOR) spectrum of a previously unreported dispersion shows 2D correlations (red boxes) between the fluorinated API diflunisal dispersion with a polyvinyl caprolactam/polyvinyl acetate/polyethylene glycol copolymer prepared by spray-drying from methanol solution. Because diflunisal contains no aliphatic protons, any correlation to an aliphatic 1H chemical shift is indicative of a short range APIpolymer interaction on a length scale of several Å, which is further confirmed by the increased intensity observed at the longer 2 ms CP contact time caused by more extensive 1H-1H spin diffusion. Beyond this simple example, 2D SSNMR is generally applicable to more complex dispersions containing a range of 1H chemical shifts for both API and polymer [40]. The experiments shown in Figure 6 each required about 2 hours of acquisition time to complete, thus rendering 2D SSNMR an effective tool to augment mDSC in analysis of amorphous dispersions.
Conclusions
Advances in solid-state analysis, particularly in the fields of PXRD, SSNMR, and vibrational microscopy, have enabled greater understanding of supramolecular phenomena and more effective approaches to solid-state analysis, by allowing answers to be obtained more quickly and/or more confidently than using previous methods. Some of the most important advances have impacted the detection of phase impurities, the detection of molecular association in cocrystals and amorphous dispersions, the ability to chemically map oral dosage forms, and improved capabilities for quantitative analysis of solid forms even within the final dosage form at low levels. When combined with existing methodologies, this allows for better understanding and ultimately control of pharmaceutical solids. Although solid-state analysis continues to advance rapidly, a number of common analytical questions that affect the control of pharmaceutical solids remain challenging. For example, the effect of chemical and elemental impurities upon API crystallization processes as chemistry is improved during development, particularly as manifested in habit modification effects or by the appearance of previously-suppressed forms, is still an area where greater contributions from surface and bulk analytical methods would be beneficial. As analytical techniques in the broader fields of chemistry and materials science continue to advance, it is likely that new applications to pharmaceutical problems will continue to enhance solid-state analysis.
References
- A. S. Raw, M. S. Furness, D. S. Gill, R. C. Adams, F. O. Holcombe, L. X. Yu, “Regulatory considerations of pharmaceutical solid polymorphism in Abbreviated New Drug Applications (ANDAs),” Adv. Drug Delivery Rev., 56, 397-414 (2004).
- S. L. Lee, A. S. Raw, L. Yu, “Significance of Drug Substance Physiochemical Properties in Regulatory Quality by Design,” in Drugs and the Pharmaceutical Sciences, 178 (Preformulation in Solid Dosage Form Development) (2008), pp. 571-583.
- S. R. Byrn, R. R. Pfeiffer, J. G. Stowell, Solid-state Chemistry of Drugs, SSCI, West Lafayette, IN, 1999.
- T. L. Threllfall, “Analysis of Organic Polymorphs: A Review,” Analyst, 120, 2435-2460 (1995).
- F. G. Vogt, “A Multi-disciplinary Approach to the Solid-state Analysis of Pharmaceuticals,” Am. Pharm. Rev., 11, 50-57 (2008).
- F. G. Vogt, “Solid-State Nuclear Magnetic Resonance of Polymorphic Materials,” in The Encyclopedia of Analytical Chemistry, Wiley: New York, 2011, in press. 7
- G. A. Stephenson, “Applications of X-Ray Powder Diffraction in the Pharmaceutical Industry,” Rikagu J., 22, 2-15 (2005).
- M. A. Neuman, “X-Cell: a novel indexing algorithm for routine tasks and difficult cases,” J. Appl. Cryst. 356-365 (2003).
- N. B. Colthup, L. H. Daly, S. E Wiberley, Introduction to Infrared and Raman Spectroscopy, 3rd Ed., Academic Press, New York, 1990.
- P. Fredericks, L. Rintoul, J. Coates, “Vibrational Spectroscopy: Instrumentation for Infrared and Raman Spectroscopy”, in Ewing’s Analytical Instrumentation Handbook, 3rd Ed., Marcel-Dekker, New York, 2004, pp. 163-238
- L. Ho, R. Müller, K. C. Gordon, P. Kleinebudde, M. Pepper, T. Rades, Y. Shen, Philip F. Taday, J. A. Zeitler, “Applications of terahertz pulsed imaging to sustained-release tablet film coating quality assessment and dissolution performance,” J. Controlled Release, 127, 79-87 (2008).
- N. Couvrat, A. S. Blier, B. Berton, Y. Cartigny, V. Dupray, G. Coquerel, “Characterization of Defects Inside Single Crystals of Ciclopirox,” Cryst. Growth & Des., 9, 2719–2724 (2009).
- M. J. Henson, L. Zhang, “Drug Characterization in Low Dosage Pharmaceutical Tablets Using Raman Microscopic Mapping,” Appl. Spectrosc. 60, 1247-1255 (2006)
- B. Vajna, I. Farkas, A. Szabó, Z. Zsigmond, G. Marosi, “Raman microscopic evaluation of technology dependent structural differences in tablets containing imipramine model drug,” J. Pharm. Biomed. Anal., 51, 30-38 (2010).
- A. S. El Hagrasy, S.-Y. Chang, D. Desai, S. Kiang, “Raman spectroscopy for the determination of coating uniformity of tablets: assessment of product quality and coating pan mixing efficiency during scale-up,” J. Pharm. Innov., 37-42 (Sept./Oct. 2006).
- H. M. Mansour, A. J. Hickey, “Raman Characterization and Chemical Imaging of Biocolloidal Self-Assemblies, Drug Delivery Systems, and Pulmonary Inhalation Aerosols: A Review”, AAPS PharmSciTech, 8, 140-155 (2007).
- K. Greco, R. Bogner, “Crystallization of Amorphous Indomethacin during Dissolution: Effect of Processing and Annealing,” Mol Pharmaceutics, 7, 1406–1418 (2010).
- D. Giron, S. Monnier, M. Mutz, P. Piechon, T. Buser, F. Stowasser, K. Schulze, M. Bellus, “Comparison of Quantitative Methods for Analysis of Polyphasic Pharmaceuticals,” J. Therm. Anal. Calorimetry, 89, 729–743 (2007).
- . V. B. Cooper, G. E. S. Pearce, C. R. Petts, “Quantification of crystalline forms in active pharmaceutical ingredient and tablets by X-ray powder diffraction,” J. Pharm. Pharmacol., 55, 1323-1329 (2003).
- R. Suryanarayanan, C. S. Herman “Quantitative analysis of the active ingredient in a multi-component tablet formulation by powder X-ray diffractometry,” Int. J. Pharm., 77, 287-295 (1991).
- W. A. Dollase, “Correction of Intensities for Preferred Orientation in Powder Diffractometry: Application of the March Model,” J. Appl. Cryst., 19, 267-272 (1986).
- Z. Nemet, I. Sajo, A. Demeter, “Rietveld refinement in the routine quantitative analysis of famotidine polymorphs,” J. Pharm. Biomed. Anal., 51, 572–576 (2010).
- A. Kishi, H. Toraya, “Simultaneous Measurements of X-ray Diffraction (XRD) and Differential Scanning Calorimetry (DSC) Under Controlled Humidity Condition: Instrumentation and Application to Studies on Hydration, Dehydration, and Re-Hydration Processes of Pharmaceutical Compounds,” Adv. X-ray Anal., 47, 240-248 (2004).
- S. J. L. Billinge, “Nanoscale structural order from the atomic pair distribution function (PDF): There’s plenty of room in the middle,” J. Solid State Chem., 181, 1698– 1703 (2008).
- S. Bates, G. Zografi, D. Engers, K. Morris, K. Crowley, A. Newman, “Analysis of Amorphous and Nanocrystalline Solids from Their X-Ray Diffraction Patterns,” Pharm. Res., 23, 2333-2349 (2006).
- Q. Zhu, L. S. Taylor, M. T. Harris, “Evaluation of the Microstructure of Semicrystalline Solid Dispersions,” Mol. Pharmaceutics, 7, 1291-1300 (2010).
- C.Riekel, M. Burghammer, G. Schertler G. “Protein crystallography microdiffraction,” Cur. Opin. Struct. Biol. 15, 556-562 (2005).
- F. G. Vogt, D. E. Cohen, J. D. Bowman, G. P. Spoors, G. E. Zuber, G. A. Trescher, P. C. Dell’Orco, L. M. Katrincic, C. W. DeBrosse, R. C. Haltiwanger, “Structural analysis of polymorphism and solvation in tranilast,” J. Pharm. Sci., 94, 651-665 (2005).
- Z. J. Li, Y. Abramov, J. Bordner, J. Leonard, A. Medek, A. V. Trask, “Solid-State Acid-Base Interactions in Complexes of Heterocyclic Bases with Dicarboxylic Acids: Crystallography, Hydrogen Bond Analysis, and 15N NMR Spectroscopy,” J. Am. Chem. Soc. 128, 8199-8210 (2006).
- F. G. Vogt, J. S. Clawson, M. Strohmeier, A. J. Edwards, T. N. Pham, S. A. Watson, “Solid-state NMR Analysis of Organic Cocrystals and Complexes,” Cryst. Growth & Des., 9, 921-937 (2009).
- B. T. Farrer, A. Peresypkin, R. M. Wenslow, “Quantitation of crystalline material within a liquid vehicle using 1H/19F CP/MAS NMR,” J. Pharm. Sci., 96, 264-267 (2007).
- S. Sotthivirat, J. W. Lubach, J. L. Haslam, E. J. Munson, V. J. Stella, “Characterization of prednisolone in controlled porosity osmotic pump pellets using solid-state NMR spectroscopy,” J. Pharm. Sci., 96, 1008-1017 (2007).
- L. M. Katrincic, Y. T. Sun, R. A. Carlton, A. M. Diederich, R. L. Mueller, F. G. Vogt, “Characterization, Selection, and Development of an Orally-dosed Drug Polymorph from an Enantiotropically-related System,” Int. J. Pharm., 366, 1-13 (2009).
- F. G. Vogt, “The Evolution of Solid-state NMR in Pharmaceutical Analysis,” Fut. Med. Chem., 2, 915-921 (2010).
- R. M. Wenslow, “19F Solid-State NMR Spectroscopic Investigation of Crystalline and Amorphous Forms of a Selective Muscarinic M3 Receptor Antagonist, in Both Bulk and Pharmaceutical Dosage Form Samples,” Drug Dev. Ind. Pharm., 28, 555–561 (2002).
- L. M. Katrincic, Y. T. Sun, R. A. Carlton, A. M. Diederich, R. L. Mueller, F. G. Vogt, “Characterization, Selection, and Development of an Orally-dosed Drug Polymorph from an Enantiotropically-related System,” Int. J. Pharm., 366, 1-13 (2009).
- A. Forster, D. Apperly, J. Hempenstall, R. Lancaster, T. Rades, “Investigation of the physical stability of amorphous drug and drug/polymer melts using variable temperature solid state NMR,” Pharmazie, 2003, 58, 761-762.
- N. Zumbulyadis, B. Antalek, W. Windig, R. P. Scaringe, A. M. Lanzafame, T. Blanton, M. Helber, “Elucidation of Polymorph Mixtures Using Solid-state 13C CP/MAS NMR Spectroscopy and Direct Exponential Curve Resolution Algorithm,” J. Am. Chem. Soc. 121, 11554-11557 (1999).
- T. J. Offerdahl, J. S. Salsbury, Z. Dong, D. J. W. Grant, S. A. Schroeder, I. Prakash, E. M. Gorman, D. H. Barich, E. J. Munson, “Quantitation of crystalline and amorphous forms of anhydrous neotame using 13C CPMAS NMR spectroscopy,” J. Pharm. Sci., 94, 2591-2605 (2005).
- T. N. Pham, S. A. Watson, A. J. Edwards, M. Chavda, J. S. Clawson, M. Strohmeier, F. G. Vogt, “Analysis of Amorphous Solid Dispersions using 2D Solid-state NMR and 1H T1 Relaxation Measurements,” Mol. Pharmaceutics, 7, 1667–1691 (2010).
- A. Newman, D. Engers, S. Bates, I. Ivanisevic, R. C. Kelly, G. Zografi ”Characterization of amorphous API:polymer mixtures using X-ray powder diffraction,” J. Pharm. Sci. 97, 4840-4857 (2008).
Author Biographies
Frederick G. Vogt,Ph.D., is the manager of a spectroscopy and compendial methods function within Product Development at GlaxoSmithKline. His interests include NMR, x-ray diffraction, and vibrational and molecular spectroscopy, as applied to drug substance crystallization and form control, drug product and excipient characterization and secondary manufacturing processes, and patent support. He has more than 10 years of experience in these fields, and currently leads a team of spectroscopists focused on small-molecule and biopharmaceutical drug development. He has contributed to more than 30 peer-reviewed publications and four book chapters involving spectroscopy and solid-state analysis.
Glenn R. Williams, Ph.D., is an Investigator within Exploratory Development Sciences at GlaxoSmithKline. His interests are in solid-state characterization of amorphous and crystalline pharmaceutical materials (active drug substances, excipients, and drug products). In particular, he has been focused on x-ray diffraction, microscopy, thermal analysis, and molecular spectroscopy. He has over 12 years of solid-state analysis experience in the pharmaceutical industry from both the brand and generic perspectives.
This article was printed in the November/December 2010 issue of American Pharmaceutical Review - Volume 13, Issue 7. Copyright rests with the publisher. For more information about American Pharmaceutical Review and to read similar articles, visit www.americanpharmaceuticalreview.com and subscribe for free.