Introduction
Freeze drying (lyophilization) is a process used widely for improving the stability of labile pharmaceuticals. It is the formulation of choice for compounds unstable in solution or for heat labile pharmaceutical products and biological compounds. During the formulation of freeze dried formulations, it is critical to ensure the reconstitution of the lyophile is rapid and complete. The speed of reconstitution is directly linked to the physical state of the constituents of the formulation and the porosity of the cake. Thus during the formulation and process design it is essential that a full understanding of the likely variability in the physical properties of the formulation is gained to prevent changes of the lyophile cake either during or after manufacture.

Figure 1 - Freeze-drying cycle showing key steps: freezing, annealing, primary drying, secondary drying; green line represents the shelf temperature
Freeze-drying Cycle
The freeze drying cycle consists of several steps: freezing, annealing, primary drying and secondary drying (Figure 1). The efficiency of each stage in a freeze-drying cycle depends upon process parameters such as pressure, temperature and duration and should be designed according to the physical properties of the formulation [2]. During freezing, the product is cooled to around -30°C and any unbound water forms ice crystals. The rate of freezing determines the size and extent of ice crystals which can have an impact on drying kinetics and product porosity. During the primary drying step, ice sublimes. Sublimation is an endothermic phase transition which occurs at temperature and pressure below a substance’s triple point in its phase diagram. As primary drying step is the longest of the cycle, to increase the rate of sublimation the temperature of the product should be as high as possible without product collapse or detrimental to the product appearance due to ”blow out”/ablation. The physical properties of the formulation, specifically the glass transition temperature (Tg) and any eutectic temperatures (Teu) should be considered when formulating freeze dried products to ensure an optimal cycle with reproducible quality product is manufactured. Optimization of this stage can lead to a time and hence cost reduction of the whole freeze drying process. According to literature, a 1°C increase of product temperature during primary drying can decrease the overall sublimation time by 13% [1].
During secondary drying, water, which still remains in an amorphous state (5-20%), is desorbed from the freeze concentrate at high temperature and low pressure to a level typically less than 1% [1, 2]. An understanding of the water level that can be tolerated in the vial to achieve good chemical and physical stability in combination with the potential degradation caused at high temperatures should drive the conditions for secondary drying.
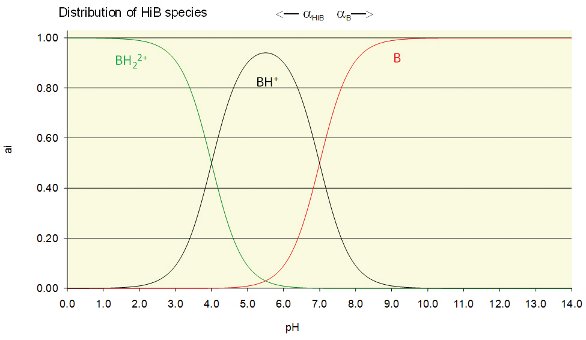
Figure 2 - Prediction of species present for a base with two pKa’s of ~4 & 7

Figure 3 - Prediction of species present for an acid with 3 pKa’s of ~3, 5 & 7
Solution Speciation
During the formulation stages of a lyophilized product, it is commonplace to change the pH of the solution due to poor solubility of the components. The species present at a particular pH are determined according to the Henderson-Hasselbalch equation (see Equation 1)
pH = pKa + log [H+][A-] / [HA] Equation 1
Thus at different pH’s, especially around the pKa, it is possible for different species of each component to be present. As different species present will have different physical properties in the frozen solution it is critical to ensure these are fully understood to avoid changes during drying. An example of species present for an acid and base at a range of pH’s are shown in Figures 2 & 3.
Amorphous Material Properties
During the freezing process, due to the rapid formation of ice, it is likely that the drug is precipitated as an amorphous material. This amorphous material will have a high degree of associated water depending on the physical properties of the constituents.
Due to the amorphous properties of lyophilized formulations, they exhibit glass transition temperatures. Above the glass transition temperature (Tg) an increase in mobility is observed hence changes in the physical properties of the cake are possible. All amorphous components of the lyophile will contribute to the Tg hence on freezing the solution all components will solidify in the maximally hydrated state due to specific interactions with water preventing crystalline ice formation. The resultant glass transition of this system is known as the Tg’.
During freeze drying, it is critical to maintain the temperature of the product below that of the Tg’ to avoid movement in the bulk resulting in visible “collapse” where the network structures occurs producing a freeze dried cake of lower porosity and potential for crystallization of components exists.
Aim
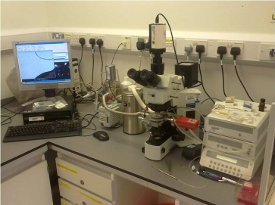
Figure 4 - Picture of Freeze drying microscope
Due to the presence of different species at different pH’s, a change in the physical properties of the resultant solids on freezing will be observed. This paper aims to report the results from studies on the effects of differing levels of acid on two basic compounds in development and what constraints should be made during the formulation process to optimize physical properties.
Methodology
To investigate the collapse temperature (Tc) of the freeze dried materials a freeze drying microscope (see Figure 4) equipped with a cooling stage, vacuum pump and pressure gauge was utilized. Samples of 2μl were frozen by cooling at 2°C/min and then heated under a vacuum of 0.2 Torr at 2°C/min with an image recorded every 5 seconds.
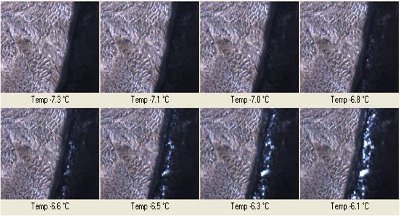
Figure 5 - Example of collapse on sample by freeze dried microscopy (Collapse temperature ~-7°C)
In the presence of the crystalline ice network, the amorphous materials, even above the collapse temperature, are supported. However, once sublimation of the ice has occurred and the temperature is raised above the Tg’, materials begin to flow in real time and collapse is observed with a drastic reduction in the porosity. An example of collapse measured by freeze drying microscope is shown in Figure 5 with a resultant change in the freeze dried cake appearance being shown in Figure 6.
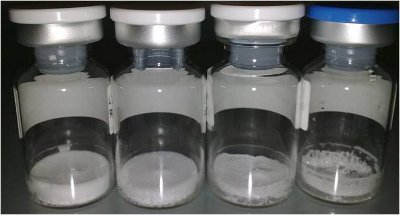
Figure 6 - Collapse of freeze dried cakes. Left sample ~ limited collapse through to Right sample ~ extensive collapse
For collapse to occur, the amorphous materials must have some mobility in real time. The freeze drying microscope records the temperature at which materials become mobile as the collapse temperature (Tc). The Tc can be measured using a freeze drying microscope. The Tg’ will be close to that of the collapse temperature but, depending on the fragility of the amorphous system (i.e. how the mobility of the system changes as it approaches the Tg’), there is no definite correlation hence the rule of thumb is to have the product temperature at least 5°C below the lower of Tg’ or Tc. An excellent review of the relationship between Tg’ and Tc is provided by Pikal and Shah [3].
To investigate the glass transition temperature of frozen solutions (Tg’), samples were analyzed. Samples (10μl) in hermetic pans were cooled at 1°C/min to -40°C then heated to 50°C at 5°/min. These cooling and heating rates are slightly different from those used in the microscopy experiments to improve sensitivity of the DSC. A typical DSC trace for a solution is shown in Figure 7 showing the Tg’ (inset).
Prediction of the pH’s of solutions was performed using the pH titration prediction tool “Curtipot” [4].

Figure 7 - DSC thermogram showing Tg’ (inset)
Compound Selection
To investigate the effects of different numbers of ionizable groups on physical properties of frozen solution, two basic compounds have been chosen. Compound A has a single pKa and Compound B has three pKa’s over the range 2-8.
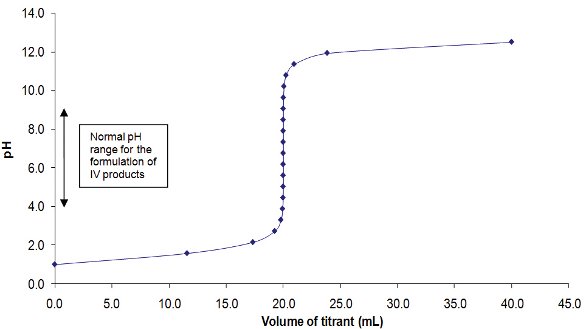
Figure 8-Prediction of pH of a titration with strong acid and strong base
Single Acid/Base Systems
For a solution, the best way to change the pH and hence the solubility is by adding strong acid to a base (e.g. HCl) or strong base to an acid (e.g. NaOH). However, as these are completely dissociated at most pH’s there is essentially no buffer capacity around biorelevant pH’s hence the ability to adjust to a predetermined pH is very difficult as shown in Figure 8 for a titration of a basic solution into a strong acid.
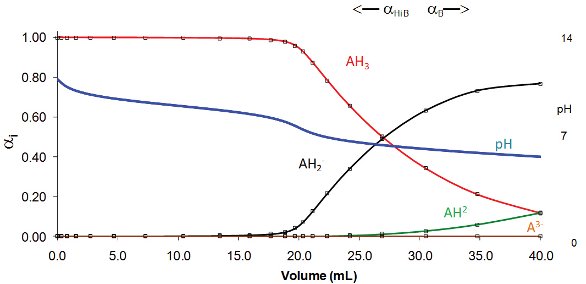
Figure 9- Prediction of species of citric acid present for titration of citric acid into a solution of compound A (equimolar amounts at 20ml)
To avoid this scenario, weaker pH adjusting substances are frequently used as they offer a certain amount of buffer capacity during pH adjustment. Such examples are citric acid for bases and arginine for acids. However, due to their relatively neutral pKa’s and significant buffer capacity along with large molecular weights, they add a lot of bulk (and hence solids) to produce a small change in pH. As it is common practice to formulate to a set pH due to buffering, this can result in quite differing amounts of acid being added to produce a solution within the specifications of the formulation. An example of the change in pH for a solution of citric acid being titrated into a solution of weak base (in this case Compound A with pKa of ~9) is shown in Figure 9. The change of pH for a set addition of citric acid solution is quite small.
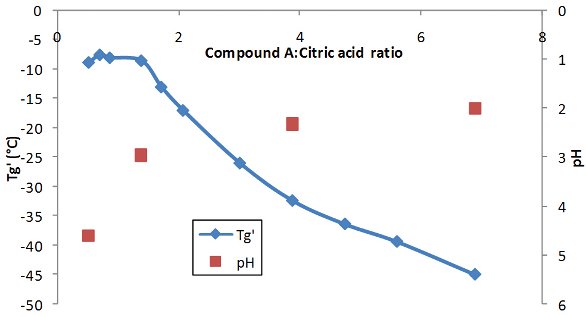
Figure 10-Plot of change of Tg’ for different ratios of citric acid:Compound B. Labels indicate pH of the resultant solutions
To understand the effects of changing the level of acid for a fixed amount of base on physical properties of solutions containing different molar ratios of citric acid with constant Compound A were made up and analyzed for their collapse temperature and Tg’. The results for the collapse temperature of Compound A are shown in Figure 10 with the numbers on the plot indicating the resultant pH of the solutions.
The results clearly show that when the ratio of acid/API approaches unity the Tg’ is at a maximal level. At a 1:1 ratio of acid/API the major species present will be the citrate salt of Compound A. It has been reported in the literature [5] that the formation of salts effectively increases the size of the molecules by the formation of a network linked by hydrogen bonding. This produces an increase in the Tg’ similar to the increase in Tg’ observed for an increase in the size of the molecule as reported for polyols and saccharides [6]. It has not been possible to investigate ratio’s of acid:API <1 due to the limited solubility of the API as, due to the higher pH’s at these ratios a high proportion of unionized API is present.
It can clearly be seen that at excesses of citric acid i.e. where acid:API ratio >1 the Tg’ rapidly decreases. Once the entire API is ionized and linked with a citrate molecule any excess citric acid will have a direct effect on the Tg’. The Tg’ of free citric acid has been measured at -53°C hence any excess citric acid will have a profound effect on reducing the Tg’ of the system. Due to the buffering effect of the citric acid linked to the species change at poorly acidic conditions, there is very little change in the pH of the solutions for even large changes in the ratio of citric acid: API. Thus it is a real possibility that during the formulation different amounts of acid may be added with changes of the pH within the limits of the formulation.
Multiple pKa API’s
The majority of API’s in development have multiple pKa’s hence to investigate this further Compound B was investigated using the same set-up as for Compound A with a range of citric acid:API ratios being investigated. The results are shown in Figure 11 and exhibit a similar trend to that observed for Compound A

Figure 11 - Prediction of species of citric acid present in solution during the titration of a solution containing Compound B with a citric acid solution (Equimolar at 20ml)
Due to the multiple species of both acid and, due to the multiple pKa’s in this region, the API there is a complex buffer system that exists across this pH range. Thus the change in pH is quite small even for large changes in the ratio of acid:API and, as multiple salt forms can be formed between the acid:API i.e. 3:1, 2:1, 1:1, 1:2, 1:3, 3:2, 2:3, it is not possible to have free citric acid present until the ratio of acid:API exceeds 3:1 hence the Tg’ does not begin to decrease rapidly until this value has been exceeded.

Figure 12 - Prediction of species of Compound B present in solution during the titration of solution containing Compound B with a citric acid solution (Equimolar at 20ml)
The speciation diagrams for both citric acid and Compound B at different pH’s are shown below in Figures 11 and 12. They both show that at around neutral pH’s a number of different species are present indicating multiple species present and hence a complex buffer system is possible.
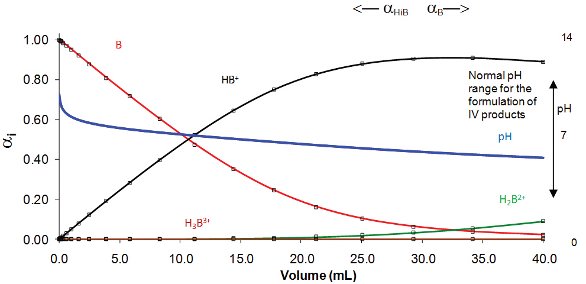
Figure 13 - Plot of Tg’ for different ratios of Compound A and Compound B with ascorbic acid and their corresponding pH’s
This work has also been performed for both API’s with the base ascorbic acid (two pKa’s 4.1 and 11.8). For the majority of purposes, the higher pKa can be ignored as out of the range of normal formulations and thus only relationship between -1 and -2 protons is of relevance. Due to the limited species possible, it is to be expected that there is a lower level of buffer capacity and indeed there is a greater change in the pH on changing the ratio of acid: API as shown in Figure 13. This is not observed with Compound B as even though the acid has limited opportunity to ionize at neutral pH’s the API with multiple pKa’s acts as a buffer system.
As for the citric acid system, a rise in the Tg’ approaching 1:1 ratios of Acid: API is observed due to the formation for the salt and also a lower rise is observed for Compound B due to multiple salt species being formed.
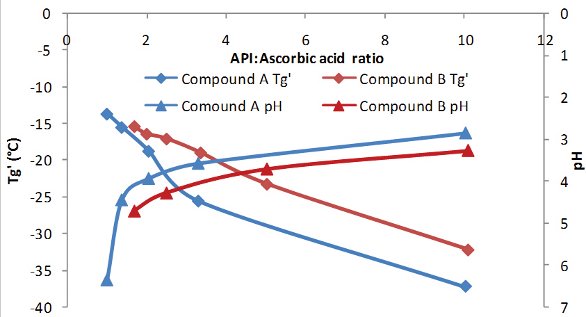
Figure 14 - Plot of Tg’ for different ratios of Compound A and Compound B with ascorbic acid and their corresponding pH’s
Mixed Acid Systems
Due to the buffering effect of poorly acidic/basic species, stronger acids/bases are frequently used to change the pH without significant addition to the solids present. The presence of weaker acids/bases can act as a buffer to prevent overshoot during pH adjustment as demonstrated in Figure 14. The effect is less pronounced for Compound B than for Compound A as it acts as its own buffer at neutral pH’s as demonstrated in Figure 15.

Figure 15 & 16 - Prediction of the effect of presence of different amounts of citric acid present in solution with Compound A or B on titration with HCl (equimolar content at 0% citric acid is 20ml)
As an extension of the single acid species being present, the effects of mixtures of the weak acid glycolic and the strong acid HCl on the Tg’ have been investigated. This system was chosen as both glycolic and HCl are monoprotic acids thus should not provide any buffering effect. This mixture was used to investigate the effect on the collapse temperature of solutions of ranging total acid: API ratios with Compound A as this is a simple, single pKa basic molecule. A prediction of the change in pH for different levels of glycolic acid in solution prior to titration is shown in Figure 16.
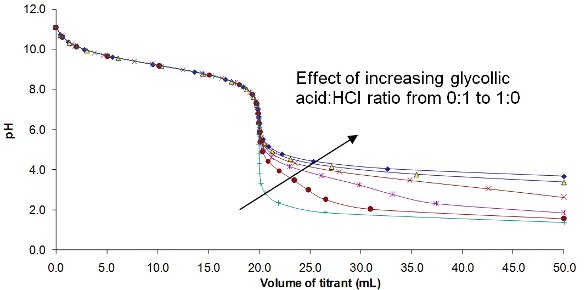
Figure 17 - Prediction of the effect of glycolic acid:HCl ratio present in the titrant for a fixed acid strength on the pH during titration into a solution of Compound A (equimolar content 20ml)
Results from assessment of the mixtures of glycolic acid:HCl to produce a total acid:API ratio of 0.8-1.5 have been investigated and the Tg’ of the resultant solutions shown in Figure 17. It was not possible to produce the solutions at 0.8:1 total acid:API ratio at high glycolic acid due to limits in solubility.
The results indicate that at a total acid:API of 1:1 the Tg’ shows only a slight variation on changing the salt composition with the highest Tg’ being produced when HCl predominates. The Tg’ of the different salts formed will be dependant on a number of properties e.g. hydrogen bonding profile, pKa and is outside of the scope of this document but an excellent review of the effects of different counter-ions on the Tg of amorphous materials in the solid state is provided by Towler et al [7]. For fixed ratios of glycolic:HCl the trends observed for changing the total acid:API ratio provides a similar trend to that reported above for single acid:API systems. However the effect of having free chloride present in the solution is much greater than for free glycolate. This is to be expected as the collapse temperature of glycolic acid is proposed to be approximately -42°C (but it is difficult to measure as it undergoes crystallization on heating in frozen solutions). In contrast it has not been possible to measure the collapse temperature of hydrochloric acid but, as it is gaseous in its natural form at room temperature (although very soluble in water), it is expected to be extremely low.

Figure 18 - effects of glycolic acid:HCl ratio and total acid:API ratio on collapse temperature of solutions of Compound A
As hydrochloric acid (pKa -7) is a much stronger acid than glycolic acid (pKa 3.8), it will preferentially interact with the API. Hence for frozen solutions with excess of a mixture of acids the weakest acid will predominate in the free state. The effects of this can be seen in the plot above (Figure 17). When acid: drug ratio is 1.2:1 if HCl is >83% and for 1.5:1 if HCl is >67% of the HCl: glycolic acid mixture there will be free HCl in the formulation. The effects of free HCl can be seen by a rapid reduction in the Tg’ whereas, even though significant amounts of free glycolic acid will be present in some solutions when glycolic acid in a great excess, due to the weakly acidic nature and its relatively high Tg’ this has little effect on the total Tg’ of the system.
Conclusion
During the formulation of freeze dried formulations it is critical that during pH adjustments excess amounts of acid, especially HCl, should not be present in solution to avoid large decreases in the Tg’/Tc of the formulations. Due to the buffering effect of weaker acids, this may not be detected by significant changes in pH.
Acknowledgements
The authors would like to acknowledge Katarzyna Nurzyńska (Nottingham University) and Thomas Dunbar (Sheffield University) for their contributions to this work during their time at AstraZeneca, Macclesfield.
References
- Tang X., Pikal M., “Design of Freeze-Drying Processes for Pharmaceuticals: Practical Advice”, Pharmaceutical Research, 2004, 21, 191-200 2
- Liu J., “Physical Characterization of Pharmaceutical Formulations in Frozen and Freeze-Dried Solid States: Techniques and Applications in Freeze-Drying Development”, Pharmaceutical Development and Technology, 2006, 11, 3-28
- Pikal M., Shah S., “The collapse temperature in freeze drying: Dependence on measurement methodology and rate of water removal from the glassy phase”, International Journal of Pharmaceutics, 1990, 62, 165-186
- Gutz, I.G.R., Instituto de Quimica, Univesidade de Sao Paulo, Brazil. Version 3 (2008). Free download at http://www2.iq.usp.br/docentre/gutz/curtipot_.html
- Kadoya S., Izutsu K., Yonemochi E., Terada K., Yomota C., Kawanashi T., “ Glass-State Amorphous Salt Solids Formed by Freeze-Drying of Amines and Hydroxy Carboxylic Acids: Effect of Hydrogen-Bonding and Electrostatic Interactions”, Chem. Pharm. Bull. 56(6) 821—826 (2008)
- Franks, F. Freeze-drying: from empiricism to predictability. The significance of glass transitions. Developments in Biological Standardization (1992), 74(Biol. Prod. Freeze-Drying Formulation), 9-19
- Towler C., Li T., Wikstrom H., Remick D., Sanchez-Felix M., Taylor L. “An Investigation into the Influence of Counterion on the Properties of Some Amorphous Organic Salts”, Mol. Pharmaceutics, 2008, 5 (6), 946-955
Author Biography
Richard Storey is a pharmacist who has spent most of his career focusing on physical property understanding. Since 2007, he has been working as an Associate Principal Scientist in the area of formulation and process understanding for AstraZeneca with a specific focus on enabled formulations for both oral and intravenous dosing.
Jane Norris is a qualified Pharmacist with a PhD in Drug Delivery, her experience is in parenteral formulation development with a particular interest in lyophilization.
This article was printed in the November/December 2010 issue of American Pharmaceutical Review - Volume 13, Issue 7. Copyright rests with the publisher. For more information about American Pharmaceutical Review and to read similar articles, visit www.americanpharmaceuticalreview.com and subscribe for free.