Abstract
Various manufacturing platforms are often investigated during the development of a solid oral dosage form. The final selection of a manufacturing process is primarily based on ensuring critical drug product quality attributes such as physical and chemical stability, dissolution, active ingredient consistency and integrity, and ease of scalability. Powerful non-destructive analytical tools can be utilized to gain understanding about the impact that manufacturing platforms could have on several product quality parameters such as solid state purity and active ingredient spatial distribution. In this study, Near- Infrared Chemical Imaging and Raman spectroscopy were used simultaneously to understand the impact of manufacturing processes on two quality characteristics of a formulation under development, namely solid state purity and drug distribution in the dosage form. These studies provided a rapid material sparing approach to develop an optimal manufacturing platform selection for the formulation. The utilization of such non-destructive tools also provided a solid framework for ensuring a Quality by Design (QbD) development for this drug product.
Introduction
Processing Technologies
The active ingredient in this study is classified as a BCS (Biopharmaceutics Classification System) class 2 compound with low solubility and high permeability. Three manufacturing processes were evaluated to develop an optimal formulation based on rapid in vitro drug release characteristics, uniform distribution of Active Pharmaceutical Ingredient (API) and consistent polymorphic stability of API during the manufacturing process.
High Shear Wet Granulation: This granulation technology is widely used and it is often the manufacturing process of choice for formulations containing low drug dose and in some cases, for efficient incorporation of a surfactant to enhance wetting of poorly water soluble API. A high shear wet granulation process typically includes a mixing and wet massing step where the powder components of the formulation are aggressively mixed while adding a binder solution, using a high speed mixing blade and a chopper. This process often produces dense granules with a wide particle size distribution, and results in a uniform distribution of API in the granulation which are subsequently compressed into tablets.

Figure 1 - NIR spectral data of the investigated API and placebo (A. Raw Data and B. Second Derivative).
Top Spray Granulation or Fluid Bed Granulation: This manufacturing platform is the process of choice for API exhibiting physical or chemical instability in the presence of high shear rates with or without water [1]. The top spray granulation process involves incorporation of a binder solution onto a fluidized powder blend inside a granulation vessel creating liquid bridges resulting in agglomerates, followed by drying. This is a single-pot system as the granules are dried within the same unit, resulting in granules that maintain the structure of the agglomerates formed by the solid-binder bonds. The resulting granules are often fine and porous compared to the granules obtained via a high shear wet granulation process. This is primarily due to the lack of kinetic energy in the agglomeration zone resulting in light free flowing granules with an abundance of internal capillaries.
Roller Compaction/Dry Granulation: Roller compaction has become the method of choice for dry granulation as it offers all the benefits of a granulation process such as improving material flow behavior and content uniformity, while requiring no liquid binder for the densification process. In addition to process efficiency advantages, this platform requires no additional steps for solvent removal such drying (heat) and therefore, could be the process of choice for moisture sensitive or thermo-labile compounds. Roller compaction consists of the following steps: powder feeding, pre-densification, ribbon formation, and milling. During the feeding step, the powder blend is fed into two counter-rotating rolls by either gravity or force-feed screws. Once the powder material is drawn into the nip region, it rubs against the roll surface and undergoes the pre-densification process. As the material enters the roll gap, particles are deformed or fragmented to form ribbons under hydraulic pressure. The ribbons are then milled through screens (single or two stage milling) to produce granules of desired particle size distribution. The resulting granules are typically free flowing with high bulk densities [2].
Analytical Technologies
Two rapid and non-destructive techniques that are becoming important tools in development laboratories are Raman Spectroscopy and Near-Infrared Chemical Imaging (NIR-CI).
Raman spectroscopy is a fundamental vibrational spectroscopic technique complementary to mid-infrared [3], which provides chemical and physical information about the investigated matrix. It offers many advantages such as low sensitivity to water and non destructiveness. Raman also provides information about the lattice arrangements of crystals [4-6].
NIR-CI is another powerful analytical technique which provides chemical and physical information of the investigated matrix but it adds the capability of creating images which describe the spatial distribution of components in powder mixtures and/or solid dosages [7].
This article presents a case study where NIR-CI and Raman spectroscopy were simultaneously used to understand the effects of manufacturing processes on several drug product quality attributes such as API distribution and solid state stability for various formulations during development.
Experimental
Tablets were manufactured using high shear wet granulation, roller compaction and top spray fluid bed granulation processes. While the drug loading and API in the formulation remained the same across various manufacturing platforms, the excipient compositions selected were slightly different to suit the manufacturing process.
Raman Spectrometer
A Raman PhAT system was used to analyze uncoated tablets. This instrument employs a 785 nm laser diode and a CCD camera. The laser spot size of this Raman system was set to 6 mm using the appropriate optics. Instrument parameters such as laser power, exposure time and number of accumulations, were adjusted as needed in order to collect data with optimal signal to noise.
Near-Infrared Chemical Imaging System
A NIR-CI system was used during this investigation. This instrument employs an InGaAS detector focal plane array, a Quartz Halogen NIR radiation source and a wavelength discriminating liquid crystal tunable filter. The images were collected using a 31 μm spatial resolution optic. The NIR Chemical Images were created using chemical imaging analysis software. The NIR chemical images were constructed using uncoated tablet cores.
Results
NIR-CI Results
The spectral data from a formulation placebo and API were collected to determine the differences between API and excipient bands. These spectra can be found in Figure 1.
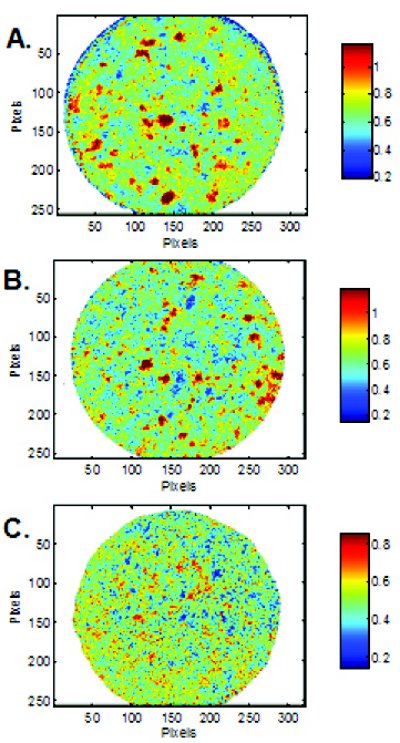
Figure 2 - NIR chemical images of the tablets manufactured using different platforms namely: A. Roller Compaction B. Fluid Bed Granulation and C. High Shear Wet Granulation.
The insert in Figure 1A shows how the powder samples were presented to the system. The triangle shaped sample corresponded to the placebo and the circle to the API. The red dotted line shows the API band used during the imaging analysis.
In order to visualize representative spectra of both API and placebo, a spectral average algorithm was applied to representative fractions of hypercube which resulted in the spectral traces depicted in Figures 1A and 1B.
After collecting the reference spectral data (API and placebo), the hyperspectra of the tablets manufactured using the investigated manufacturing platforms were obtained and their respective chemical images were created by API band intensity analysis. An example of the images created for these tablets can be found in Figure 2.
In the images depicted in Figure 2, it is evident that by using a high shear wet granulation better dispersion of the API was achieved. However, the tablet content uniformity results were acceptable for all the manufacturing process with less than 3% variability.
Secondary batches of tablets were manufactured and analyzed by NIR-CI in the same fashion to confirm these results.
Raman and NIR Spectroscopy Solid State Investigation
In order to determine if the reason behind the better spatial distribution of the API for the high shear wet granulated tablets was purely mechanical or molecular; tablets manufactured using the investigated platforms were analyzed using Raman spectroscopy. When reviewing the Raman spectral data in the aromatic region it was evident that the high shear wet granulation process had induced an API solid state transformation. Tablets manufactured via roller compaction and fluid bed granulation did not show such transformation Figure 3. None of the excipients used in these formulations had Raman signal in the aromatic region, thus it was concluded that these changes were due to API changes only. Because of previous knowledge and further experimentation, it was possible to identify which solid state transition occurred during high shear wet granulation.

Figure 3 - Raman spectral data of the tablets manufactured using different platforms.
After concluding that a solid state transition occurred during high shear wet granulation a second investigation was carried out. During the second study we wanted to determine if changes in the NIR spectral signature of the undesirable solid state could have been influencing the NIR chemical imaging observations. During this simple investigation ,the NIR spectral data of the undesirable solid state was collected and compared to the desirable form in the region which was used to create the chemical images, Figure 4. The traces of both forms exhibit a similar band in the same region which was used to create the NIR chemical images. Also, both bands exhibit enough band resolution from the major excipients (not shown) thus one should be able to determine a non-homogeneous API distribution even after the solid state transition.
Conclusion
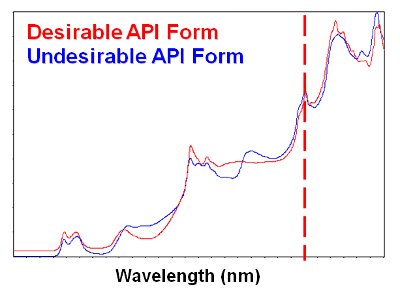
Figure 4 - Near-Infrared spectra of the desirable and undesirable API forms.
NIR-CI was a useful method to determine spatial distribution of API in tablet formulations. NIR-CI was successfully used as a nondestructive tool to discriminate manufacturing platorms. Analysis showed that tablets manufactured via high shear wet granulation presented better API spatial distribution than tablets produced by a roller compaction or a top spray fluid bed granulation processes. The same tablets analyzed by Raman spectroscopy showed that the high shear wet granulation process promoted an undesirable solid state transition. Further experiments indicated that this transformation was primarily due to a combination of the increased solubility of API in the binder promoted by a high degree of shear imparted during the process. This could be a solvent driven transition resulting in a better spatial distribution of the API during the high shear granulation process. Such solid state tranformation was not detected in the solvent-free roller compaction granulation process or the low shear fluid bed manufacturing process.
This study shows the advantages of using non-invasive techniques such as Raman and NIR-CI synergistically during product development. These methods can be used as valuable tools for rational manufacturing platform selection during development. Furthermore, the utilization of such non-destructive methods also could provide a framework for ensuring a Quality by Design (QbD) drug product development.
References
- Parikh, D.M., J.A. Bonck, and M. Mogavero, eds. Handbook of Pharmaceutical Granulation Technology. Drugs and the Pharmaceutical Sciences. 1997. 227-302.
- He, X., Application of Roller Compaction in Solid Formulation Development. American Pharm Review. 6 (3): p. 26-33.
- Nafie, L.A., Theory of Raman Scattering, in Handbook of Raman Spectroscopy, G.M.E. Howell, Editor. 2001, Marcel Dekker. p. 1.
- Taylor, L. and G. Zografi, The Quantitative Analysis of Crystallinity Using FT-Raman Spectroscopy. Pharm Res, 1998. 15: p. 755-761.
- Romero-Torres, S., et al., Monitoring of Mannitol Phase Behavior during Freeze-Drying Using Non-Invasive Raman Spectroscopy. PDA J Pharm Sci Technol, 2007. 61: p. 131-146.
- Romero-Torres, S., J. Huang, and P. Hernandez, Practical considerations in PAT analyzer selection: NIR vs.Raman. American Pharm Review, 2009.
- Clarke, F., Extracting process-related information from pharmaceutical dosage forms using near infrared microscopy Vibrational Spectroscopy, 2004. 34(1): p. 25-35.
Author Biographies
Dr. Saly Romero-Torres is currently working as PAT project manager at Pfizer Pharmaceuticals. She holds a PhD in Analytical Chemistry which she completed at Purdue University (West Lafayette, IN) in 2006. Her dissertation title is “Raman and Chemometrics for Pharmaceutical Process Analysis”. Before joining Pfizer (legacy Wyeth), she worked at Schering-Plough Pharmaceuticals as a spectroscopist in a physical characterization team. At Schering Plough, she developed new spectroscopic (IR, NIR and Raman) and chemometrics based analytical methods aimed to characterize and understand chemical and physical attributes that were critical to the quality of pharmaceutical materials.

Dr. Rina Chokshi has over 10 years of experience in formulation and process development. Rina has worked on the development of conventional as well as novel dosage forms, including solid dispersions such as hot-melt extrusion, spray-drying and co-precipitation as well as controlled release formulations. She earned her Ph.D. from the University of Rhode Island in collaboration with Hoffman-La Roche, and went on to work for Wyeth (now Pfizer) on formulation and process optimization using Quality by Design (QbD) approaches.

Dr. Jun Huang is currently working as a PAT project manager with Pfizer Global Supply located in Peapack, NJ. His primary responsibility is to implement QbD/PAT in pharmaceutical manufacturing. Prior to joining Pfizer/Wyeth, he worked at GlaxoSmithKline, PerkinElmer, and CAMO. He received his PhD in chemometrics from the Norwegian University of Science and Technology in Norway, 2001, with Prof. Kim Esbensen, a M.Sc and a B.Sc from China. His experience and interests involve chemometrics, multiple analytical techniques, and advanced process control (APC).

Dr. Mahesh Krishnan is an Associate Research Fellow at Pfizer Pharmaceutical Research & Development located in Groton, CT. He leads a team of scientists responsible for late-stage drug product development including technology transfer to the commercial manufacturing sites. Mahesh is experienced in the area of formulation and process development of immediate and controlled release oral solid dosage forms, combination products, liquid/semi-solids, and biotech/drug delivery products across diverse manufacturing platforms. He has held various leadership roles in cross-functional global product development teams, executing formulation and process development strategies, scale-up, manufacture of clinical and registration/validation batches, regulatory submissions, technology/ knowledge transfer via traditional and QbD paradigms for New Products as well as Life-Cycle Management projects. Mahesh has a Bachelor’s degree in Pharmacy and a Master’s degree in Pharmaceutics from the University of Mississippi. He received his Ph.D. in Pharmaceutics from the University of Iowa.
This article was printed in the November/December 2011 issue of American Pharmaceutical Review - Volume 14, Issue 7. Copyright rests with the publisher. For more information about American Pharmaceutical Review and to read similar articles, visit www.americanpharmaceuticalreview.com and subscribe for free.