Abstract
As Real Time Release testing (RTRt) of solid dosage forms is sought, it is necessary to understand and mitigate challenges that might hinder successful implementation of spectroscopic methods. For compressed tablets one such challenge has been to account for the elastic recovery that occurs after tablet compression since tablets used for calibration and validation purposes may have been manufactured in the past and undergone full elastic recovery while the tablets for routine application will be right off the press and may be in various states of elastic recovery. With the tablet dimensions changing, characterizing the tablet with NIR is analogous to hitting a moving target. The current studies employ a model formulation, the majority of which is micro-crystalline cellulose (MCC) which is well known to undergo elastic recovery following compression. NIR spectra were collected during the early stages of elastic recovery and assessed for their predictive capability against a quantitative diffuse reflectance NIR method. This article will describe some of the work performed to understand elastic recovery and its impact on the successful implementation of NIR methods for RTR.
Introduction
With the introduction of process analytical technology (PAT) and Quality by Design (QbD) initiatives there is increasing interest in the ability to non-destructively assess the manufacturing processes used to prepare pharmaceutical products, both from a process understanding perspective and also a quality control point of view [1]. Near-Infrared Spectroscopy (NIR) is a common non-destructive technique that has gained significant acceptance in the pharmaceutical industry for in-process understanding. NIR has been used in a variety of applications including on-line blend monitoring, moisture content during fluid bed drying, granulation and tablet potency [2-5].
An underlying complication with NIR spectroscopic analysis of materials is that the spectral features not only contain information directly linked to the chemical composition but also to the physical attributes of the materials. The physical information has however been successfully used to determine a variety of properties, including sample particle size and sample density [6, 7]. Both of these attributes are directly linked to the pathlength that the light appears to travel through the sample. In diffuse reflectance NIR, the relationship between density and pathlength has been exploited for predicting roller compacted ribbon density and tablet compression for tablet hardness respectively [3, 8].
During the development of robust NIR spectroscopic methods used for the prediction of tablet ingredients content, calibration tablets must be prepared of varying physical and chemical attributes. From these calibration tablets, calibration models are typically built that will allow for a Partial Least Squares (PLS) regression to quantitatively predict either chemical and physical attributes as required. Most often, the quantitation of chemical ingredients is related to the spectra through the use of the Beer-Lambert Law (Equation 1).
A=elc Eq.1
Where l is the path-length, e is the molar absorption coefficient and c is the concentration of ingredient of interest. In general, the Beer-Lambert Law only holds for dilute solutions where the components are uniformly distributed within the sampling area and there is no optical scattering from the samples. In particulate solids, this is clearly not the case and the scattering changes the effective pathlength. For samples that are fully relaxed, the effective path-length is considered to be fixed and can be estimated through the tablet dimensions.
In a meaningful RTRt strategy, NIR predictions of tablet potency will take place immediately after the tabletting process. After the compression phase of tablet compression, many pharmaceutical materials undergo viscoelastic recovery, also known as strain recovery [9, 10]. Post compression strain recovery is a dynamic process during which physical attributes of the compacted materials are changing. During the process of strain recovery, the tablet dimensions increase and the internal porosity of the material is increased. Using the Voigt-Kelvin mechanical model (Equation 2) [11] as a guide of strain recovery, it is found that the porosity asymptotically recovers with time [9].
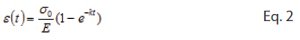
Where ε is the time dependant porosity, σ0 is the initial stress on the system, E is the Young’s Modulus, k is a rate constant of decay and t is time. Porosity is approximately inversely related to density and correspondingly the tablet density will exponentially reduce with time. In an elastically recovering system, dynamic changes in path-length may adversely affect the NIR model predictability. The challenge is to understand the degree and rate of change in path-length resulting from elastic recovery. This raises an interesting problem when attempting to predict the quantity of active ingredient in the tablet and is analogous to hitting a moving target.
The work described herein illustrates the effect of elastic recovery after tablet compression on the prediction of NIR values. For real-time at-line NIR based analysis to be successful, the spectroscopic model must account for the dynamic physical changes of the tablets. Tablets were manufactured with varying composition and density. The selected model formulation contains micro-crystalline cellulose (MCC), which is well known to undergo post-compression strain recovery [12]. From the spectra collected on these well characterized, fully relaxed tablets, two methods were derived. One method was used to capture the post-compression dynamic change in tablet density. The second spectroscopic routine was developed to predict the concentration of API in the dynamically changing density environment of the tablets. Using this framework, determination of the time evolution of compact density is possible but for the current communication, the task will be to rid the spectra of the dynamic information and arrive at a constant API prediction.
Materials and Methods
Materials
Microcrystalline cellulose and Granular Acetaminophen were used as received from the manufacturer.
Tablet Manufacture and Characterization
Physical mixtures of gravimetrically dispensed acetaminophen (APAP) and MCC were prepared for tablet preparation at 0, 15, 30, 45, 60, 75 and 100% APAP loading. Cylindrical compacts were prepared from the blends using standard round flat-faced tooling. For each tablet, approximately 1cm3 of blend was loaded into the die. Compression took place using a manual hydraulic press at the specified force. The tablets to be used in the prediction of APAP content were compressed at 155 MPa (n=5). Tablets of varying density were prepared under varying pressures (77, 116, 155, 232, 310 and 387 MPa). After a period of 3 days, the resulting tablets were weighed and the physical dimensions were recorded. From this information, the density of the tablets was calculated.
Static Spectral Collection and Model Development
Near-infrared spectra were collected on the relaxed tablets in diffuse reflectance mode using a Fourier-Transform Near-Infrared (FT-NIR) spectrometer. One spectrum was collected from a single side of each tablet. Each spectrum was the average of 32 scans spanning the range between 10,000 and 4,000 cm-1 with a spectral resolution of 8 cm-1. From the data, two models were derived. In order to predict the concentration of APAP in the formulation while the density of the tablet is changing, spectroscopic pre-treatments took place to eliminate the density information from the spectra. The spectral range used for developing the model spanned 9,033cm-1 to 8,541cm-1. Pretreatments included the application of multiplicative scatter correction followed by mean centering of the spectra. After the first two pretreatments a second derivative with 7/3 Savitzky-Golay smoothing was performed. Interested readers are directed to the work of Huang et.al. for a recent review of spectral pretreatments [13]. A second model was derived by measuring the spectral slope throughout the range of 10,000 to 4,000 cm-1. The determined slopes were then correlated to their respective densities. A third order polynomial was fit to the density-slope data to back-calculate the tablet density with constant composition.
Post-Compression Spectra Collection
To capture the dynamic post-compression relaxation process, a workflow was designed to collect spectra for a period of up to 25 hours. The workflow was divided into 2 segments. A first collection loop collected spectra with a 30 second pause in between acquisitions which allowed for heavy sampling of the recovery process early on while it was rapidly changing. A second collection loop paused for two minutes between spectra collection which allowed for the extended collection time. At the initial setup the spectrometer was placed into a pause mode to allow instantaneous collection of the first spectrum. During the pause, the tablet was manufactured and immediately placed on the integrating sphere and the workflow was resumed. Spectra were continuously collected as dictated by the workflow until the prescribed time had elapsed.
Results and Discussion
Static Spectral Results from Prepared Tablets

Figure 1 - Normalized APAP Spectra collected from compositionally varied calibration tablets; inset illustrates API spectral range used in model development
The spectra collected on the calibration tablets for the prediction of the composition of APAP within a tablet is provided in Figure 1. The resulting model employed one factor and had an RMSEP of 7.95 % w/w.
In addition to the full spectral range, the inset shows the spectral range used in the derivation of the model which clearly illustrates well-defined absorbance differences with compositional variation. Although gravimetric weights of the blend composition were used to build the model, the model could be further refined using an orthogonal method such as high-performance liquid chromatography.

Figure 2 - Spectral response from density varied calibration tablets
The spectra acquired from the tablets of varying density have been provided in Figure 2. As the hardness increases, there is a corresponding increase in the absorbance at low wavenumber. The change in absorbance as the density of the sample changes is dependent on the wavenumber. The slope of the linear regression best fit line through the spectra has been calculated to grasp the wavenumber density dependence. Owing to this phenomenon the spectral slope was determined to be density dependent (Figure 3). By fitting a third order polynomial to the density-spectral slope results, it is possible to back-calculate the tablet density from any future spectra from tablets of unknown density.
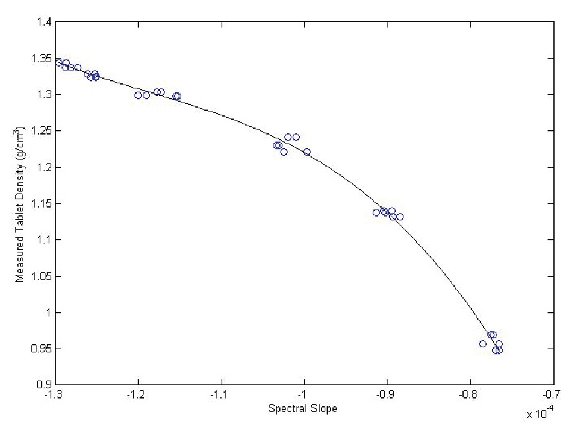
Figure 3. Calibration Curve: Compact density and corresponding spectral slope
Dynamic Spectral Results from Compressed Tablets
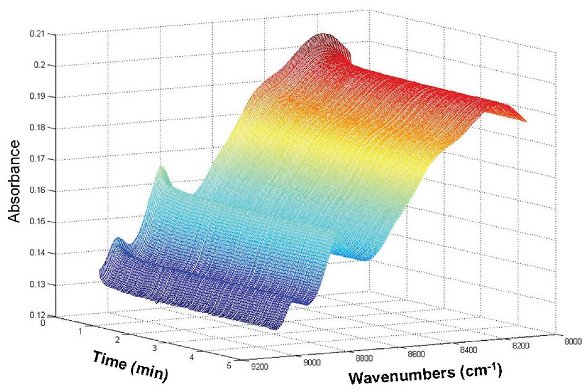
Figure 4 - Capturing the time dependent change in postcompression tablet spectra
Figure 4 represents the time dependent spectra collected on a single tablet over a period of time. The first spectrum was collected moments after the tablet was ejected from the die. The dynamic change in spectral absorbance is clearly non-linear with more marked relaxation early in the process. From the dynamically captured spectra the tablet density and the APAP concentration were determined and Figure 6 illustrates the differences in each metric. The tablet density changed from 1.323 g/cc down to 1.297 g/cc; an approximate reduction in tablet density of ~ 2 %.
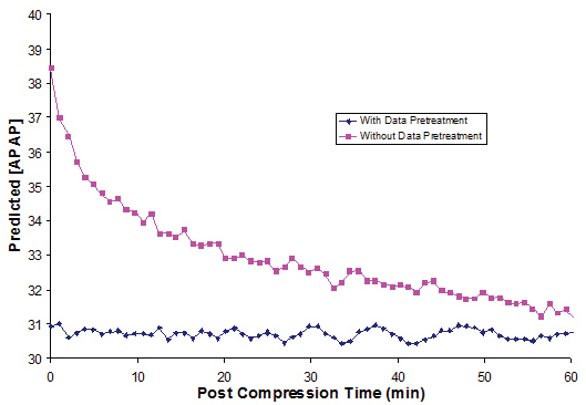
Figure 5 - Prediction of APAP using model with and without spectral pretreatment
The results illustrate that the change in density after compression can be verified for this system using NIR. The results also indicate that it is possible to remove the dynamic density change for the prediction of APAP content in the current system. Using pretreatments, the prediction of APAP is possible in a dynamically changing matrix. Figure 5 represents predictions derived from a model for APAP that did not include any normalization compared to pretreated spectra. Significant correlation of untreated spectral predictions to the change in density is evident, highlighting the importance of normalization steps to correct spectra.

Figure 6 - Time dependent decay of post-compression tablet density and the resulting NIR prediction of tablet composition
Conclusions
The results reported illustrate that near-infrared spectroscopy is sensitive to changes in tablet density following tablet compression. The current work provides evidence that NIR can be used to monitor the elastic recovery process of newly compressed tablets. NIR can be used as a tool to capture post-compression strain recovery. This shows for the first time that it is possible to predict the content of API in the face of changing tablet density. With a change in tablet dimensions, spectral pretreatments can be applied to the collected spectra to derive predictions of API content.
The spectroscopic methods that have been proposed can be employed to provide physical information of tablets immediately following compression and utilized to help in formulation and process understanding. As an example, this tool could be potentially useful in the determination of the rate coefficients of elastic recovery and hence demonstrate that tablets were fully relaxed prior to coating.
References
- Tabasi, S.H., Fahmy, R., Bensley, D., O’Brien, C., Hoag, S.W.,
- Quality by design, part I: Application of NIR spectroscopy to monitor tablet manufacturing process. Journal of Pharmaceutical Sciences, 2008. 97(9): p. 4040-4051.
- Bellamy, L.J., A. Nordon, and D. Littlejohn, Real-time monitoring of powder mixing in a convective blender using non-invasive reflectance NIR spectrometry. The Analyst, 2008. 133(1): p. 58-64.
- Gupta, A., Peck, G.E., Miller, R.W., Morris, K.R., Real-time nearinfrared monitoring of content uniformity, moisture content, compact density, tensile strength, and young’s modulus of roller compacted powder blends Journal of Pharmaceutical Sciences, 2005 94(7): p. 1589-1597.
- Findlay, W.P., G.R. Peck, and K.R. Morris, Determination of fluidized bed granulation end point using near-infrared spectroscopy and phenomenological analysis. Journal of Pharmaceutical Sciences, 2005. 94(3): p. 604-612.
- Gottfries, J., Depui, H., Fransson, M., Jongeneelen, M., Josefson, M., Langkilde, F. W., Witte, D. T., Vibrational spectrometry for the assessment of active substance in metoprolol tablets: A comparison between transmission and diffuse reflectance near-infrared spectrometry. Journal of Pharmaceutical and Biomedical Analysis, 1996. 14(11): p. 1495-1503.
- Frake, P., Gill, I., Luscombe, C.N., Rudd, D.R., Waterhouse, J., Jayasooriya, U.A., Near-infrared mass median particle size determination of lactose monohydrate, evaluating several chemometric approaches. The Analyst, 1998. 123: p. 2043-2046.
- Ebube, N., Thosar, S., Roberts, R., Kemper, M., Rubinovitz, R., Martin, D., Reier, G., Wheatley, T., Shukla, A., Shukla, Atul., Application of Near-Infrared Spectroscopy for Nondestructive Analysis of Avicel® Powders and Tablets. Pharmaceutical Development & Technology, 1999. 4(1): p. 19.
- Kirsch, J.D. and J.K. Drennen, Nondestructive tablet hardness testing by near-infrared spectroscopy: a new and robust spectral best-fit algorithm. Journal of Pharmaceutical and Biomedical Analysis, 1999. 19(3-4): p. 351.
- Rippie, E.G. and D.W. Danielson, Viscoelastic stress/strain behavior of pharmaceutical tablets: Analysis during unloading and postcompression periods. Journal of Pharmaceutical Sciences, 1981. 70(5): p. 476-482.
- Duberg, M. and C. Nystrom, Studies on Direct Compression of Tablets. Acta Pharmaceutica Suecica, 1982(19): p. 421-436.
- Lachman, L., H.A. Lieberman, and J. Kanig, The Theory and Practice of Industrial Pharmacy. Third Edition ed. 1986: Stipes Publishing, L.L.C,. 902.
- Haware, R.V., I. Tho, and A. Bauer-Brandl, Evaluation of a rapid approximation method for the elastic recovery of tablets. Powder Technology. 202(1-3): p. 71-77.
- Huang, J., S. Romero-Torres, and M. Moshgbar, Practical Considerations in Data Pre-treatment for NIR and Raman Spectroscopy. American Pharmaceutical Review, 2010. 13(6): p. 116-127.
Author Biographies
Kevin Macias received a BS in Pharmacy from the St. Louis College of Pharmacy in 2003 and a Ph.D. in Industrial and Physical Pharmacy from Purdue University in 2008. While earning his Ph.D., Kevin was awarded the Schering-Plough Science and Innovation Award and the Graduate Student Award for Outstanding Teaching. In 2008, Kevin joined Bristol-Myers Squibb in New Brunswick, NJ and has developed characterization techniques as well as spectroscopic applications to further the understanding of solid oral dosage form manufacture. His research interests are in the areas of spectroscopy, wet granulation and tablet compression. Kevin has received multiple awards at BMS for his contributions, most recently the Chemistry Leadership Award in 2011.
Dimuthu Jayawickrama earned his B.S. in Chemistry from University of Peradeniya, Sri Lanka and Ph.D. in Chemistry from University of Kansas, Lawrence, KS. Before joining, BMS, he worked as a postdoctoral researcher at the University of Illinois, Urbana-Champaign, IL and a senior lecturer, University of Peradeniya, Sri Lanka. At present, Dimuthu works as a senior research investigator at BMS, within analytical research and development.
Gary McGeorge received his Ph.D. in solid-state NMR spectroscopy at Durham University in England (1996) while sponsored by Zeneca Specialties for the analysis of polymorphic dyestuffs. He then held a Post Doctoral position at the University of Utah Chemistry department that involved method development, in particular for the analysis of pharmaceutical and natural products. Currently, he is a Principal Scientist within the Research and Development organization at Bristol-Myers Squibb, where he has worked for the last 13 years. During this time he has been responsible for the analysis of polymorphs within solid pharmaceuticals (both as isolated components and formulated products) using various spectroscopic tools (IR, NIR, Raman and ssNMR); identity testing of raw materials and finished product. Most recently he is one of the technical leads for the designing and developing PAT control strategies for drugs with BMS. His research interests center on using spectroscopy to understand and characterize key attributes of materials and how they determine the performance of a product. He has 16 publications in the literature and is on the editorial advisory board for Spectroscopy magazine.
This article was printed in the November/December 2011 issue of American Pharmaceutical Review - Volume 14, Issue 7. Copyright rests with the publisher. For more information about American Pharmaceutical Review and to read similar articles, visit www.americanpharmaceuticalreview.com and subscribe for free.