Abstract
Potentiometric titration is a common laboratory method for quantitative chemical analysis that is routinely used in the pharmaceutical industry. Typically, up to several hundred milligrams of sample is required for accurate titration of a pharmaceutical compound, depending on its molecular weight and number of titratable functional groups. However, such large amount of material is often difficult to obtain in the early stages of drug discovery and development. There is a need to scale down the titration method with minimal amount of material. In this report, we introduce a practical microtitration method that offers the same function and accuracy of the traditional titration using only 5-10 milligrams of sample. Acceptable linearity, reproducibility, robustness and selectivity of the method are demonstrated as well.
Introduction
Potentiometric titration is a common laboratory method for quantitative chemical analysis. In the pharmaceutical industry, titration has been widely used as the weight percent assay for small-molecule active pharmaceutical ingredients (APIs), intermediates, and raw materials. [1-5] Other applications of potentiometric titration include determination of salt ratio, pKa [6] and ionization state [7] of a drug compound, which are important attributes for drug candidate selection and development. Recently, Du-cuny et.al have successfully implemented potentiometric titration for monitoring the crystallization process of APIs [8]. Titration has also been employed to measure the binding constants between metal cations and small molecule drugs [9-10].
In modern analytical laboratories, automatic titrators with potentiometric end point determination are routinely used for acid-base and other type of titrations. With a conventional potentiometric titration instrument set up, 1 mmol (~400-500 mg assuming the MW ~400-500 dalton) of materials is generally needed for an accurate quantitation. In the early stages of drug discovery and development, such large amount of samples are often difficult to obtain, and thus conventional titration techniques are rarely used. High performance liquid chromatography (HPLC) is an alternative, however, well characterized reference standards are required which are typically not readily available until the later stage of drug development. NMR can also be used for quantitative analysis, however, it tends to be time-consuming and requires expensive equipment and special training. Consequently, it is highly desirable to develop a simple and accurate microtitration method using smaller amount of materials for quantitative analysis in the stages of drug discovery and early development. Ideally, the method should require 0.01 mmol (4-5 mg assuming the MW is 400-500 dalton) of materials and should be implemented using existing commercial titrators. In this report, we will introduce the development and validation of an acid-base microtitration method using conventional potentiometric titrators and a micro-electrode for titration of drug compounds at 0.01 mmol scale. This method is applicable to a large number of pharmaceutical compounds that are titratable by the conventional method including weak acids and weak bases. The factors that affect the accuracy and precision of the microtitration method, as well as the method selectivity, reproducibility and robustness will be discussed.
Experimental
An automated titrator was used in this study. For conventional titrations, a 12 mm diameter glass pH electrode and a 20 mL burette were used. For the microtitration, a 3 mm diameter microelectrode and 1 mL burette were adapted. The titrants used in this study were standardized based on USPNF guidelines. All titrations were performed using the dynamic equivalence point titration (DET). The fi rst derivative of the rate of change of the potential measured against the volume added was used to determine the end points.
Sample Preparation
Seven API molecules were used in the micro-titration method development and validation. They are referred as Compound A, B, C, D, E, F and G respectively. All sample weighing was performed on a micro-balance with accuracy of +/- 0.02 mg. The diluents consist of mixtures of acetonitrile and water (50:50, v/v) or methanol and water (40:60, v/v), depending on the solubility of the compound. The relative error was expressed as the percentage difference of the measured microtitration values against the conventional measurements.
Titration Methods Parameters
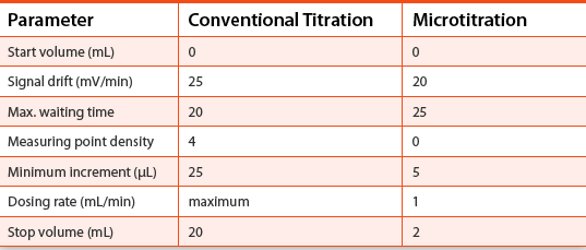
The key parameters for the titration method used are listed in the Table 1.
Table 1 - Key parameters for titration methods
Results and Discussions
Method Development
Compound A, a weak base with molecular weight of 444.573 dalton and pKa about 8.0 was selected as the model compound for the method development. With a conventional automatic potentiometric titrator, 444.2 mg Compound A was dissolved in 50 mL diluent (8.884 mg/mL) and titrated with 0.1 N HCl. The end point was determined to be 9.9479 mL as shown in Figure 1. The weight percent of the sample was calculated to be 100.4%. Using the same instrument set up, a sample of 4.60 mg of compound A, representing a 100-fold reduction in sample size, was dissolved in 50 mL diluent (0.092 mg/mL) and titrated with 0.01 N HCl. Titrant with lower concentration is needed for yielding a volume at the end point that can be accurately measured. A titration curve with a much shallower slope near the end point was observed, as shown in Figure 2. The end point was determined to be 0.9832 mL and the weight percent was calculated to be 95.0%, which is 5.4% lower than the result obtained at the 8.884 mg/mL sample concentration. Increasing the sample concentration to 1.014 mg/mL by reducing the diluent volume by 10 folds (5.07 mg Compound A in 5 mL diluent) but keeping the titrant concentration at 0.01 N HCl yielded a fairly improved titration curve with a steeper slope near the end point (1.1642 mL), as shown in Figure 3. However, the calculated weight percent from Figure 3 is still deviated from the result obtained at the 8.884 mg/ml concentration by 2.0 %.
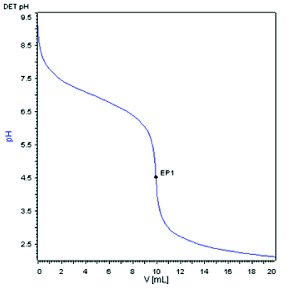
Figure 1 - Normal electrode, 0.1N HCl, 8.884 mg/mL sample concentration.
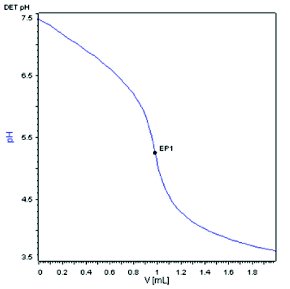
Figure 2 - Normal electrode, 0.01N HCl,0.0892 mg/mL sample concentration.
The decreased accuracy for the titrations at lower sample concentrations is not at all surprising. First, the slope of a titration curve near the end point is directly related to the sample concentration [11]. In Figure 2, the much lower sample concentration yielded a very shallow slope near the end point, which made end point determination less reliable. Secondly, when a weak acid or base is titrated by a strong base or acid titrant, the end point detected normally does not coincide with the equivalence point (true end point). The product formed by a weak acid with a strong base titrant is normally basic, and the product formed by a weak base with a strong acid titrant is normally acidic. The protolytic reaction between the solvent and the acidic or basic titration product creates the difference between end point and equivalent point [12]. This error is inversely proportional to the sample concentration. At regular sample concentration of 0.02 M (8.884 mg/mL), the error is negligible. However, at lower sample concentrations, this error beomes magnified.
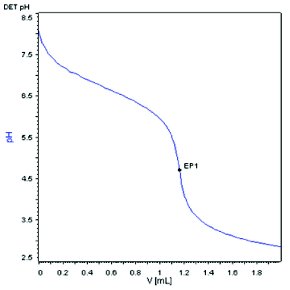
Figure 3 - Microelectrode, 0.01N HCl, 1.014 mg/mL sample concentration.
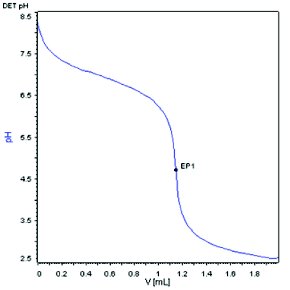
Figure 4 - Microelectrode, 0.01N HCl, 5.2 mg/mL sample concentration.
To minimize the concentration related experimental errors as described above in microtitrations, it is critical to maintain sample concentrations in a similar range as used in conventional titrations. Therefore, to achieve the goal of reducing the sample amount from 1 mmol scale to 0.01 mmol scale for a microtitration, the diluent volume needs to be reduced accordingly from 50-100 mL to around 1 mL. With such a small sample solution volume, microelectrodes need to be used to fit in the solutions properly for pH measurement. Figure 4 showed the titration curve from titration of 5.2 mg of compound A in 1 mL diluent by 0.01 N HCl on a conventional titrator with a microelectrode (3 mm in diameter). The slope of titration curve near the end point was similar to what was observed in Figure 1 for a conventional titration with 100-fold higher sample amount. The end point was measured at 1.1843 mL, which is within the allowable range for accurate determination of titrant volume by the titrator. The weight percent was calculated to be 101.3% in this microtitration experiment, which is comparable to the value obtained by the conventional titration (0.9% deviation).
The microelectrode can be used directly with commercial acid-base titrators without modification of the instruments. The small size of the microelectrode allows for reduction of the sample solution volume from 50 mL to around 1 mL while maintaining the sample concentration roughly in the same range with the 100-fold reduction in sample size. As shown in Figure 4, this approach was successful in maintaining acceptable accuracy of the weight percent based on acid-base titration using only ~5 mg of material. The microtitration method has been implemented in our laboratory for routine acid-base titration of drug compounds with 2-10mg sample size.
Reproducibility and Robustness
Table 2 - Reproducibility and robustness
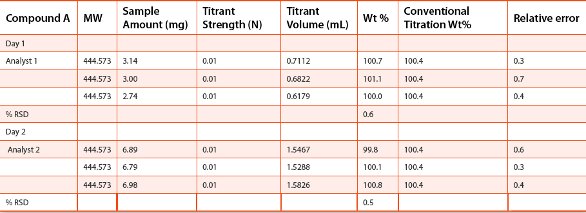
The reproducibility of the microtitration method was assessed by repeating the experiments for Compound A as described in Figure 4 with triplicate sample preparations. The robustness of the method was assessed by two different analysts performing the same experiments on two different days. The results are shown in Table 2. The %RSD values for the calculated weight percent results from the triplicate titrations was 0.6% and 0.5%, respectively for Analyst 1, Day1 and Analyst 2, Day2. For all the microtitration experiments, the deviations of the calculated weight percent results from that of the conventional titration are all within 1.0%. The results as shown in Table 2 demonstrated acceptable reproducibility and robustness of the microtitration method for quantitative analysis of drug compounds in the early stages of drug discovery and development.
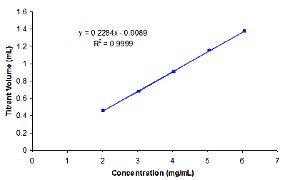
Figure 5 - Linearity of the micro-titration method for Compound A.
Linearity
The linearity of the microtitration method was evaluated for Compound A in the range from 40% to 120% of the target concentration (5 mg/mL). The method was determined to be linear over the entire concentration range with a correlation coefficient equal to 0.9999, as shown in Figure 5.
Accuracy of Microtitration for Other APIs
Table 3 - Conventional vs. microtitration on basic APIs
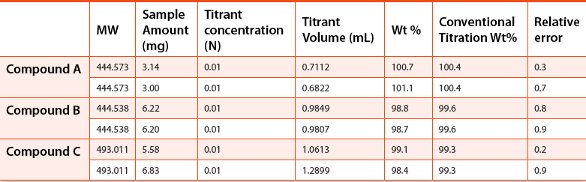
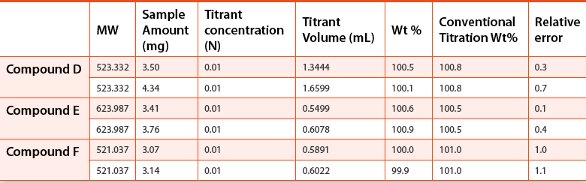
In addition to Compound A, the accuracy of microtitration method was evaluated for 2 other basic APIs and three acidic APIs synthesized in house. 3-7 mg of each compound (duplicate sample preparations) was dissolved in 1 mL diluent, and then titrated with 0.01 N acidic or basic titrant (HCl or NaOH). The results were then compared to those obtained with the conventional titration method using ~500 mg material and 0.1 N titrant. The deviations of the calculated weight percent results from the microtitrations were calculated against the values from the conventional titrations. The results are summarized in Table 3 and Table 4. All the deviations were within 1.1% and considered acceptable for the API samples evaluated.
Table 4 - Conventional vs. microtitration on acidic APIs
Indirect Salt Ratio Determination

Figure 6 - Indirect salt ratio determination of Compound G by microtitration.
Salts of APIs have often been prepared in drug discovery and development because of improved properties with respect to solubility, stability, or bioavailability. Determination of the salt ratio is critical for drug characterization. Acid-base microtitration can be used as an indirect way for salt ratio determination with small amount of materials. In the experiment shown in Figure 6, 4.64 mg of HCl salt of Compound G was titrated by 0.01 N NaOH using the microtitration method as described above. The free base molecule of Compound G has four basic sites that can be protonated when it is treated with HCl. The predicted pKa values of the tetra-HCl salt with the four basic sites fully protonated are 3.0, 3.5, 6.2, and 9.4 [13]. The titration curve showed three distinct end points at 0.9888 mL, 1.5314 mL, and 2.0969 mL. The first end point corresponds to neutralization with the first and second protonated basic sites, for which the titration end points can not be differentiated due to their very close pKa values (3.0 and 3.5 respectively). The second and third end points correspond to neutralization of the third and fourth protonated basic sites with predicted pKa value at 6.2 and 9.4 respectively. The distinctively shaped titration curve is consistent with what is expected from base titration of a tetra-protonated salt of Compound G based on the predicted pKa value, and thus indirectly proved that the HCl salt sample evaluated is indeed a tetra-protonated salt of Compound G, presumably a tetra-HCl salt.
Conclusions
An acid/base based potentiometric microtitration method using materials at 0.01 mmol scale was developed and validated. The method is established using an existing commercial titrator with a microelectrode and a 10-fold lower titrant concentration. Excellent accuracy on weight percent with less than 1.1% deviations from conventional titrations was demonstrated for both acidic and basic drug compounds. The method was shown to be linear in the range of 40% to 120% of the target concentration with acceptable reproducibility and robustness. An indirect salt ratio determination for an API salt was also attempted using the microtitration method and the theoretical tetra salt ratio was confirmed.
References
- R.V. Rele and R.H.Terse J. Chem. Pharm. Res. 3 (2011), 1-5.
- S.M. Al-Ghannam and A.M. Al-Olyan J. Food Drug Anal. 13 (2005), 295-300.
- A.K. Nazer, M. Mohideen, A.R. S. Hameed and R. Patel Chem. Pharm. Bull. 52 (2004), 38-40.
- A.M. Abulkibash, S.M. Sultan, A.M. Al-Olyan and S.M. Al-Ghannam Talanta 61 (2003), 239-244.
- X.H. Qi, R. B. Miller, Y. Namiki, J. Zhang and R. Jacobus J. Pharm. Biomed. Anal. 16 (1997), 413-418.
- A. Avdeef and J. E. Comer Trends QSAR Mol. Modell. 92, (1993), 386-387.
- C. Demicheli, T.L. de Figueiredo, S. Carvalho, R.D. Sinesterra, J.C. Lopes and F. Frezard Biometals 12 (1999), 63-66.
- L. Du-Cuny, J. Huwyler, H. Fischer and M. Kansy Int. J. Pharm. 342 (2007), 161-167.
- S.C. Wallis, B.G. Charles, L.R. Gahan, L.J. Filippich, M.G. Bredhauer and P.A. Duckworth J. Pharm. Sci. 85 (1996), 803-809.
- M.A. Kline and C. Orvig Clin. Chem. 38 (1992), 562-565.
- G.D. Christian Analytical Chemistry, John Wiley & Sons 1994 New York, 227-233.
- W. Huber Titrations in Nonaqueous Solvents, Academic Press 1967 New York and London, 22-27.
- Calculated using Advanced Chemistry Development (ACD/Labs) Software V11.01 (© 1994- 2011 ACD/Labs)
Acknowledgements
The authors would like to thank Dr. Christopher Welch and Ms. Yadan Chen for review and helpful discussions.
Author Biographies
Yong Liu obtained a Ph.D. degree in Organic Chemistry from Rutgers, the state University of New Jersey. He has been with Merck in the Analytical Chemistry Department for ten years. His current role is to provide analytical support for chemistry scale up on small molecule pharmaceuticals from lead optimization stage through Phase IIB.
Tim Nowak is an analytical chemist at Merck in the Analytical Chemistry Project Support group. His recent work at Merck has been focused with developing analytical procedures to support early and late stage chemistry development. He has a B.S. in Chemistry from the Pennsylvania State University and is currently pursing a M.S. in Chemistry from Stevens Institute of Technology.
Jolanta Plewa has been with Merck since 2004. As an analytical chemist, her worked focused on developing analytical methodologies in support of early and late drug development. Jolanta currently holds a position in the Global Project Management department within Merck currently. She received her B.S. in Chemistry from Montclair State University, M.S. in Chemistry and Certifi cate in Regulatory Aff airs from Lehigh University.
Xiaoyi Gong obtained a Ph.D. in Analytical Chemistry from Iowa State University in 2000. He joined Merck Research Laboratories (MRL) at Rahway as a Senior Research Chemist in 2000. His current role is the Project Analytical Chemistry/Screening and High-throughput Analysis lead in the DPS Analytical Chemistry Department.