Department of Drug Product Development
Abstract
This work focused on the assessment of the capability and suitability of several spectroscopic techniques for detecting adulteration of raw materials used for biopharmaceutical products. Deliberate adulteration of raw materials used in the food and healthcare industry has resulted in a number of adverse events and loss of life. It is now mandatory for biopharmaceutical manufacturers to ensure that raw materials meet the highest quality standards by testing for contamination or economic adulteration with high resolution analytical tools. For this study, we selected tromethamine (Tris) and tromethamine hydrochloride (Tris-HCl) as the test materials. These are frequently used excipients in therapeutic protein formulations. The analytical instruments were assessed for their capability to detect the presence of at least 5% adulterant. The spectroscopic techniques examined were Near-infrared (NIR), Raman (handheld Raman and Raman-microscope), Fourier Transform Infrared (FTIR) and Nuclear Magnetic Resonance (NMR). The results demonstrated that NIR is capable of rapid detection of raw material adulteration but does not provide identity of the contaminant. NMR can unambiguously detect adulteration and provides structural identification of the contaminant. Raman-microscope and FTIR differentiated adulterated from unadulterated samples through detailed spectral inspection but were not able to determine the identity of the contaminant. The handheld Raman device provides fast measurements but was not able to easily differentiate adulterated from unadulterated samples.
Introduction
Contamination and adulteration of raw materials used in food and pharmaceutical products have resulted in the death of adults and children [1,2]. The deliberate adulteration of milk powder with melamine killed several infants and sickened a large number of people [1]. Contamination of heparin with an “over-sulfated” derivative of chondroitin sulfate, as revealed by NMR, led to the death of 81 patients [2]. The number of tragic incidents due to contamination and adulteration of raw materials used in health care products has driven the need for greater scrutiny of the quality of raw materials by the biopharmaceutical industry. Testing raw materials for contamination and adulteration requires the use of sophisticated analytical techniques with high resolving power, high sensitivity and specificity that are fast and can be implemented in quality control labs at manufacturing facilities.
Here we report on the assessment and comparison of the capability of four spectroscopic techniques, NIR, Raman, FTIR, and NMR, to detect deliberate adulteration of raw materials used as excipients in biopharmaceutical products. For this study, our assessment is based on the capability of the instrument to determine the presence of 5% (w/w) of an added adulterant. Minor impurities observed at much lower levels in the raw materials were excluded from this study. NIR has been employed routinely as a fast non-invasive tool in the quality control labs for identity of raw materials [4,5]. In combination with chemometrics, NIR spectral features of each raw material are reduced to principal components which are used to generate a “spacial” library comprising several batches of the target raw material, against which new individual batches of the raw material are compared to provide an automatic “pass” or “fail” result. FTIR provides unique fingerprints of molecules and can identify unknown compounds by direct comparison of a single spectrum to that of library spectra for an exact match which culminates in positive or negative identity. The universal FTIR spectral library contains over 250,000 compounds [6]. FTIR has been successfully employed by the food industry to detect food adulteration [7]. Both NIR and Raman spectroscopy have been recently developed into portable user-friendly handheld devices that are fast [4,8], and can generate spectra of both solids and liquids without any sample manipulation [9-11]. High resolution 1H NMR spectra provide unambiguous structural information for solid and liquid state by absolute assignment of NMR signals [12]. The selectivity and specificity of this technique are valuable for identification of unknown adulterants and potential use for screening raw materials in a quality control environment.
For this study, two raw materials used regularly as buffer excipients in protein formulations were chosen as the target materials. These are tromethamine (tris[hydroxymethyl]aminomethane) and tromethamine hydrochloride, commonly referred to as Tris and Tris-HCl. They were spiked with materials that are chemically similar or are intermediates in their chemical synthesis, at levels between 5-20% of the selected adulterant. Samples of the spiked and un-spiked Tris and Tris-HCl were analyzed by each of the spectroscopic techniques to evaluate the capability of these instruments to detect adulteration.
Materials and Methods
Materials
Eleven samples were analyzed using NIR, FTIR, NMR and Raman microscope. These were Tris and Tris-HCl spiked with adulterants tris(hydroxymethyl)nitromethane, tricine, and triethanolamine HCl, and neat samples of each of these materials. The adulterated samples were prepared in a test tube by spiking Tris or Tris-HCl with 5% (w/w) or 20% (w/w) of the selected adulterants. The adulterated samples were shaken vigorously for 5 minutes to ensure complete blending. The compositions of the samples used in this study are 100% Tris, 100% TrisHCl, 100% Tris(hydroxymethyl)nitromethane, 100% Triethanolamine HCl, 95% Tris+5% tris(hydroxymethyl)nitromethane, 80% Tris+20% tris(hydroxymethyl)nitromethane, 95% Tris HCl+5% triethanolamine HCl, 80% Tris HCl+20% triethanolamine HCl , 100% Tricine, 95% Tris+5% tricine, 80% Tris+20% tricine, respectively.
Five adulterated samples were used for the handheld Raman assessment. These were prepared by mixing Tris or Tris-HCl with 5% or 20% triethanolamine HCl, 5% or 20% tricine or 10% bis(2-hydroxyethyl)iminotris(hydroxymethyl)methane (Bis-Tris). The compositions of the samples used for the handheld Raman study are 95% Tris HCl + 5% triethanolamine HCl, 80% Tris HCl+20% triethanolamine HCl, 95% Tris+5% tricine, and 90% Tris+10% Bis-Tris, respectively.
Methods
NIR
Approximately 5 to 10 g of each sample were transferred to a 20-mL clear scintillation vial for NIR analysis. The bottom of the vial was wiped clean prior to measurement. NIR diffuse reflectance spectra were recorded on a Fourier-Transform NIR spectrometer equipped with an integrating sphere channel and a PbS detector. Three replicate NIR spectra were collected for each sample. The vials were shaken and repositioned between replicate measurements. Each spectrum was acquired with an average of 32 scans at 8 cm-1 resolution in the spectral range from 12000 to 3500 cm-1.
The NIR spectra of the pure raw materials and adulterated samples were analyzed using Principal Component Analysis (PCA). PCA is a statistical tool that transforms spectral data into abstract multidimensional special parameters defined by principal components embedded in the spectral data. Usually 10 or less components are used for spectral datasets. Detailed description of the principle of PCA can be found elsewhere [4]. We also employed the Conformity Test function in the software to conduct a confirmatory test for the target raw materials, to ensure that samples fall within the normal variability space by checking the variation at each wavelength within the sample spectral range. A positive confirmatory result is given when the variation at each wavelength is within the pre-defined threshold.
Handheld Raman and Raman-microscope
For Raman experiments, we employed a handheld Raman device and a Raman-microscope. The device is designed for quick verification of the identity of raw materials [8]. It employs a 785 nm diode laser as the light ource. The instrument is very robust and rugged to operate. It can generate the Raman spectrum of a raw material in less than one minute. The algorithms in the instrument help to develop the identification test method and to search reference Raman spectra in the library to compare the unknown materials.
The capability of the device for raw material adulteration was tested using the instrument’s onboard identification test methods. To run a specified identification test method, the instrument acquires a Raman spectrum of the sample and compares it with the reference Raman spectrum in the library for the test article. If the sample Raman spectrum is deemed a good match to the reference Raman spectrum, it indicates a “pass”. If it is not a good match, it will indicate a “fail”. If it fails the identification test method, the instrument will then automatically search the entire spectral library for a possible match. If no matches are found in the entire library, it states so. The handheld Raman device was used to analyze five adulterated samples.
For the neat and adulterated samples analyzed using the Raman- microscope, the samples were placed on a Raman glass slide. A 785 nm diode laser with 100 mW power was employed for all the measurements. The spectral coverage was from 70 to 3200 cm-1. A combination of a 20 × magnification objective lens and a 50 x 1000 μm slit aperture were used on the Raman-microscope. The spectra were collected for 20 scans at a resolution of ~ 4 cm-1 and manually inspected to distinguish between adulterated and unadulterated samples.
FTIR
FTIR analysis was performed on a FTIR spectrometer. Several grams of each sample were transferred into a mortar and ground into fi ne powders. To each ground sample, KBr was added and mixed into the sample. The mixture of each sample and KBr was pressed into a KBr pellet. Each KBr pellet was measured in the FTIR in transmission mode. The FTIR spectrum of a sample is the average of 128 scans with a 4 cm-1 resolution.
NMR
NMR measurements were carried out on a NMR spectrometer equipped with a 5 mm QNP probe. An auto-sampler was used in conjunction with software to perform automatic lock, shim, data acquisition and processing. Probe temperature was controlled at 27°C throughout the experiments. Sample preparation was as follows: unweighed samples were dissolved in ~1.0 mL deuterated DMSO-d6 containing 0.05% v/v tetramethylsilane (TMS). The solutions were transferred to 5 mm NMR tubes and loaded in the auto-sampler. NMR sample tubes were not spun during the experiments. 1D 1H NMR experiments were carried out using standard parameter sets for all samples. All 1H spectra were obtained with an accumulation of 64 scans. 1H chemical shift was referenced to internal standard (TMS) resonance at 0.00 ppm.
Results and Discussion
NIR

Figure 1 - NIR spectra of pure Tris (blue), spiked with 5% (orange), 20% (red) of Tris (hydroxymethyl)nitromethane and NIR spectra of pure Tris (hydroxymethyl)nitromethane (green).
Figure 1 shows the NIR spectra of the pure Tris sample and samples of Tris spiked with 5% and 20% tris(hydroxymethyl)nitromethane, and the NIR spectra of pure tris(hydroxymethyl)nitromethane. Six replicate spectra were obtained for Tris and three replicate spectra each were obtained for the adulterated samples and the neat adulterant. Some spectral diff erences were observed between the pure raw material samples and the adulterated samples. In particular, the adulterated samples at 5% and 20% show two distinct bands at 4500 and 4050 cm-1 from tris(hydroxymethyl)nitromethane.
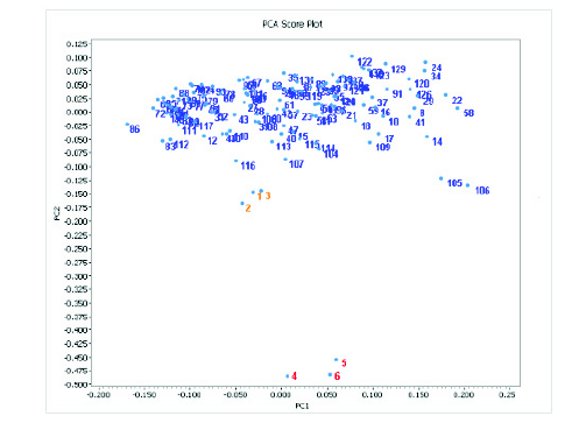
Figure 2 - Two-factor PCA score plot of NIR spectral components (normalized) for Tris and adulterated samples. Blue numbers: pure Tris lots from NIR identifi cation library, orange numbers (1- 3): Tris+5% tris(hydroxymethyl)nitromethane and red numbers (4-6): Tris+20% tris(hydroxymethyl)nitromethane.
Figure 2 shows the results of the PCA score plot of the NIR spectral components for pure Tris and adulterated samples. The dots numbered blue represent over 120 batches of Tris used previously to build the NIR identifi cation library for Tris. The dots numbered orange (1-3) are for the 5% adulterated samples (Tris+5% tris(hydroxymethyl)nitromethane)) and the dots numbered red (4-6) are for the 20% adulterated samples (Tris + 20% tris(hydroxymethyl)nitromethane). The PCA score plot shows the Tris components from the identifi cation library are concentrated at the top of the plot. The components for the 5% adulterated samples shown by the orange numbers are located in the center of the plot, while the components for the 20% adulterated samples shown by the red numbers are at bottom of the plot. The PCA plot shows clear diff erentiation between the 20% adulterated samples and the pure Tris samples. The results for the 5% adulterated samples are close to those for the pure Tris samples. However, further inspection of the higher-order PCA components (the third order, not shown in Figure 2) reveals that the 5% adulterated samples can be clearly diff erentiated from the pure Tris samples.
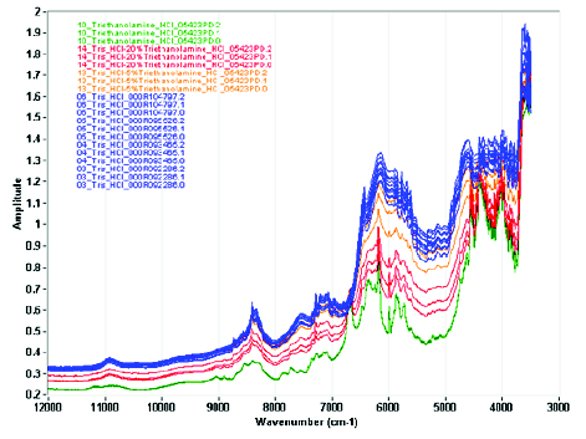
Figure 3 - NIR spectra of Tris-HCl (blue), Tris-HCl spiked with 5% triethanolamine HCl (orange), Tris-HCl with 20% triethanolamine HCl (red), and pure triethanolamine HCl (green).
Figure 3 shows the NIR spectra for pure Tris hydrochloride and the spectra of Tris hydrochloride adulterated with 5% triethanolamine hydrochloride, 20% triethanolamine hydrochloride, and the spectra for pure triethanolamine hydrochloride. Twelve replicate spectra are shown for Tris-HCl, three for the neat adulterant and three spectra each for the 5% and 20% adulterated samples. Spectral diff erences were observed by visual inspection between the spectra for the pure and adulterated samples. There is signifi cant diff erence in the band frequency and shape between the spectra for Tris hydrochloride and those for triethanolamine hydrochloride in the 7000 to 5500 cm-1region. However, diff erentiation between the pure Tris-HCl and the adulterated samples by visual inspection of the spectra alone is very difficult.

Figure 4 - Two-factor PCA score plot of NIR spectral components (normalized) for Tris hydrochloride samples. Blue numbers: Tris hydrochloride samples used to build NIR identity library, orange numbers: Tris hydrochloride+5% triethanolamine hydrochloride, red numbers: Tris hydrochloride +20% triethanolamine hydrochloride.
Figure 4 shows the two factor PCA results of the NIR spectra displayed in Figure 3. The dots numbered blue are for Tris hydrochloride batches that were previously used to build NIR identifi cation library. The dots numbered in orange (1-3) are for Tris-HCl + 5% triethanolamine hydrochloride. The dots numbered in red (4-6) are for Tris-HCl + 20% triethanolamine hydrochloride. The PCA score plot shows that the results for the Tris HCl batches used in the identifi cation library are concentrated in the upper left corner of the plot. The results for the 5% adulterated samples are located in the middle of the plot and the results for the 20% adulterated samples are at the lower right corner of the plot.
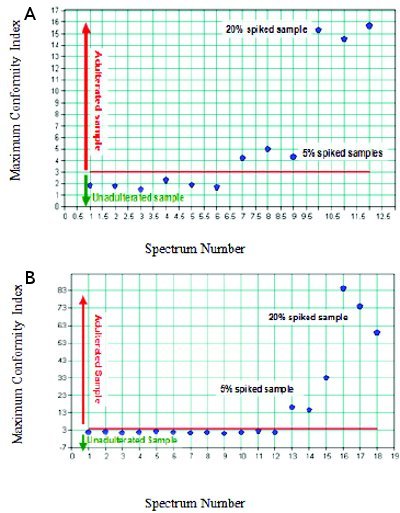
Figure 5 - A. Conformity Test result for spiked Tris samples with Tris (hydroxymethyl)nitromethane and un-spiked Tris samples. B. Conformity Test result for un-spiked Tris hydrochloride samples and spiked samples with triethanolamine hydrochloride.
Figures 5 panel A show the NIR results using the Conformity Test algorithm for adulterated and pure Tris samples. The Conformity Test method is one of the chemometrics tools that can give a positive or negative identity test result for a raw material [4]. A positive Conformity Test result is given when the variation at each wavelength is within the pre-defi ned threshold, which is calculated by statistical analysis of the distribution of the variation at each wavelength. We used 3 as the threshold for this study, which roughly falls at the 95% confi dence level. Gemperline et al have compared the confi rmatory test to Mahalanobis distances and residual variance distances [3], and they found that a confi rmatory test was not as sensitive as the other two methods for detection of an impurity. However, it was able to detect contamination at or above 2% (w/w). On the Conformity index scale, the adulterated and pure samples are diff erentiated very clearly at the index scale of 3. This suggests that the Conformity Test algorithm is able to diff erentiate adulterated from unadulterated Tris samples. Figures 5 panel B show the Conformity Test algorithm can clearly diff erentiate between the adulterated and unadulterated Tris and Tris HCl samples at the Conformity index scale of 3. Both NIR with PCA and the Conformity Test have the capability of diff erentiation of adulterated and unadulterated samples. However, compared to PCA, the Conformity Test result is easily visualized and a simple read out of processed NIR data. The results show a clear distinction between adulterated and unadulterated samples.
It should be pointed out that both PCA and the Conformity Test will require method development using chemometrics. However, once the methods are developed, qualifi ed, transferred and validated, they are easily interpreted by quality control technicians with data acquisition taking only minutes.
Raman
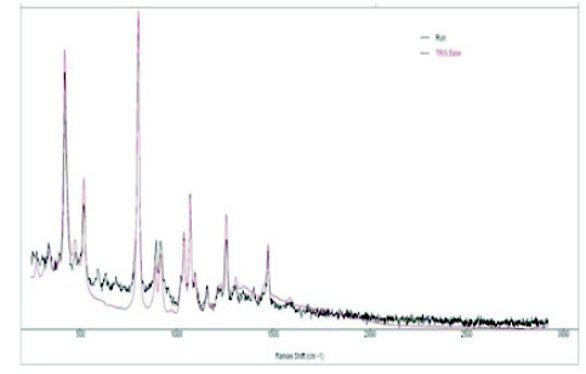
Figure 6 - Hand-held Raman spectra of Tris + 20% adulterant (black: Tris spiked with 20% tricine: red Raman Spectrum of Tris in reference library).
Figure 6 shows the handheld Raman spectra of Tris reference and Tris spiked with 20% tricine. A number of spectral diff erences between the adulterated sample and the reference sample are observed. There are three weak but clearly resolved bands in the adulterated sample in the 500 to 750 cm-1 spectral region and relative intensity diff erence for the two bands at 850 to 900 cm-1 for the pure Tris and 20% adulterated sample. When the Tris identifi cation method in the handheld Raman device was applied to test the 20% adulterated sample, it automatically identifi ed the sample as Tris. Other adulterated samples with 5% and 20% triethanolamine HCl in Tris-HCl and 10% Bis-Tris in Tris-HCl were incorrectly identifi ed as Tris- HCl when the Tris-HCl identifi cation method was employed. However, the handheld Raman device did have the resolution power to show the spectral diff erences due to the addition of adulterants at both the 5% and 20% level in all cases.
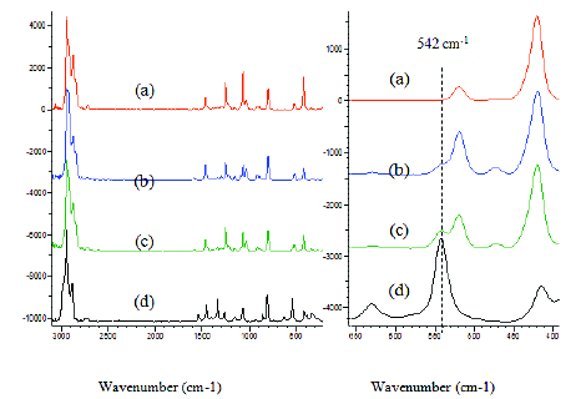
Figure 7 - Raman spectra obtained by Raman-microscope: (a), Tris; (b) 95% Tris + 5% tris(hydroxymethyl)nitromethane; (c), 80% Tris + 20% tris(hydroxymethyl)nitromethane; (d) tris(hydroxymethyl) nitromethane. The right panel is the expanded view of the spectra for 390 to 660 cm-1 where a distinctive adulterant band at 542 cm-1 is located.
Figure 7 shows the Raman-microscope spectra of pure Tris and tris(hydromethyl)nitromethane, and Tris spiked with 5% and 20% tris(hydromethyl)nitromethane. Manual inspection of the Raman spectra reveals that there are signifi cant Raman band diff erences due to the adulterant. The Raman band at 542 cm-1 for tris(hydroxymethyl) nitromethane does not overlap with any band from Tris and its intensity increased signifi cantly at the 5% and 20% adulteration level. This individual Raman band can be used to detect the selected adulterant. The Raman-microscope used in this study is not equipped with an algorithm that can be used for adulteration detection. It also takes 20 minutes to collect a single spectrum. The Raman spectral library has only 3000 compounds which could be limiting for automating adulteration detection. The Raman-microscope therefore requires both software and database development before it could be used for the automated detection of adulteration.
FTIR
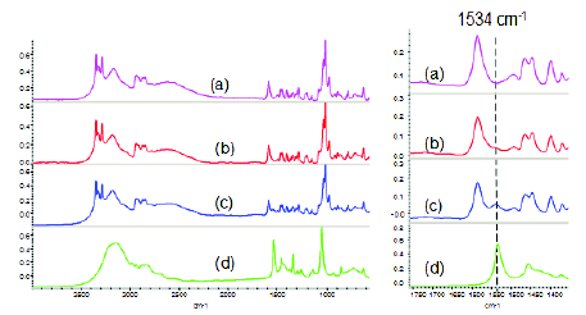
Figure 8 - FTIR spectra of Tris and adulterated Tris. (a) Tris; (b) 95% Tris + 5% Tris(hydroxymethyl)nitromethane; (c) 80% Tris + 20% tris(hydroxymethyl)nitromethane; (d) tris(hydroxymethyl) nitromethane.
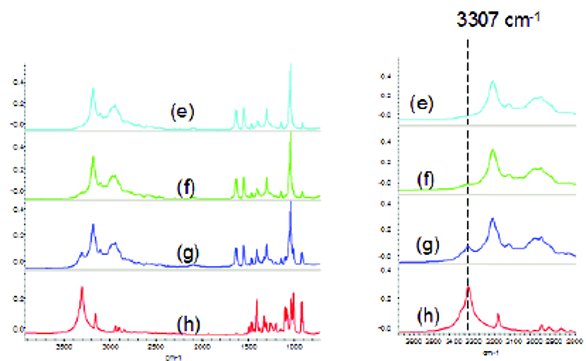
Figure 9 - FTIR spectra: (e) Tris-HCl; (f) 95% Tris-HCl + 5% triethanolamine HCl; (g) 80% Tris-HCl + 20% triethanolamine HCl; (h) triethanolamine HCl.
Figures 8 and 9 show FTIR spectra of pure and adulterated Tris and Tris-HCl, respectively. In Figure 8, the FTIR spectra of Tris and tris(hydroxymethyl) nitromethane look similar in the fi ngerprint region from 2000 to 600 cm-1. However, there are signifi cant diff erences in the high frequency region where Tris exhibits two sharp peaks at 3347 and 3287 cm-1 due to the secondary amine NH2 asymmetric and symmetric stretching, respectively [14]. On the other hand, Tris(hydroxymethyl)nitromethane does not have an amine group and exhibits a broad strong band between 3400-3100 cm-1 due to OH stretching. Moreover, the 1534 cm-1 band for tris(hydroxymethyl)nitromethane due to the NO2 asymmetric stretching is not overlapped with any bands from Tris. This band can be used to indicate potential adulteration for Tris. Similar to Tris, the set of Tris-HCl spectra displayed in Figure 10 also show signifi cant diff erences between the pure and adulterated samples. Triethanolamine HCl has a strong isolated band at 3307 cm-1 due to the NH stretching (6) while Tris-HCl has a well separated +NH3 stretching band at 3185 cm-1. The right inset panel of Figure 9 shows the four spectral segments from 3700 to 2800 cm-1. The 3307 cm-1 band can barely be seen at the 5% adulteration level but can be clearly seen at the 20% adulteration level. The strong 3307 cm-1NH stretching band can be used to monitor the potential adulteration with triethanolamine. Other spectral diff erence can be seen in the 1200 to 1000 cm-1 region. Overall, FTIR can resolve and pick up spectral diff erences between pure and adulterated samples by visual inspection of the spectra. Automated adulteration screening using FTIR requires dedicated software development with chemometrics. It also requires sample preparation to generate KBr pellets and FTIR measurement, together it takes about 20 minutes, which is much longer than NIR, where measurements can be done within 1 minute. FTIR-ATR (attenuated total refl ection) or FTIR-microscope can be exploited to examine adulterated samples without much sample preparation but the FTIR-ATR spectrum is wavelength dependent and the FTIR-microscope is not trivial to use. The FTIR instrument used for this study is a bench top instrument and unlike Raman and NIR, there are no portable versions commercially available [3,15].
NMR
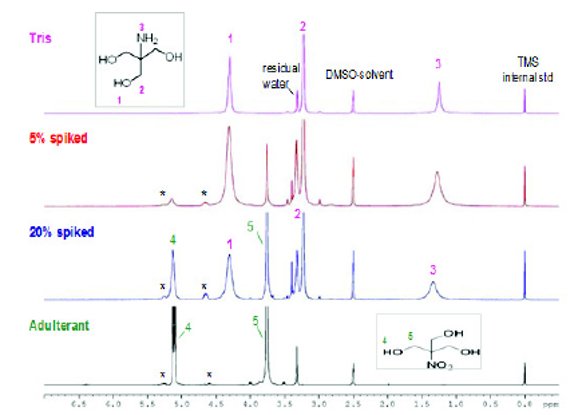
Figure 10 - 1H NMR spectra of unadulterated and adulterated Tris samples with tris(hydroxymethyl)nitromethane. DMSO-d6 with tetramethylsilane (TMS) was the NMR solvent. Note: *indicates minor impurities in tris (hydroxymethyl)nitromethane.
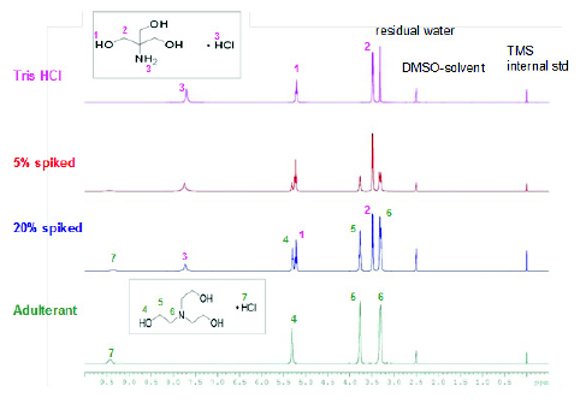
Figure 11 - 1H NMR spectra of unadulterated and adulterated Tris HCl samples with triethanolamine. DMSO-d6 with tetramethylsilane (TMS) was the NMR solvent.
Figure 10 shows the 1H NMR spectra of Tris and Tris adulterated with tris(hydroxymethyl)nitromethane. The NMR solvent, DMSO-d6, appears at 2.51 ppm. All 1H NMR spectra were referenced to tetramethylsilane (TMS) at 0.00 ppm. 1H NMR signal assignment is shown on the spectra. The 300 MHz NMR spectrometer completely resolved the 1H signals of tris(hydroxymethyl)nitromethane in the adulterated sample spiked with 5% and 20% adulterant. It is also noted that impurity signals from the tris(hydroxymethyl)nitromethane were also detected (marked with asterisks in Figure 10). Figure 11 shows the 1H NMR spectra of Tris-HCl and adulterated Tris-HCl with 5% and 20% triethanolamine. The proton peaks of the adulterant triethanolamine are well resolved in the 5% and 20% spiked samples. 1H NMR is certainly one of the most powerful techniques to diff erentiate adulterated samples with its high resolution and sensitivity. Moreover, the cost of a high resolution NMR spectrometer has been signifi cantly reduced in recent years. They can be implemented in QC laboratories with appropriate analytical method development, transfer and validation.
Concluding Remarks
Table - 1 Summary of the comparison of the four spectroscopic techniques used in the adulteration detection assessment.
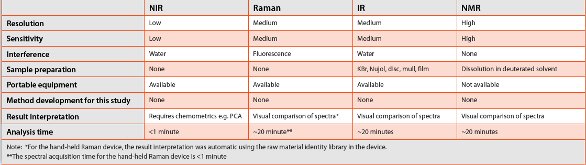
We have compared the four molecular spectroscopic techniques for their capability and suitability for raw material adulteration screening. Each technique has the capability to detect adulteration by interpretation of spectral data directly or with the aid of chemometrics. The ideal instrument for adulteration screening in the QC lab should be fast, accurate, easy to use, and portable. Table 1 summarizes the comparison of the four techniques. Hand-held NIR [15] and hand-held Raman have the advantages of portability, fast test speed, easy of operate, regardless of the samples’ physical state, which is particularly attractive. They may be implemented in a warehouse or docking site to check the incoming raw materials. However, both require with the use of chemometrics and building up a reference library. FTIR has a high resolution power that can diff erentiate adulterants in solid state. However, sample preparation is needed, which is a disadvantage. It also requires that the method be combined with chemometrics to enhance the sensitivity for adulteration detection. A portable FTIR spectrometer is available commercially [16], which put it on an equal par with portable NIR and Raman in the near future. NMR is the ultimate structure determination technique for samples in solution. It determines the absolute structure and conformation of small to mid size molecules but NMR is not portable yet. Although no method development was conducted in this study for any of the techniques evaluated, it would be required for each technique in order to transfer a procedure to the QC laboratory environment for routine adulteration screening.
Acknowledgements
The authors would like to thank Jared Byrne for his contribution to this study, and Gary Rogers for his insights in the preparation of this manuscript.
References
- Huang G, Ouyang Z, Cooks RG. 2009. High-throughput trace melamine analysis in complex mixtures. Chem. Commun. 556–558.
- Guerrini M, Beccati D, Shriver Z, Naggi A, Viswanathan K, Bisio A, Capila I, Lansing JC, Guglieri S, Fraser B, Al-Hakim A, Gunay NS, Zhang Z, Robinson L, Buhse L, Nasr M, Woodcock J, Langer RS, Venkataraman G, Linhardt RJ, Casu B, Torri G, Sasisekharan R. 2008. Oversulfated chondroitin sulfate is a contaminant in heparin associated with adverse clinical events. Nat Biotech. 26: 669-675.
- Kishimoto TK, Viswanathan KGT, Elankumaran S, Smith S, Pelzer K, Lansing JC, Sriranganathan N, Zhao G, Galcheva-Gargova Z, Al-Hakim A, Bailey GS, Fraser B, Roy S, Rogers-Cotrone T, Buhse L, Whary M, Fox J, Nasr M, Pan GJD, Shriver Z, Langer RS, Venkataraman G, Austen KF, Woodcock J, Sasisekharan R. 2008. Contaminated Heparin Associated with Adverse Clinical Events and Activation of the Contact System, The New England Journal of Medicine 358:2457-2467.
- Luypaert J, Massart DL, Vander H. 2007. Near-Infrared spectroscopy applications in pharmaceutical analysis, Talanta 72:865-883.
- Chen G, Fujimori K, Lee H, Nashed-Samuel Y, Phillips J, Rogers G, Shen H, Yee C. 2011. Detection of Adulteration in Acetonitrile Spectrochim. Acta A. 78: 1646.
- Shermann C, Brodbelt J. 2002. Knowitall Analytical System, J. Am. Chem. Soc. 124: 7.
- Ozen BF, Mauer LJ. 2002. Detection of hazelnut oil adulteration using FTIR spectroscopy, J. of Agricultural and Food Chemistry 50:3898-3901.
- Ricci C, Nyadong L, Yang F, Fernandez FM, Brown CD, Newton PN, Kazarian SG. 2008. Assessment of hand-held Raman instrumentation for in-situ screening for potentially counterfeit artesunate antimalarial tablets by FT-Raman spectroscopy and direct ionization mass spectrometry, Analytical Chimica Acta 623: (2)178-186.
- Wen ZQ. 2007 Raman spectroscopy of protein pharmaceuticals, J. Pharmaceutical Sci. 96:2861-2879.
- McCreery RL, Horn AJ, Spencer J, Jefferson E. 1998. Non-invasive identification of materials inside USP vials with Raman spectroscopy and a Raman spectral library. J. Pharmaceutical Sci. 87:1-8.
- Cao XL, Wen ZQ, Vance A, Torraca G. 2009. Raman microscopic applications in the biopharmaceutical industry: in-situ identification of foreign particulates inside glass containers with aqueous formulated solutions. Appl. Spectrosc. 63:830-834.
- Breitmaier E. 2003. Structure elucidation by NMR in organic chemistry: a practical guide (3rd edition), Wiley, New York.
- Gemperline PJ, Boyer NR. 1995. Classification of Near Infrared Spectra using wavelength distances: comparison to the Mahalanobis distance and residual variance methods, Anal. Chem. 67:160-166.
- Bellamy LJ. 1958. The infrared spectra of complex molecules, 2nd edition, John Wiley and Sons, New York.
- Spencer JA, Kauffman JF, Reepmeyer JC, Gryniewicz CM, Ye W, Toler DY, Buhse LF, Westenberger BJ. 2008. Screening of heparin API by Near Infrared Reflectance and Raman Spectroscopy, J. Pharmaceutical Sci, 97: 1-16.
- Coates J. 2007. New products and technologies, Spectroscopy 22: (5), 22-27.
Author Biographies
Dr. Joseph Phillips is executive director in Process & Product Development at Amgen. In his current role he leads several functions engaged in research candidate molecules assessment, protein biophysical characterization, critical product quality attribute characterization and biological relevance, omics related to mammalian cell culture, protein sequence variants detection, bioprocessing raw materials characterization and process reagents clearance determination and safety assessment. He is a member of Amgen’s QbD advisory board.
Dr. Pavel Bondarenko is leading a group of scientists at Amgen in analytical method development for structural characterization of therapeutic proteins; their manufacturability assessment and optimization of production, purification, formulation. Emphasis on mass spectrometry, chromatography, electrophoresis, proteomics, metabolomics. Author of over 50 publications, 10 patents and pending applications.
Dr. Xiaolin Cao is currently a senior scientist in Process & Product Development supporting formulation studies and product manufacturing. Before joining Amgen, Dr. Cao conducted researches in the areas of chiral spectroscopy at BioTools Inc. His current interests are the applications of microscopy and microspectroscopy (Raman and FTIR) in the biotech industry. He has authored over 55 publications.
Dr. Guiyang Li is a currently a scientist focusing on biopharmaceutical manufacturing incident investigation at the Forensic Lab at Amgen. He joined Amgen in 2005. He had been a postdoctoral researcher at the Hospital for Special Surgery, Cornell Medical School, New York. His recent interests lie in applying Chemometrics in vibrational spectroscopy to develop identity test methods for raw materials and quantitative methods in critical process characterizations in biopharmaceutical fields.
Dr. Ying Luo is a Senior Scientist at Amgen since 1996. She provided analytical and structural support to medicinal and process chemistry in Amgen Small Molecule Chemistry Department since 1996. Ying initiated and implemented the NMR support to protein pipeline products and commercial products in 2001. Her interest is to apply high resolution NMR to elucidate molecular structure and incident investigation in biopharmaceutical development. She received her Ph.D. and M.S. degrees in Chemistry from Portland State University, and a B.S. degree in Chemistry from Nanjing University.
Mr. Peter Masatani is a Senior Associate in the Department of Drug Product Development at Amgen, Inc. He obtained his Bachelor of Science in Bioengineering from the University of California, Berkeley. He joined Amgen in 2006. His interests include material science and engineering and molecular immunology.
Dr. Zai-Qing Wen is currently a principal scientist working at the Department of Drug Product Development at Amgen Inc. He joined Amgen in 1999. He obtained his Ph.D. in Biophysical Chemistry from The Glasgow University, U.K., and a BS in Chemical Physics from The University of Sciences and Technology of China. Dr. Wen’s interests include vibrational spectroscopy (FTIR and Raman, UVRR and ROA), biophysics and their application to protein pharmaceutical structure characterization, polymer material characterization, drug product container surface characterization and their interaction with protein therapeutics. Dr. Wen has authored over 50 publications.
Guoxiang Chen earned his Ph.D. degree in Analytical Chemistry with an emphasis on Chemometrics from Ohio University in 2003. He worked as Research and Development Scientist in Metara in Sunnyvale from 2002 to 2003. He joined at Amgen in 2003 and worked for 6 years and then moved to Bayer Healthcare Inc. in 2009. Currently he is a Senior Manager in Bayer Healthcare. His major interest is to employ Near Infrared Spectroscopy with Chemometrics to identify and verify raw materials for biopharmaceutical manufacturing and quality control.