Department of Chemistry, Drexel University
Department of Chemistry, Drexel University
Introduction
A general goal of high-performance liquid chromatography (HPLC) is the separation of all the components of interest in increasingly complex samples while maintaining or even reducing the analysis time. While there are multiple approaches to address this goal, increasing the peak capacity has certainly become an essential strategy. While implementing that strategy, however, it is important to know the likelihood that such an approach will lead to success.
The objective of the present work is to provide a stochastic approach for the prediction of the probability of the successful separation of a sample with a known number of components using a chromatographic system with a given peak capacity. Probabilities based on statistical theory have been reported previously1,2, but the earlier of those reports had a significant bias and both were based on the assumption of constant peak width, which for liquid chromatography translates to gradient elution conditions3.
The stochastic approach described here was applied to both gradient and isocratic conditions (constant and increasing peak widths, respectively), the latter of which has not been considered to our knowledge. In addition, the results of this approach are applied to sequential elution liquid chromatography (SE-LC, vide infra), which is shown to provide significantly higher probabilities of success than conventional HPLC for moderately complex samples.
Theory
Peak Capacity and Saturation Factor
First defined by Giddings, peak capacity is the upper limit of resolvable peaks which can occupy a range of separation space under a given set of conditions4,5. Grushka expanded the definition for isocratic separations.
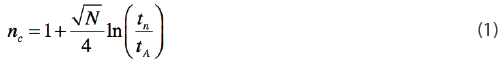
where N is the plate number, tn is the retention time of the nth component, and tA is the retention time of an unretained solute with the assumption that resolution is equal to 16.
Again assuming a resolution of 1, peak capacity was derived in relation to gradient separations as

where tG is the gradient time and W is the baseline peak width (4σ)7.
Davis and Giddings introduced a concept known as the saturation factor, or the fractional amount of the chromatographic space that is occupied by peaks:
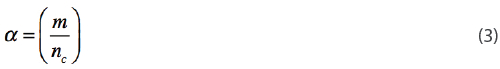
where m is the number of components8. The saturation factor serves as an additional measure by which to evaluate the separation; the likelihood of separating all components will decrease as the saturation factor increases.
Sequential Elution Liquid Chromatography (SE-LC)
In order to achieve the goal of efficient separations of increasingly complex samples, attention has shifted to multi-dimensional HPLC where the peak capacity can be increased for a given separation. Introduced by Little et al. and further developed by Socia and Foley, SE-LC is used to perform higher peak capacity separations on a single column using selectively strong mobile phases to sequentially elute different classes of compounds9,10. By dividing the compounds of interest among two or more selective elution modes, the number of components and saturation factor per mode is reduced by 2X or more, thus dramatically increasing the probability of success for each elution mode and in turn, the overall probability of success of SE-LC3,9.
Stochastic Approach
Our stochastic approach allows for the pseudorandom distribution of m compounds to determine the likelihood of complete separation (Rs ≥ 1.5) under gradient and isocratic conditions. Unlike a previous designed probability study1, this approach takes into consideration all possible elution patterns by defining the separation space utilizing conceptual boundaries (typical retention factors) rather than using two components of the sample to do so1.
Experimental Methods and Calculations
“Programming Information”
Calculations were performed using Matlab R2014b (8.4.0.150421).
Stochastic Probability
Uniformly-distributed, pseudorandom numbers were generated with a uniform random number generator and were converted to typical retention times in HPLC within the separation space. For the simulated gradient separations, the conversion was performed on random numbers generated in the time domain. For the simulated isocratic separations, where retention times are typically biased to the front of the separation space, the random numbers were generated in the free energy domain, and then translated to retention times. Peak widths were assumed to be constant for gradient simulations. The peak capacity for this approach was calculated by introducing a resolution term into equation 2
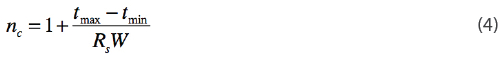
For isocratic separations the peak width increases as the separation time increases; a commonly accepted way to account for this is to assume a constant plate number (N). Introducing a resolution term into equation 1 yields

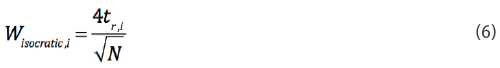
Given that the width of a chromatographic peak is generally taken to be 4σ, and one definition of plate number is N = (tR/σ)2, the peak width at a given time can be calculated from
The resolution between adjacent simulated peaks was determined for both methods. The experiment was considered successful if all calculated resolutions met or exceeded 1.5. Ten million simulated separations were performed for each combination of m and nc.
The probability (Pm,n) of a successful separation, expressed as a percentage, was then calculated from the number of successful separations.
The probability of success in an SE-LC separation is the product of the probability of success of each successive sequential elution mode9. Making no assumptions about the distribution of sample components among the modes, the probability of success can be expressed as

where mi and nc,i are the number of components and peak capacity, respectively, in each of the r sequential elution modes.
Results and Discussion
Probability of Success
The probability of separating various numbers of components (m) at a given peak capacity (nc) via gradient elution with a resolution of 1.5 or greater is plotted in Figure 1. As shown, for any value of m, the probability increases as nc increases and for any value of nc the probability decreases as m increases. Both of these results are as expected, as increasing m increases the likelihood of overlapping peaks due to an increase in the saturation, while increasing nc increases the amount of available space for the peaks to occupy, decreasing the saturation. It is also of note that no combination of m and nc results in a 100% probability of success; the highest probability (99.3%) was achieved with the fewest number of components and the largest peak capacity considered. (m=2, nc=300).
 Figure 1. Probability of a complete separation* using gradient elution versus number of sample components (x-axis) and peak capacity (legend). Each result is the average of five sets of ten million simulated gradient separations (constant peak width). *Rs ≥ 1.5 for all compounds
The probability of success via isocratic elution (Rs ≥ 1.5) is plotted in Figure 2. The trends are the same as in the gradient separations, since the methods by which the probability of success can be increased are not specific to the elution conditions. Interestingly, the observed probability for isocratic separations is smaller than for analogous gradient separations (same m, nc). For example, for 5 components and a peak capacity of 20 (m=5, nc=20), gradient elution has a 30.7% probability of success, while isocratic elution has a 23.9% probability of success. The lower probability obtained for isocratic elution can be explained by the higher density of random retention times in the earlier part of the chromatogram (due to the uniformly-distributed random free energies) that is only partially compensated by the narrower peak widths of the earlier-eluting compounds (constant N assumption). Importantly, a greater likelihood of success for the same values of m and nc can be achieved by switching from isocratic to gradient elution.
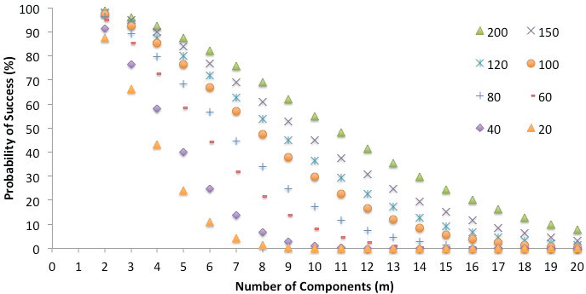 Figure 2. Probability of a complete separation* using isocratic elution versus number of sample components (x-axis) and peak capacity (legend). Each result is the average of five sets of ten million simulated isocratic separations (constant plate number). *Rs ≥ 1.5 for all compounds
HPLC vs. Sequential Elution LC
A comparison between HPLC and two previously-defined scenarios of SE-LC9 for gradient separation is shown in Table 1. Although the specific examples for each of these scenarios were discussed previously9, the numerical results are different for two reasons: First, the probabilities were calculated using the results of our stochastic approach rather than the biased equation of Martin et al.1. Second, the peak capacity used for Scenario 2 was based on the assumption of gradient rather than isocratic elution conditions.
Table 1. Comparison of probability of success of SE-LC versus HPLC for the separation of 12 and 24 component samples, assuming a peak capacity of 120 in HPLC.
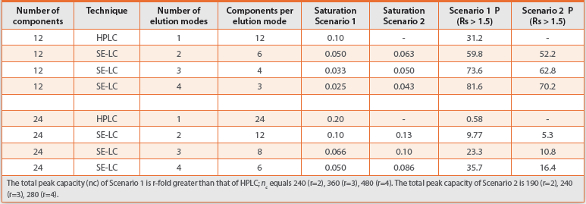
For Scenario 1 there is an r-fold increase in analysis time, due to the fact that each sequential elution mode is equivalent in analysis time to the original HPLC separation9. The probability of completely resolving a 12-component sample by traditional HPLC with a peak capacity of 120 is 31.3%, whereas the probability using SE-LC with 2, 3, and 4 elution modes, respectively (with an equal number of components in each mode), is 59.8%, 73.6%, and 81.6%. The probability of completely resolving a 24-component sample using HPLC is 0.58%, whereas the probability using SE-LC is 9.77%, 23.3%, and 35.7%. With fewer components present in each separation window of equal peak capacity, and an r-fold increase in total peak capacity, the resulting decrease in saturation leads to a notable increase in probability of success.
In the interest of shortening analysis time, experimental conditions are adjusted in Scenario 2 so that the total SE-LC analysis time is equal to that of the total HPLC separation time9. The total peak capacity will still be larger than the peak capacity in HPLC, but not r-fold larger. As can be seen in Table 1, the probability of completely resolving a 12-component sample using SE-LC Scenario 2 is 52.2%, 62.8%, and 70.2%. The probability of completely resolving a 24-component sample using SE-LC scenario 2 is 5.3%, 10.8%, and 16.4%. Scenario 2 will not result in as large an increase in the probability of success compared to Scenario 1, but the former will nonetheless be preferable than HPLC when minimizing analysis time is essential.
Conclusions
The stochastic approach provides an accurate representation of the likelihood of successful separation of multi-component samples for both gradient and isocratic elution. Simulated results reinforce the understood dependencies of the probability of success on the saturation and the peak capacity. For a sample with a given number of components, increasing the peak capacity and decreasing the saturation will increase the probability of separation. The stochastic approach also revealed the benefits of gradient over isocratic elution; for the same peak capacity the probability of resolving all components is higher with gradient elution than isocratic elution due to the different time-domain distribution of peaks and their corresponding widths. Finally, the results of the stochastic approach show the dramatic increase in the probability of a successful separation using sequential elution liquid chromatography (SE-LC). For a 12-component sample with an HPLC peak capacity of 120 the probability of success increased from 31.3% (HPLC) to 70.2% (Scenario 2) or 81.6% (Scenario 1) by using SE-LC.
Acknowledgements
E.J.E. thanks the Chemistry Department at Drexel University for the teaching assistantship and other financial support provided.
J.P.F. gratefully acknowledges the Applications and Core Technology University Research (ACT-UR) grant from Agilent Technologies, the 2015-2016 sabbatical leave provided by Drexel University, and the Visiting Fellowship provided by the University of Tasmania and the Australian Center for Research on Separation Science (ACROSS).
References
- M. Martin, D.P. Herman, G. Guiochon, Probability-Distributions of the Number of Chromatographically Resolved Peaks and Resolvable Components in Mixtures, Anal Chem, 58 (1986) 2200-2207.
- J.M. Davis, D.R. Stoll, Likelihood of total resolution in liquid chromatography: Evaluation of one-dimensional, comprehensive two-dimensional, and selective comprehensive twodimensional liquid chromatography, J Chromatogr A, 1360 (2014) 128-142.
- E.J. Ennis, J.P. Foley, Stochastic Approach for an Unbiased Estimation of the Probability of a Successful Separation in Conventional HPLC and Sequential Elution Liquid Chromatography, J Chromatogr A, (2016).Revised Manuscript in Review.
- J.C. Giddings, Maximum Number of Components Resolvable by Gel Filtration and Other Elution Chromatographic Methods, Anal Chem, 39 (1967) 1027-1028.
- J.C. Giddings, Generation of Variance, “Theoretical Plates,” Resolution, and Peak Capacity in Electrophoresis and Sedimentation, Separation Science, 4 (1969) 181-189.
- E. Grushka, Chromatographic Peak Capacity and Factors Influencing It, Anal Chem, 42 (1970) 1142-1147.
- J.W. Dolan, L.R. Snyder, N.M. Djordjevic, D.W. Hill, T.J. Waeghe, Reversed-phase liquid chromatographic separation of complex samples by optimizing temperature and gradient time I. Peak capacity limitations, J Chromatogr A, 857 (1999) 1-20.
- J.M. Davis, J.C. Giddings, Statistical-Theory of Component Overlap in Multicomponent Chromatograms, Anal Chem, 55 (1983) 418-424.
- A. Socia, J.P. Foley, Sequential elution liquid chromatography can significantly increase the probability of a successful separation by simultaneously increasing the peak capacity and reducing the separation disorder, J Chromatogr A, 1324 (2014) 36-48.
- E.L. Little, M.S. Jeansonne, J.P. Foley, Sequential Multimodal Elution for Pseudomultidimensional Liquid-Chromatography on a Single Column, Anal Chem, 63 (1991) 33-44.