Abstract
The role of the development of new stationary phases in the last twenty years on the progress made in fast liquid chromatography is discussed based on their speed-resolution properties. The kinetic performances of 4.6 mm I.D. silica monolithic columns (~ 300 bar), 2.1 mm I.D. columns packed with sub-2 μm fully porous particles used in very high pressure liquid chromatography (vHPLC at ~ 1000 bar), and 4.6 mm I.D. columns packed with sub-3 μm superficially porous particles in conventional HPLC (~ 400 bar) are compared. Their limitation for application in fast chromatography is also shown. The construction of the kinetic Poppe plots demonstrates the advantage of using sub-3 μm core-shell particles in fast liquid chromatography after simple modifications of conventionnal HPLC instruments. Eventually, the ultimate peak capacity expected under fast gradient elution (15 s) of small molecules (100-300 g/mol) is around 45 for relatively smooth gradient steepness (0.015 s-1) using elevated temperature (eluent’s viscosity 0.35 cP), 1.7 μm core-shell particles, improved vHPLC instruments, and short narrow-bore columns (2.1 mm x 50 mm).
Introduction
The pharmaceutical, biological, and food industries are constantly challenging material scientists toward the preparation of more permeable and/or more efficient stationary phases for application in fast analytical chromatography. In fact, the column technology has never evolved so fast than in the last decade. While the standard 5 μm fully porous particles were dominating the field in the 1990s, a first breakthrough in the development of new stationary phase took place in 2000 with the commercialization of silica monolithic columns [1,2]. The permeability of these silica rods was found equivalent to that of columns packed with 11 μm particles while keeping the same efficiency as that of columns packed with 5 μm particles [3,4]. Their advantage over the standard 5 μm particles was then opening a very promising road toward the preparation of a new generation of efficient and highly permeable columns. At the same time, the development of finer particle and very high pressure pumps was still continuing. Eventually, vHPLC was introduced in 2004 [5]. The particle size went down to 1.7 μm allowing the use of shorter narrow-bore columns. In order to reach the optimum velocity of these columns and to cope with the loss in colum permeability, pressure drop around 1000 bar had to be applied. Finally, a few years later, the old concept of pellicular stationary phase pioneeredin the late 1960s by Horvath [6,7] and developped by Kirkland with 50 μm [8,9] and 5 μm [10] particles was reborn in 2006 with sub-3 μm core-shell particles [11,12]. These new fine particles are made of a 1.7 μm solid non-porous silica core surrounded with a 0.5 μm thick porous shell. Designing a thick shell rather than a thin pellicular layer aimed at delivering large specific surface area and high sample loading. The 4.6 mm I.D. columns packed with these core-shell particles were found more efficient that those packed with the same particle size but totally porous [12]. Additionally, they were two to three times more permeable than columns packed with sub-2 μm particles [13]. Eventually, these columns could still be used with standard HPLC systems (< 400 bar) provided some unexpensive modification in terms of reduction of the extra-column volume [14].
The goal of this work is to compare the kinetic performance of the first generation of monolithic columns, of the vHPLC columns (sub-2 μm particles) , and of columns packed with sub-3 μm core-shell particles. The use of the experimental kinetic Poppe plot (log(t0/N) vs. log N) will reveal the advantage of either one of these stationary phases. The practical limitations towards the achievement of faster and more efficient analyses are discussed. Finally, the ultimate peak capacity expected with today’s columns and instruments is estimated.
Theory
Construction of the Isocratic Kinetic Poppe Plots
For each type of stationary phase, the kinetic Poppe plot [15] was built in order to compare their intrinsic performance at a constant level of either peak resolution (logN) or analysis time (log t0/N). Assuming that the plate height, H, is independent of the column length, L, and that the density and viscosity of the eluent are at first approximation independent on the pressure, the construction of a Poppe plot at constant column pressure drop, ΔP, and at constant eluent viscosity, η, becomes straightforward. This requires the selection of a single column length, the measurement of the height equivalent to a theoretical plate (HETP), H(uS), as a function of the superficial linear velocity, uS, and the determination of the specific permeability, ko,, of the column. The HETP curve is adjusted to best van Deemter equation [16]:
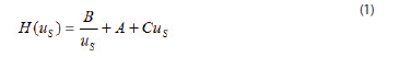
The column efficiency is written:
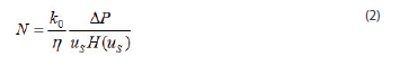
The speed property of the column is given by:

where εt is the total porosity of the column.
Prediction of the Peak Capacity in Gradient Elution In gradient elution chromatography, the peak capacity is defined for a resolution factor of 1 and represents the maximum number of peak that can be solved during the gradient time, tG. Assuming a linear solvent strength model (LSSM), the absence of adsorption of the strong eluent, a linear gradient, and a column plate height independent of the mobile phase composition, the peak capacity PC is written [17]:
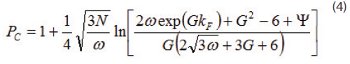
where kF is the apparent retention factor of the last eluted compound for t=t0+tG


where S is the slope of the relationship between the logarithm of the retention factor, k, as a function of the volume fraction of the strong eluent,(φ), in the LSSM and β is the gradient steepness defined as the ratio of the increment of the volume fraction φ during the gradient to the gradient time tG.
Experimental
All the chromatographic data were acquired with a standard vHPLC instrument equipped with a binary gradient pump, an auto-sampler, a column oven compartment, and a UV diode array detector. The dimensions of the monolithic column, of the narrow-bore column packed with sub-2 μm fully porous particles, and of that packed with sub- 3 μm shell particles were 4.6 mm x 100 mm, 2.1 mm x 50 mm, and 4.6 mm x 150 mm, respectively. The mobile phases and analytes used for the measurement of the columns’ HETPs were a mixture of acetonitrile and water (55/45, v/v) and naphthalene for the monolithic column, pure acetonitrile and naphtha[2,3-a]pyrene with the sub-2 μm fully porous particles, and a mixture of acetonitrile and water (80/20,v/v) and naphthalene with the sub-3 μm shell particles. The gradient experiment was recorded with a 2.1 x 150 mm column packed with 1.7 μm shell particles. Mobile phases A and B were mixtures of acetontrile and water (75/25 and 82/18, v/v). The linear gradient was ramped from 100% A to 100% B in 4 min. 1 μL of a flagrant oil mixture dissolved in pure acetonitrile was injected. The temperature was controlled by the lab air-conditioning system at 295 ± 1 K.
Results and Discussion
he first goal of this work is to build the kinetic Poppe plots for three different column technologies which have been introduced in the field over the last decade. The Poppe plots allow first to assess and compare qualitatively the speed-resolution property between the different stationary phases. In a second part, we comment and provide some explanations about the limitations of these supports with respect to fast analytical chromatography. In the last part, we estimate the highest peak capacity that the experimenter can expect in fast gradient elution with today’s chromatographic systems (eluent/column/chromatograph).
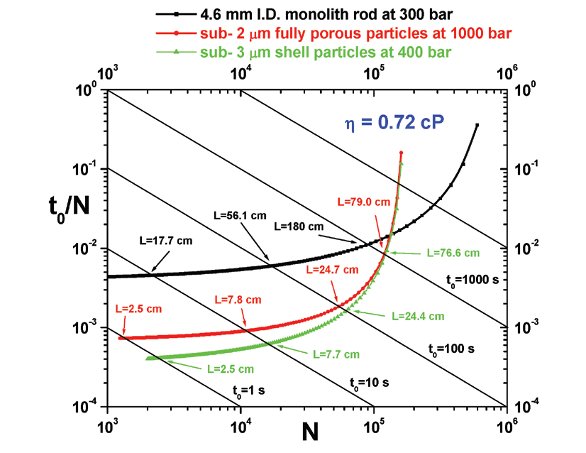
Figure 1- Comparison between the kinetic Poppe plots of 4.6 mm I.D. monolithic columns (black line), 2.1 mm I.D. columns packed with sub-2 μm fully porous particles (red line), and 4.6 mm I.D. columns packed with sub-3μm shell particles (green line). This graph shows the potential gain/loss in analysis time and peak resolution from one column technology to another.
Isocratic Kinetic Poppe Plots
It is first important to recall that the position of the Poppe plots is not highly accurate given the assumptions made for their construction. The Poppe plots are mostly useful because they reveal trends regarding the kinetic performances of any type of stationary phases. All the HETP data were acquired with small molecules and were fitted to the best van Deemter equation (optimized parameters A, B, and C). The specific permeabilities k0 were measured at 6.2 x 10⁻¹⁴ m2 (monolith), 2.6 x 10⁻¹⁵ m2 (sub- 2 μm fully porous particles), and 6.0 x 10- 15 m2 (sub-3 μm shell particles). Monolithic rods and columns packed with sub-3 μm shell particles are then nearly 25 and 2.5 times more permeable than columns packed with sub- 2 μm particles. The three Poppe plots phases are gathered in Figure 1. They were calculated for different pressures because monolithic columns cannot be operated above 300 bar, sub-2 μm fully porous particles show their full potential at very high pressures close to 1000 bar, and sub-3 μm shell particles can still provide optimum performance with conventional 400 bar instruments. Based on these results, monolithic columns are no more competitive today in comparison to what the latest particulate columns can achieve. If we consider a hold-up time of only 10s, particulate columns can deliver twice better peak resolution than silica monolith.
For a given level of resolution (say N ~ 104), particulate columns can also provide 4 times faster separations because we can use them in a much shorter column format (7.5 cm vs. 40 cm) and under very high pressure (1000 bar vs. 300 bar). Remarkably, the intrinsic performance of sub- 3 μm shell particles at only 400 bar is equivalent to that of sub- 2 μm fully porous particles. The explanation lies in the fact that shell particles generate the same minimum plate height as that of sub- 2 μm fully porous particles (Hmin ~ 3.5 μm). Additionally, the C coefficient in the van Deemter equation is much smaller with shell than with fully porous particles (0.6 vs. 1.2 ms). This is of foremost importance in fast liquid chromatography where the column efficiency is essentially controlled by the solid-liquid mass transfer resistance.
Performance Limitations in Fast Isocratic Chromatography
The main handicap of 4.6 mm I.D. monolithic columns is their intrinsic radial structure heterogeneity [19] which generates plate height no smaller than 15 μm when measured from the numerical integration of the whole peak. Therefore, silica monolithic structure remains efficient only when they are prepared inside thin open glass capillaries which cannot deliver fast sample throughputs.
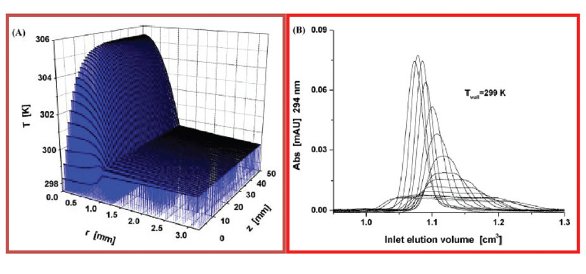
Figure 2- (A) Temperature profile in a 2.1 x 50 mm column and its surrounding stainless steel tube. The wall temperature is maintained constant at 299 K. The column is packed with sub-2 μm particles. Flow rate=1.80 mL/min. Pressure drop: 950 bar. (B) Progressive evolution of the elution peak profile of naphtha[2,3-a] pyrene with increasing the flow rates. From left to right, the flow rates are: 0.12, 0.20, 0.30, 0.40, 0.50, 0.60, 0.70, 0.80, 0.90, 1.00, 1.10, 1.20, 1.30, 1.40, and 1.50 mL/min.
Columns packed with sub-2 μm particles can be run at flow rates around 2 mL/min and at pressure drop of 1000 bar in fast elution chromatography. This generates a significant amount of heat (frictional heating) that should be dissipated by axial convection and radial diffusion along and across the packed bed. Additional band broadening occurs when this power heat friction becomes larger than 5 Watt/m [20]. At 1000 bar pressure drop and at a flow rate of 2 mL/min, this power friction is around 66 W/m. Additionally, if the column wall is poorly insulated by placing the column in a thermostated liquid bath, this generated heat is constrained to diffuse across the column diameter. Figure 2A shows the temperature profile in a 50 mm long narrow-bore column including the thick stainless steel wall. The radial temperature profile is flat across the metal tube because its thermal conductivity is as high as 15 W/m/K. In contrast, the heat conductivity of a packed bed immersed in the eluent is typically around 0.5 W/m/K. The consequence is the formation of steep radial temperature gradients and a progressive distortion of the band profile as the flow rate increases as shown in Figure 2B. There are two main ways to cope with this loss of column efficiency. First and foremost, the column should be used in conditions which minimize the heat transfer between the column wall and the external environment. Radial temperature gradients are then transformed into axial temperature gradients. Therefore, placing the column in a stagnant-air environment (column oven compartment) is the most appropriate conditions to face the heat friction problem. Secondly, the heat released inside the packed bed can be reduced by heating the eluent in order to decrease the pressure drop along the column. When both these options are carefully respected, the experimenter can recover at least 80% of the theoretical column efficiency [20].
A last limitation concerns the impact of the instrumentation on the level of efficiency effectively measured by the analyst. The variance of the concentration distribution (in volume squared unit) due to the sole dispersion along the column is given by [14]:
where V0 is the column hold-up volume, N is the intrinsic column efficiency, and k the retention factor of the analyte. In fact, the experimenter measures the sum of the contributions of the column (see above) and of the instrument (σ2 v,instrument) or:
Would the instrument be ideal, e.g. σ2 v,instrument=0, the observed peak variance of a 2.1mm x 50 mm column packed with sub- 3 μm shell particles (HETP ~ 3.5 μm) would be 5.1 μL2 for a moderately retained compound (k=2). The column efficiency would then be N=14300. At high flow rates, the contribution of the instrument is equal to about 6 μL2 with improved (115 mm I.D. connectors, 800 nL detection cell) vHPLC systems and 20 μL2 with improved (115 mm I.D. connectors, 1.7 μL detection cell) standard HPLC systems [14]. According to Eq. 9, the experimenter only observes 6570 (-55%) and 2900 (-80%) plates, respectively.

Figure 3- Theoretical peak capacity (Eq. 4) calculated for a 2.1 x 50 mm column packed with 1.7 μm shell particle as a function of the variation of the volume fraction of the strong eluent during a gradient time of 13.5 s. Flow rate: 4.0 mL/min. T=333 K. Pressure drop: 1000 bar. Mobile phase: acetonitrile/water mixture (viscosity 0.35 cP). vHPLC instrument improved with 115 μm connectors and 800 nL detection cell (extra-column variance 6 μL2).

Figure 4- Chromatograms of a concentrated oil fragrance mixture obtained by gradient elution. Sample: 1 μL of an acetonitrile solution of the oil (1/60, v/v). Solvent A: pure acetonitrile. Solvent B: pure water. Linear gradient program: ramp from t=0, 75/25 v/v A/B, to t=4 min, 82/18 v/v A/B. Constant flow rate 0.75 mL/min. Initial maximum inlet pressure 1190 bar. T= 294 K. (A) 2.1 mm x 150 mm column packed with sub-2μm fully porous particles. (B) 2.1 mm x 150 mm column packed with sub-2 μm shell particles. The friction power is 10 W/m for both columns.
Ultimate Performance in Fast Gradient Elution
The fastest gradient elution can be achieved by selecting elevated temperatures (60oC), acetonitrile/water eluent mixture (50/50, v/v), ultra-high pressures (1000 bar), short narrow-bore column (2.1 mm x 50 mm) packed with 1.7 μm shell particles (HETP ~ 3.0 μm), and improved vHPLC instruments (σ2 v,instrument = 6 μL2). Eventually, this column can be run at 4.0 mL/min and will deliver a hold-up time of 1.5 s. The apparent efficiency observed for a weakly retained compound (k=1) is about 2600 plates. According to Eq. 4, Figure 3 plots the theoretical peak capacity for a short gradient time (tG=13.5 s) as a function of the change in the volume fraction, Δφ, of the strong eluent during the gradient’s ramp. Remarkably, a maximum of 45 peaks could be solved in 15 seconds for a gradient steepness of 0.2/13.5=0.015 s-1. A Gaussian peak being completely described with 50 points, the sampling rate used should be equal to 167 which corresponds exactly to the highest sampling rate of commercial vHPLC instruments. For the sake of illustration, Figure 4 illustrates the advantage of using sub-2 μm shell particles (right graph B) instead of sub-2 μm fully porous particles (left graph A). The heat conductivity of core-shell particles is larger than that of fully porous particles and the radial temperature gradients across the 2.1 mm I.D. column are reduced.
Conclusions
Fast analytical chromatography can be best performed with thermally insulated columns, elevated temperatures and pressures, 5 cm long narrow-bore (2.1 mm I.D.) columns packed with sub-2 μm shell particles,and improved vHPLC chromatographs. This offers the possibility to solve a maximum number of 45 peaks in about 15 seconds after minimization of the efficiency loss caused by frictional heating and extra-column band broadening.
References
- K. Nakanishi and N. Soga, Journal of American Ceramic Society (1991), 74, 2518-2530.
- H. Minakuchi, K. Nakanishi, N. Soga, N. Ishizuka, and N. Tanaka, Analytical Chemistry (1996), 68, 3498-3501.
- F. Gritti, W. Piatkowski, and G. Guiochon, Journal of Chromatography A (2003), 983, 51-71
- G. Guiochon, Journal of Chromatography A (2007), 1168, 101-168.
- J. Mazzeo, U. Neue, M. Kele, and R. Plumb, Analytical Chemistry (2005), 77, 460A-647A.
- Cs. Horvath and S. Lipsky, Analytical Chemistry (1969), 41, 1227-1234.
- Cs. Horvath and S. Lipsky, Journal of Chromatographic Science (1969), 7, 109-116.
- J. Kirkland, Analytical Chemistry (1969), 41, 218-220.
- J. Kirkland, Analytical Chemistry (1971), 43, 36A-48A.
- J. Kirkland, Analytical Chemistry (1992), 64, 1239-1245.
- J. Kirkland, T. Langlois, De Stefano J, American Laboratory (2007), 39, 18-21.
- F. Gritti, A. Cavazzini, N. Marchetti, and G. Guiochon, Journal of Chromatography A (2007), 1157, 289-303.
- G. Guiochon and F. Gritti, Journal of Chromatography A (2011), 1218, 1915-1938.
- F. Gritti, C. Sanchez, T. Farkas, and G. Guiochon, Journal of Chromatography A (2010), 1217, 3000-3012.
- H. Poppe, Journal of Chromatography A (1997), 778, 3-21.
- J. van Deemter, F. Zuiderweg, and A. Klinkerberg, Chemical Engineering Science (1956), 5, 271-289.
- F. Gritti and G. Guiochon, Journal of Chromatography A (2010), 1217, 1604-1615.
- F. Gritti and G. Guiochon, Journal of Chromatography A (2010), 1217, 1604-1615.
- J. Abia, K. Mriziq, and G. Guiochon, Journal of Chromatography A (2009), 1216, 3185-3191.
- F. Gritti and G. Guiochon, Journal of Chromatography A (2009), 1216, 1353-1362.
Author Biography
Fabrice Gritti is a Research Associate in the Department of Chemistry at the University of Tennessee. He received a B.S. degree in Chemistry and Physics from the University Joseph Fourier of Grenoble (France) in 1995, a graduate Engineering school degree in Chemistry and Physics from the University of Bordeaux I (France) in 1997, and a Ph.D. in Chemistry and Physics from the University of Bordeaux I (France) in 2001. Dr. Gritti’s research interests involve liquid/solid adsorption thermodynamics and mass transfer in heterogeneous media for characterization and design of new HPLC column technology.
This article was printed in the April 2011 issue of American Pharmaceutical Review - Volume 14, Issue 3. Copyright rests with the publisher. For more information about American Pharmaceutical Review and to read similar articles, visit www.americanpharmaceuticalreview.com and subscribe for free.