In recent years in the United States there has been news about ever increasing drug prices1 and essentially ineffective calls/pressure and votes to lower them. Drugs are increasingly becoming unaffordable. Discussions and/or referendums to lower drug prices are an ongoing attempt by consumers, healthcare activists and even politicians but all efforts die a slow and silent death.
All elected officials, in spite of the electorate’s need for lower drug prices and pressure, have no say or influence in establishing price controls through legislative action or negotiations because their repeated electability depends on funding from pharma and other lobbies. Since repeat legislative terms are important to the legislators they succumb to the financial pressures of the vested interests. Patients in established healthcare systems or otherwise pay the demanded or the best negotiated prices.
Since insured patients pay their required co-payments, actual drug prices do not matter to them until they cannot afford them. As the prices rise, some slowly stop taking their needed drugs. In developing countries prices are generally based on what patients can pay from their pocket. Prices in these countries are definitely lower than the developed country prices. Many people in the developed countries complain about lower drug prices in the developing countries. This is not due to intellectual property being abused but more due to affordability and big pharma participating in these lower prices.
We have to recognize that the pharmaceutical companies have no interest in lowering drug prices2 and then we get to hear comical statements.3 Their expected goal is to increase revenue and profits. With not many drugs in the pipeline or having been approved in recent years that are for the masses (more than five million patients per disease) or more efficient than the current drugs for the same ailment and are affordable, the only option for companies is to increase revenue by raising prices. In the last two years pharma companies have succumbed to the social and political pressure and some opted to keep their price increases below 10% per year. 4,5 Orphan drugs do raise revenue and profits but these drugs are not the answer for pharma’s long-term survival. Unless pharma companies can offer affordable and better performing drugs the current model will have a short life. My perspective is that the current model is faltering and failing.
This is a review of comparative drug prices in the United States and India and a reaffirmation of price differences. It also discusses the API’s (active pharmaceutical ingredient) contribution to prices. This analysis can be used by anyone to calculate profits being made at different points in the supply chain and how the mutually subsidized systems camouflage the real costs.
Higher Affordability ≅Higher Revenue
It seems ironic that there is not much interest to increase revenue through higher drug affordability. Recent high priced pharmaceutical acquisitions are expected to deliver blockbuster drugs (over 1 billion dollar in sales per year) and improve revenues and profits. If the drugs are not affordable, sustainability of recent acquisitions in my estimation will not have long-term value. The viability of certain companies could be in jeopardy. Survival of pharma companies necessitates consideration of alternate business model/s. We will have to see if companies will consider alternate business models. Economics 101 teaches that a higher customer base even at lower than previous prices can increase the total revenue and profits. Improving affordability with a larger patient base is one of the answers.
In recent times pharma companies justified higher prices for drug efficacy but if most are unaffordable such drugs have limited financial value.
This stance might be acceptable to some but with lower affordability improved drug efficacy might not matter. As discussed later companies have lowered prices in certain countries. I believe that if pharma can improve affordability and serve a larger population, their overall revenue could be much higher than revenue increases under the current model.
Forecasts of 6.5% CAGR global pharma revenue growth have been made. I am not sure of such growth. A detailed analysis suggests such numbers are not possible.6 Regulations come in the way to improve processes that lower costs, improve affordability, improve profits and revenues.
Background/Knowledge about Drug Prices
Elements of drug prices are a secret. The majority of people associated with the pharma business either don’t understand or don’t question how the prices are established. Pricing elements are not discussed openly. Patients can complain about drug prices but will pay the asked prices as the drugs cure ailments and extend life.
Financial analysts during company/analyst meetings generally do not ask pharma companies about their drug pricing. Generally pharma company prices and their offered explanations are accepted.6 They welcome news about pharma revenue and profitability whether it happens through higher priced drugs or price increases. Since profits in pharma are generally high, questions related to using better manufacturing technologies to improve profitability or affordability are not discussed. The financial analysts’ mission is to recommend buy and sell investments. To the Press quarterly results, new drugs and their prices are the story. Drug pricing methodology or improved affordability is not much of a story to either.
In this review sale prices of a few drugs are used to “reverse calculate” API price contribution. These prices are compared to the actual API prices. This gives us an approximate idea of price differential at different points in the chain.
Randomly selected drugs are used. However, before we analyze the data some information about pricing set by the BIG pharma might be of interest.
Pharma companies have been forced to change their pricing model when the drugs are sold at lower prices than in the developed countries through compulsory licensing. When WTO agreements were negotiated companies in the developed countries did not realize the potency of compulsory licensing. Big drug companies learned a lesson. Gilead got caught flat-footed and when Cipla sold AIDS drugs at extremely lower prices outside the United States. Gilead’s Sovaldi for HCV is an excellent example of different global pricing strategy.
Gilead licensed manufacturing and distribution at significantly lower prices through selected developing country companies. Prices in the United States started at $1000.00 per day vs. about $10.00 in Egypt7 vs. about $10.00 in India and $100.00 in China.8
It has to be acknowledged that the drugs being sold at lower prices are not being sold at a loss or are of lower dosage. Table 1 shows API cost contribution. Through licensing profits are being made even at lower prices.
Table 1. 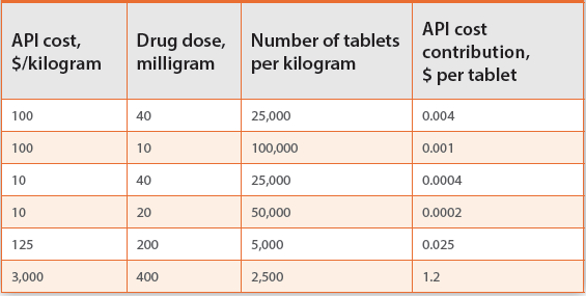
The idea of licensing is to prevent circumvention of intellectual property.
Januvia, a Merck diabetes drug, was initially offered in India at prices that were similar to US prices. Even with very high diabetes population and drug of high value, patients shrugged off the new drug. Eventually Merck lowered its sell price9 to make it affordable.
The above references clearly state that the drug prices in the developed countries can also be lower even with participants in the supply chain making significant profits. Economies of scale and better manufacturing technologies can further lower API and formulation costs with everyone in the supply chain making decent profits thus improving affordability.
API Cost in Drug Price
Table 1 illustrates the cost contribution of active pharmaceutical ingredients (API) at different dosages assuming 100% formulation efficiency. These numbers are theoretical numbers and are a good place to start. Sovaldi API price is approximated at $3,000.00 per kilo.10Table 2 later shows imported API price versus reverse calculated API contribution. Table 4 shows the pharmacy selling price. Assumptions are detailed later.
Table 2. 
Drug Prices: India Versus US
Table 2 is an illustration of a few drugs sold in India. A 35% margin is used between the manufacturer and the local pharmacy. This number is used after consultation with large Indian pharmacies. It is assumed that the API cost contribution in each drug is 35% at the manufacturer level. Remaining is the cost of manufacturing, excipients, profits and sundries. These numbers are an approximation and used for illustration only. Readers can use diff erent numbers of their choosing.
Reverse calculated API prices in Table 2 when compared to the imported prices for the same drugs suggest that the formulation efficiencies of the formulation processes are significantly lower or the intermediaries are making high profits. Low conversions are opportunities. Having many suppliers of APIs also suggest that their manufacturing processes are not optimum and need considerable engineering and process help. Economies of scale can improve processes, lower prices and improve aff ordability. Very little or no eff ort is made to improve manufacturing.
Table 3 is a comparison pricing of the drugs in Table 1 in the United States vs. India. Except for Nexium, listed drugs have to be bought by prescription and thus are part of a mutually subsidized system. Real prices in the United States without prescription are much higher.
Table 3. 
Hypothetical Drug Prices
Table 4 illustrates the approximate selling prices of drugs through formulation and various points in the supply chain. There are assumptions made for the costs of excipients, and conversion costs. They are assumed to equal to the cost of API. Profits at factory, PBM and pharmacy are assumed to be about 33% for each entity. The selling price can be compared to the selling price in the US and India.
Table 4. 
The purpose of this article is not to finger point any company or country but is to suggest that there is significant opportunity to adjust/lower sale prices in the countries, make drugs aff ordable, and improve revenues and profits.
References
- Drug Prices Soar, Prompting Calls for Justification, The New York Times, July 23, 2015, Accessed December 20, 2017
- The drug industry is addicted to price increases, report shows, CNBC, April 20, 2017 Accessed December 20, 2017
- Lilly CEO: With pharma friends in high places, it’s ‘time for action’ to ease drug costs, FiercePharma.com January 10, 2018, Accessed January 11, 2018
- Several drug makers just raised their prices by nearly 10 percent, and buyers expect more price hikes, Statnews.com, Accessed January 3, 2018
- Pfizer, Novartis and more post price hikes on dozens of drugs, but AbbVie’s is worth the most, FiercePharma.com, Accessed January 5, 2018
- Malhotra, Girish: An Alternate Look At the Pharmaceutical World Revenues and Drug Aff ordability, Manufacturing Chemist, Volume 88, Number 10, October 2017 pg. 28-32
- Gilead prices hepatitis C giant Sovaldi in China at one-fifth the U.S. price: report, FiercePharma.com, Accessed January 12, 2018
- Gilead off ers Egypt new hepatitis C drug at 99 percent discount, Reuters.com, Accessed January 12, 2018
- Merck prices diabetes drug at fifth of US rate http://www.livemint.com/Companies/ bQMFNMPw2lUm49D0lOFEQI/Merck-prices-diabetes-drug-at-fifth-of-US-rate.html Accessed December 22, 2017
- Hill, Andrew, Khoo, Saye, Fortunak, Joe, Simmons, Bryony Simmons,3 and Ford, Nathan: Minimum costs for producing hepatitis C direct-acting antivirals for use in large-scale treatment access programs in developing countries, Clin Infect Dis. 2014 Apr;58(7):928-36. doi: 10.1093/cid/ciu012. Epub 2014 Jan 6. Accessed January 16, 2018
- https://www.pharmacompass.com/price/furosemide, Accessed December 26, 2017https://www.pharmacompass.com/price/metformin, Accessed December 26, 2017
- https://www.pharmacompass.com/price/atorvastatin-calcium-trihydrate, Accessed December 26, 2017
- https://www.pharmacompass.com/price/levothyroxine-sodium, Accessed December 26, 2017
- https://www.pharmacompass.com/price/omeprazole, Accessed December 26, 2017
- https://www.pharmacompass.com/price/esomeprazole, Accessed December 26, 2017
- https://www.pharmacompass.com/price/cipro, Accessed December 26, 2017
- Fed Up With Drug Companies, Hospitals Decide to Start Their Own, The New York Times, January 18, 2018, Accessed January 18, 2018