Introduction
The increasingly globalized pharmaceutical supply chain [1-3] has the potential to expose consumers to adulterated or substandard pharmaceutical materials. Recent adverse events involving the economically-motivated adulteration of heparin [4] highlight the need to use modern analytical equipment [5-7] to assist in screening and surveillance of incoming raw materials including active pharmaceutical ingredients (APIs). The U.S. Food and Drug Administration Division of Pharmaceutical Analysis (DPA) has built a spectral library, [8, 9] containing 500+ entries, for the surveillance of incoming excipients, APIs, and finished drug products. The main objective of this initiative is to increase the number of pharmaceutical materials screened, thereby helping to ensure that drug products and ingredients are safe and effective. The spectra for all entries in the library are acquired on Raman and near infrared (NIR) spectrometers, provided that samples are amenable to both techniques. The spectral libraries are then distributed on field-deployable portable and handheld spectrometers. Since the master library is obtained on laboratory-grade spectrometers, this requires the use of a standardization/transfer protocol [8, 10] since spectra are typically not transferrable between different units without certain corrections [11, 12]. In this paper, we detail our recent efforts to distribute the Raman and near infrared (NIR) API libraries to spectrometers which will be used for field screening by FDA personnel both domestically and internationally [13]. We will discuss the differences involved in distributing Raman and NIR libraries between laboratory-based and handheld units and evaluate the performance of the transfer algorithm for each technique.
Methods
The Raman and NIR API spectral libraries used in this study were acquired on laboratory-based spectrometers. The excitation wavelength used for the Raman library was 785 nm. The Raman libraries were shift corrected and relative intensity corrected prior to distribution to three handheld spectrometers, all identical models from the same vendor, based on algorithms previously developed by DPA [8, 10]. The NIR libraries were interpolated and truncated to match the spectral range and interval spacing for the three handheld NIR spectrometers, all identical models from the same vendor. The initial NIR and Raman libraries contained 37 unique APIs (although there are multiple entries for each API totaling 100+ total API entries). A list of the different APIs is given in Table 1.
Table 1. List of Different APIs in Master Library.
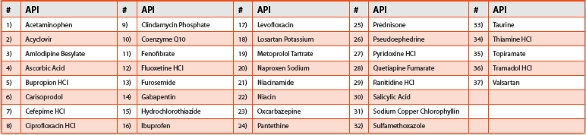
To test the transferability of the API library between the laboratory and handheld instruments, a test set of five different APIs were chosen from the entire API library and placed in 2x2-inch polyethylene bags. Three different bags were filled for each of the five samples to form three, five-member test sets. Each test set was run once on each handheld instrument by 3 different users, for a total of nine runs per instrument.
Comparison between the test set sample spectrum and individual master API library reference spectrum was performed by calculating a spectral correlation (SC) value. The SC value is a common hit quality index (HQI), which is used extensively in spectral library studies [14]. The SC value is the square of the correlation coefficient, defined as where Transfer denotes the spectrum of the material acquired on the handheld spectrometer, Master denotes the spectrum of the material that is stored in the master library, and the dot symbolizes the dot product of two spectral vectors. The SC value ranges between 1.000 and 0, with the former indicating a perfect match, and the latter indicating the poorest possible match. A Pass/Fail threshold of 0.95 was used for this study, which is a commonly used threshold value for SC-based testing. All SC values presented were calculated on the first derivative spectra, which were obtained by applying a 2nd order, 31-point window Gram Polynomial to the Raman spectra and a 2nd order, 5-point window Gram Polynomial to the NIR spectra. The narrower window for the analysis of NIR spectra was due to the use of only 100 total data points in the spectra obtained from the handheld unit.
In the user interfaces for both Raman and NIR handheld spectrometers, the labeled or claimed identity of the sample must be also capable of returning the top three matches from comparison with entire library.
Results
Prior to distribution of the Raman and NIR libraries to the transfer instruments, an SC diagram was generated to characterize the method specificity for distinguishing between different APIs. The color-coded SC diagram is shown in Figure 1 for both Raman and NIR. These diagrams are useful in identifying specific entries in the library where different APIs may pass screening for one another (i.e., yielding false passes). The numerical indices on the perimeter of the correlation diagrams refer to the APIs listed in Table 1. Black diagonal elements correspond to SC values from comparing library entries against themselves; for these cases, the SC calculation is equal to “1.000”. Off-diagonal elements represent SC values from the comparison of two different API pairs; they are color-coded according to the color system shown in Figure 1. The diagrams are symmetric about the diagonal because the spectral correlation values are independent of the order of Master and Transfer spectra in Equation 1. There are no green or blue elements observed for either technique. The Raman spectral correlation diagram displays only two pairs of APIs that result in off-diagonal SC values that exceed 0.5, while the NIR diagram displays numerous API pairs with SC values that exceed 0.5. The increase in the number of orange boxes for the NIR SC diagram is primarily due to the broad nature of NIR bands in comparison to the sharp, strong spectral features observed for Raman. The broader bands increase the probability that two NIR spectra will have significant intensity at a particular wavelength value, leading to higher SC values for dissimilar materials. Based on the SC diagrams in Figure 1, both techniques appear to be reliable in their ability to distinguish between different APIs when a threshold value of 0.95 is used, as evidenced by the existence of only orange or white-colored boxes for both techniques. Thus no pairs of APIs studied would be expected to artificially “Pass”.
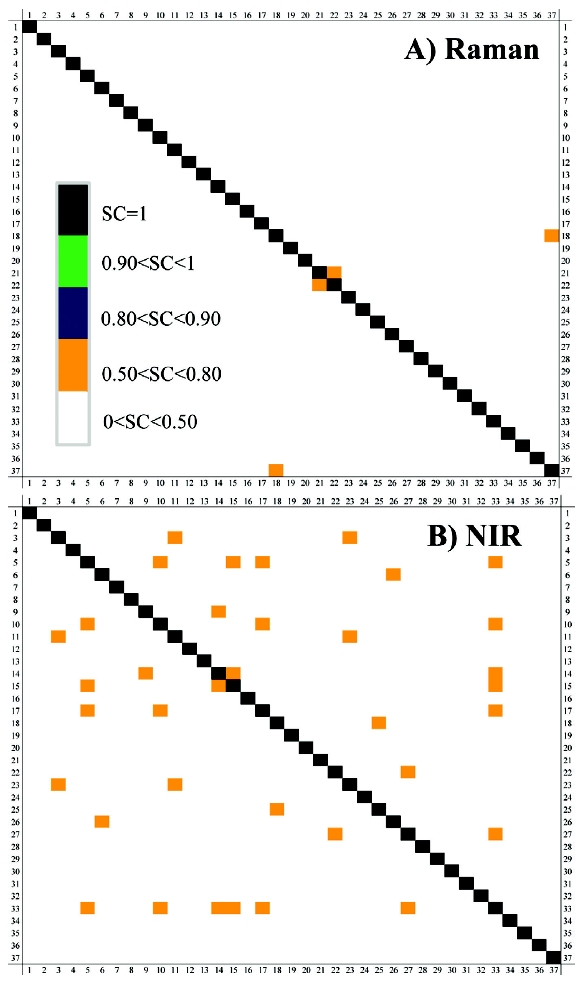 Figure 1. Spectral correlation diagrams for the different APIs listed in Table 1 for A) Raman and B) NIR. Off-diagonal elements correspond to comparison between two different APIs, and diagonal elements correspond to the same API compared to itself.
A visual comparison of the raw spectra of bupropion HCl measured with handheld Raman and NIR spectrometers and lab-based benchtop spectrometers is shown in Figure 2. The Raman pair shown in Figure 2A shows remarkable similarity between the spectrum obtained from handheld instrument and the master library spectrum obtained on the laboratory instrument. There are some visual spectral differences in the NIR pair shown in Figure 2B, particularly in both the lower and upper ends of the spectral ranges. Despite these minor differences, the handheld and master library spectra are very similar.
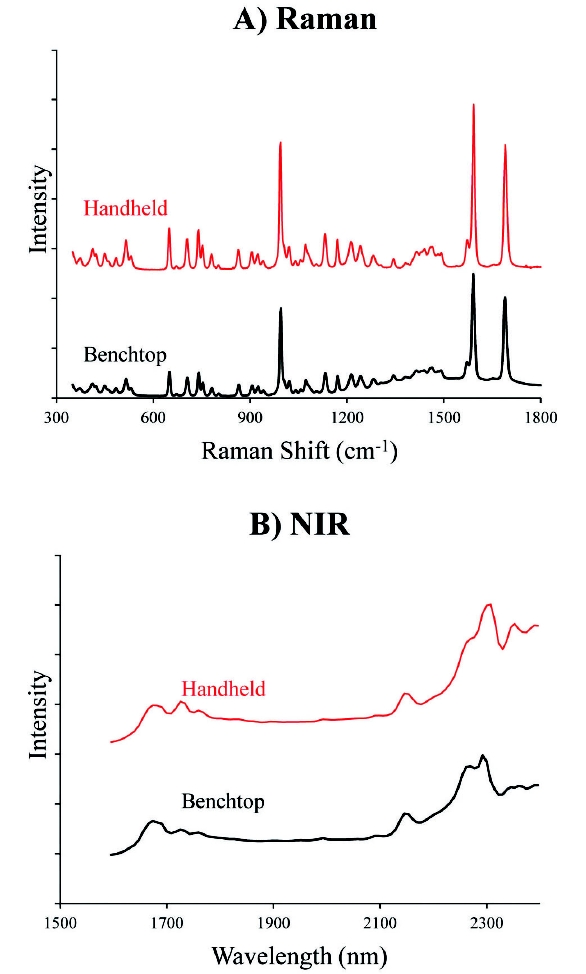
Figure 2. Comparison between the same Bupropion HCl sample run on benchtop and handheld spectrometers for A) Raman and B) NIR.
Results for the five member test set run on each of the handheld spectrometers are shown in Tables 2 and 3 for Raman and NIR, respectively. For all samples run, the average SC value is above 0.95. All five samples in all three test sets passed in each run. The “Avg. SC” column for each handheld spectrometer corresponds to the average SC value for the same sample in each of the three test sets. The “Average SC” row given at the bottom of the table for each handheld instrument corresponds to the pooled average SC value for all five API samples in the study. The pooled average SC value is essentially the same for all handheld units, indicating that all three Raman or NIR units deliver comparable performances. This attribute is crucial in using these instruments in the field, since substantial variability in the performances of instruments would be problematic in implementation of field screening programs. The low standard deviation values calculated for each sample tested by the three handheld instruments indicate that there is not any discernable sampling variability detected by the SC test in using different test sets or different operators. All of the samples run on the handheld instruments had a second-ranked match that was below 0.70, supporting the specificity of the SC methods when studying APIs shown in Figure 1.
Table 2. Verification Test Results on Handheld Raman Instruments.
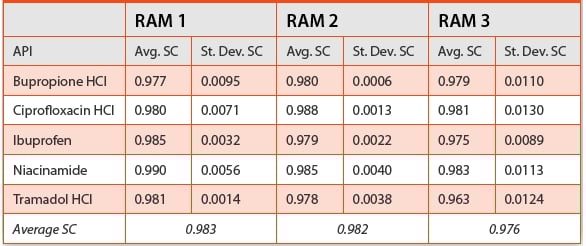
Table 3. Verification Test Results on Handheld NIR Instruments.

Conclusion
The data presented here show that Raman and NIR handheld spectrometers can be reliably used to screen incoming APIs as part of a larger rapid screening program. An API spectral library acquired on laboratory-based spectrometers was successfully distributed to three different handheld units for both Raman and NIR. Spectral correlation-based testing was effective in verifying the identity of API samples. For each handheld unit, the SC-based testing yielded reproducible results for replicate measurements of the same API, demonstrating that the SC values are relatively unaffected by differences in the operator and sampling media. Furthermore, the SC results exhibited a high degree of reproducibility across the different handheld units for each spectroscopic technique. Thus, this method for SC-based testing of APIs using Raman and NIR handheld instruments is appropriate for field-deployment.
Acknowledgements
This project was supported in part by the CDER Critical Path Program and FDA Medical Countermeasures Initiative (MCMi). The authors wish to acknowledge the FDA Office of Compliance and Office of Regulatory Affairs for assistance in building the API library. The authors also wish to thank Mr. Brian C. Noakes for his assistance in processing API library samples. This project was supported in part by an appointment (S.K.S., M.J., H.K.S., Y.L.L.) to the Research Participation Program at the Center for Drug Evaluation and Research administered by the Oak Ridge Institute for Science and Education through an interagency agreement between the U.S. Department of Energy and the U.S. Food and Drug Administration.
Disclaimer
The findings and conclusions in this article have not been formally disseminated by the Food and Drug Administration and should not be construed to represent any Agency determination or policy.
Author Biographies
Dr. Jason Rodriguez is a chemist in the FDA Division of Pharmaceutical Analysis, St. Louis, MO. He received his Ph.D. from the University of Illinois at Urbana-Champaign in 2009 and his B.S. in chemistry from the University of Texas Pan American in 2004. He joined the FDA/DPA in 2009 and has worked on developing field-deployable Raman and near infrared spectral library methods.
Mr. Steven Skaggs worked as a summer student at FDA Division of Pharmaceutical Analysis. He has been taking general classes at Saint Louis Community College at Meramec. He soon plans to study chemistry at University of Missouri-St. Louis.
Ms. Manju M. Johny was a summer intern at the FDA Division of Pharmaceutical Analysis during the summer of 2013. She is currently pursuing a B.A. in chemistry and mathematics from Saint Louis University.
Mr. Hirsch K. Srivastava received his B.S. in Economics from Washington University in St. Louis in 2009 and worked in public policy and healthcare technology before switching fields. He is currently an intern at FDA Division of Pharmaceutical Analysis where he has assisted the rapid screening team on spectral library building and testing. He is planning on attending medical school in the future.
Dr. Sergey Arzhantsev is senior staff fellow at the FDA Division of Pharmaceutical Analysis. He received a Ph.D. in Physics from Moscow M. V. Lomonosov State University in Moscow, Russia. Dr. Arzhantsev utilizes spectroscopic methods to study the quality and stability of pharmaceutical products.
Dr. Yvette L. Loethen is an ORISE post-doctoral fellow at the FDA Division of Pharmaceutical Analysis, St. Louis, MO. She received a B.S. in chemistry from DeSales University and a Ph.D. from Purdue University. Her work involves assessing and expanding Raman and NIR spectral libraries of pharmaceutical products.
Dr. John Kauff man is the Deputy Director of the FDA Division of Pharmaceutical Analysis. He earned a Ph.D. in Physical Chemistry from the University of Illinois in 1988. He joined the FDA in 2004 to develop NIR and Raman spectroscopy for pharmaceutical analysis. Prior to joining FDA, he was professor of chemistry at the University of Missouri.
Dr. Lucinda Buhse is Director of the Division of Pharmaceutical Analysis, a laboratory-based division in CDER responsible for supporting FDA review, investigation and enforcement actions and for conducting research programs to advance new technologies to assess pharmaceutical quality. Dr. Buhse received a Ph.D. in Physical Chemistry from the University of California, Berkeley.
References
- Ensuring the Safety of Imported Products: http://www.fda.gov/downloads/ForConsumers/ ConsumerUpdates/UCM229925.pdf Accessed: December 2013.
- Pathway to Global Safety and Quality: http://www.fda.gov/downloads/AboutFDA/CentersOffices/OfficeofGlobalRegulatoryOperationsandPolicy/GlobalProductPathway/UCM262528.pdf Accessed: December 2013.
- Global Engagement: http://www.fda.gov/downloads/AboutFDA/ReportsManuals Forms/Reports/UCM298578.pdf Accessed: December 2013.
- Brustkern, A. M.; Buhse, L. F.; Nasr, M.; Al-Hakim, A.; Keire, D. A. Anal. Chem. 2010, 82, 9865-9870.
- Hargreaves, M. D.; Green, R. L.; Jalenak, W.; Brown, C. D.; Gardner, C. In Infrared and Raman Spectroscopy in Forensic Science; John Wiley & Sons, Ltd, 2012, pp 275-287.
- Sorak, D.; Herberholz, L.; Iwascek, S.; Altinpinar, S.; Pfeifer, F.; Siesler, H. W. Appl. Spectrosc. Rev. 2011, 47, 83-115.
- Kalyanaraman, R.; Bobler, G.; Ribick, M. Am. Pharm. Review 2011, 14, 98-104.
- Rodriguez, J. D.; Gryniewicz-Ruzicka, C. M.; Kauff man, J. F.; Arzhantsev, S.; Saettele, A. L.; Berry, K. A.; Westenberger, B. J.; Buhse, L. F. Am. Pharm. Review 2013, 16, 9-18.
- Merrell, P. H.; Buhse, L.; Rodriguez J.D. Tablets and Capsules 2013, 11, 22-26.
- Rodriguez, J. D.; Westenberger, B. J.; Buhse, L. F.; Kauff man, J. F. Analyst 2011, 136, 4232-4240.
- Gryniewicz-Ruzicka, C. M.; Arzhantsev, S.; Pelster, L. N.; Westenberger, B. J.; Buhse, L. F.; Kauff man, J. F. Appl. Spectrosc. 2011, 65, 334-341.
- Li, X.; Arzhantsev, S.; Kauff man, J. F.; Spencer, J. A. Journal of Pharmaceutical and Biomedical Analysis 2011, 54, 1001-1006.
- Kauff man J.F.; Rodriguez J.D.; Gryniewicz-Ruzicka C.M.; Arzhantsev S.; D’Sa A.; Uratani B.; Wolfgang S.; Westenberger B.J.; Buhse, L. F.; Dunn, J. D.; Mecker-Pogue, L. C. Bio. Pharma. Asia 2013, 1, 28-37.
- Kauff man, J. F.; Rodriguez, J. D.; Buhse, L. F. Am. Pharm. Review 2011, 14, 34-40.