Introduction
The development of portable and handheld tools in the past decade has introduced new valuable analytical capabilities to quality control, quality assurance and manufacturing traceability in the pharmaceutical industry. As a result, there has been a dramatic change in the way the industry carries out identification and validation of raw materials (1). The performance of these portable devices has improved significantly and, in some cases, is able to generate data quality equivalent to laboratory-grade bench instruments.
One of the most widely used portable techniques for rapid identification of unknown compounds such as testing of fine chemicals, measurement of pharmaceutical ingredients, or authentication of drug compounds) is Raman spectroscopy (2, 3, 4). The economic (5) and technical (6) benefits of handheld Raman spectrometers have been well discussed in open literature, but one area where there is confusion for many users of this technology (novice and experienced alike) is in regards to the different statistical algorithms which are used for on board analysis of spectra. In this article, we will discuss the two most common mathematical representations used with handheld Raman spectroscopy as decision making tools for spectroscopic data: Hit Quality Index (HQI) and significance level (p-value). Generally, HQI is the preferred method for library matching of unknown materials, and p-value is best suited for verifying the identity of a known material. Here we will discuss specific examples for the use of each tool.
Library Matching
Library Matching is a well-established method in spectroscopy for the investigation of unknown materials and is commonly used for identification of materials from an FTIR, NIR or Raman spectrum 7-11). This is typically performed by cross-correlating the measured spectrum of a material against a validated library of spectra of known materials. The degree of correlation (similarity) of each potential match is then quantified by a calculation of HQI defined by,

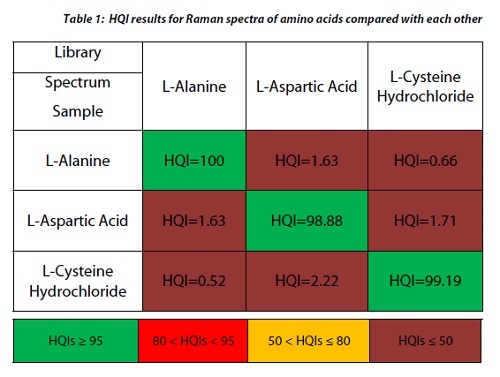
HQI represents the spectral correlation coefficient between the two spectra by taking the dot product of the unknown material and the library spectra squared, divided by the dot product of the library spectrum with itself multiplied by the dot product of the unknown spectrum with itself. The value of HQI is between 0 to 1.0, with higher values representing a measure of greater likeness between a sample spectrum and a library reference. When scaling by 100, a perfect match would be 100, indicating that the correlation between the sample and reference is 1. With this information, a “match” / “no match” decision can be automated by the selection of a suitable minimum HQI limit as shown in Figure 1 below. Depending on the application, HQI limits are typically set between 80 and 99, but a typical practice in the pharmaceutical industry is to set the minimum HQI for a match to 95 (8, 9). It is important to note that the HQI is not a measure of the purity of the material in question; rather, it is simply a measure of correlation between the library reference spectra and the unknown spectrum.

It is also important to note that correlation techniques do not provide any information about the probability that the match is valid. Additionally, HQI is not particularly sensitive to small spectral changes, and misidentification can occur between similar materials. As a result, library matching is primarily used as a tool for investigation of unknown materials, where one needs to quickly compare the spectrum of an unknown material against a number of potential spectral matches, as shown in Table 1. HQI is not recommended to qualify the identity of a known material; instead, a p-value is recommended for this application.
Identity Verification
In order to verify the identity of a “known” material, it is necessary to use a more advanced statistical approach to ensure that the probability for the material being what it is supposed to be is above a certain threshold (typically 95% confidence). There are various mathematical approaches which can be used to classify samples, each with varying degrees of precision and robustness. In this article, we will focus on the Soft Independent Modeling of Class Analogy (SIMCA) method which was pioneered by Svante Wold in the 70’s and 80’s (12) and is currently utilized in the NanoRam handheld Raman spectrometer (B&W Tek, USA). This multivariate analysis approach, based on developing principal component analysis (PCA) models for each material to model the structured variance of each class, is a widely used classification tool (12, 13, 14).
SIMCA is based upon the determination of similarities within each class, making it ideal for verification of known compounds. The details of the SIMCA method are well described in literature (12- 15), but can be summarized by the following steps:
1. Measure a training set of spectra for a desired material using a sample set of materials that have been verified using an approved analytical method (such as chromatography or mass spectrometry).
a. It is important to note that the larger and more representative the sample set is, the more robust the final method will be. When developing methods on the NanoRam (B&W Tek, USA), a minimum of 20 spectra are required, but the user may also choose to add additional spectra to increase the robustness of the model.
2. Develop a principal competent analysis (PCA) model with the training set and establish the membership limits based on a 95% confidence level.
3. Measure the spectrum of a new sample, and project it onto the PCA model to see if it lies within the model limits.
Once a method has been developed, its limits are defined by a confidence interval on the model, which provides the multivariate acceptance distance for new samples. When new samples are measured and projected onto the model, the sample distance to the model can be compared with the acceptance limit (the Hotelling’s T2, and from this the probability of a sample belonging to the class is determined. This is done by taking advantage of the mathematical relationship between the T2 distribution and the F-distribution. Therefore, it is possible to calculate the F-value, which is a measure of the variability on the population, under the null hypothesis. Then, the F-value can be used to calculate the p-value, allowing for the determination of the probability of the material in question being the material used for the development of the model and defining acceptable boundaries for material acceptance.
The definition of the p-value is the probability of getting an observed value more extreme than your estimated result when there is no effect in the population. Therefore, considering the hypothesis: “the container labeled as raw material A contains raw material A”, where the null hypothesis (H0) is H0= material A; and the positive alternative (H1) is H1 = not material A, the p-value represents the smallest level of significance at which the H0 will be rejected assuming that the null hypothesis is true. So, if the p-value is ≥ 0.05 (which represents a confidence level of 95%), the product is accepted and material A is verified as material A, but if the p-value ≤ 0.05, then material A is not verified and will be rejected.
Figure 3 shows the results of three methods which were developed on the NanoRam (B&W Tek, USA) for L-alanine (I), L-aspartic acid (II), and L-cysteine hydrochloride (III). It should be noted that their structures are quite different and could be identified unambiguously using an HQI value as previously shown in Table 1.
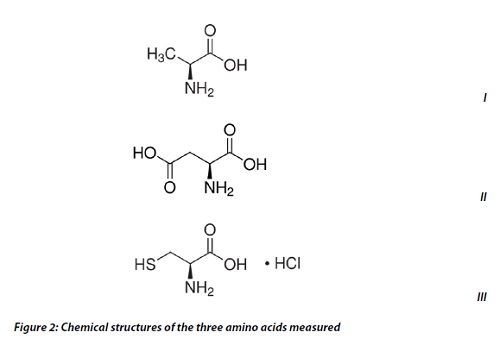
Figure 3a shows an overlay of representative spectra which were measured for the method development of each material. An overview PCA Scores plot for all three materials is shown in Figure 3b, illustrating that the materials are separated into unique clusters that were analyzed in this overview. Finally, Figure 3c shows a test set containing three measurements of each material projected onto the cysteine hydrochloride method. All three samples of Cysteine hydrochloride fall within the confidence interval while the other six spectra were clearly outside the Hotelling’s T2 ellipse at the 95% confidence level, also defined by the 5% significance level. Similar results are obtained for the method for the other two amino acids as well.

This result allows for the statistical determination of a “pass”/“fail” decision when analyzing a measured spectrum, as shown in Figure 4. In this case, the significance level used in the development of the method plays a similar role to the minimum HQI in library matching. To summarize the results of these models and demonstrate specificity, a proximity matrix is shown in Table 2 which demonstrates that when the test samples were run against each of the three methods, each one passed for its correct method.

Qualification of Potassium Carbonate and a Hydrate For materials that are chemically similar, a correlation approach may not provide definitive identification results, as similar spectra may have HQI values that vary only slightly. It has been shown that use of multivariate models and a p-value acceptance criteria can give much more definitive and reliable analysis results (5, 6).
The discrimination of potassium carbonate (K2CO3) (IV) from potassium carbonate sesquihydrate (K2CO3H2O) (V), which differ only in the presence of a water molecule, is a good example. Their Raman spectra are very similar, dominated by the in-phase CO3 stretch vibration at 1060 cm-1 as can be seen in figure 6. The sesquihydrate has multiple bands for the CO3out of plane deformation near 700 cm-1,and this is seen as a single peak at 688 cm-1 in the potassium carbonate. Because the HQI is based on spectral correlations that are not sensitive to subtle changes in data, these materials have HQI values of > 96 for both of the compounds, thus making use of HQI for unambiguous identification difficult, as shown in table 3.

To further analyze these compounds, methods were developed for each on the NanoRam (B&W Tek, Inc.). For each material, 20 Raman spectra were collected using 4 samples of the material, and the method builder automatically generated the PCA model based on spectral data upon completion of the 20 scans, resulting in a model rank such that 90% of the spectral variance is explained.
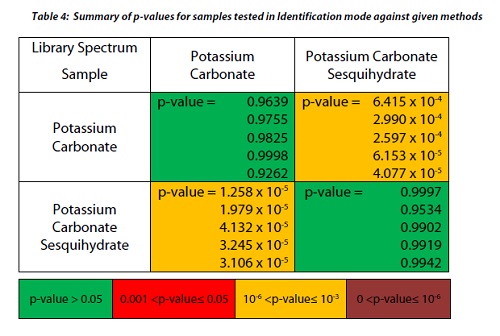
Samples were then tested in Identification Mode on the NanoRam (B&W Tek), which automatically projected the newly-collected Raman spectrum onto the selected PCA model (Method), and a pass/fail result (based on a 95% confidence) was reported based on the probability that a sample does match the method. When a “fail” result was obtained, the system automatically performed a spectral library search and probable matches were returned based on the HQI of the sample to materials that are in the system spectral library and methods library.

After the methods were developed for each compound, five samples of each where then tested against both methods with the NanoRam (B&W Tek, Inc.). The results shown in Table 4 definitively show that using the SIMCA method of material classification, we were able to qualify the identity of both potassium carbonate and its hydrate.
Conclusion
Current handheld spectroscopic analyzers use built in processing algorithms to automatically perform complex analysis, making these tools much more accessible to the general user. However, not clearly understanding the advantages and disadvantages of the various algorithms can lead to a misuse of the technology. Therefore, it is important to understand that both correlation and multivariate approaches to spectral analysis have their advantages and disadvantages depending on the goal of the measurement. HQI allows for the rapid comparison of a spectrum against a large library of spectra, making it ideal for analysis of unknown materials, whereas p-value is ideal for verifying and/or qualifying the identity of a “known” material. Multivariate analysis provides a much more robust methodology and has the added advantage of being able to discriminate between molecules which have structural similarities.
References
1. Raw Material Identity Verification in the Pharmaceutical Industry: B. Ustun; European Pharmaceutical Review, 13, (3), 2013.
2. An implementation Perspective on Handheld Raman Spectrometers for the Verification of Material Identity: B. Diehl, C.S. Chen, B. Grout, J. Hernandez, S. O’Neill, C. McSweeney, J. M. Alvarado and M. Smith, Pfizer Inc; European Pharmaceutical Review, Non-destructive Materials Identification Supplement, 17, (5), 2012, http://www.europeanpharmaceuticalreview.com/wp-content/uploads/Raman-Supplement-2012.pdf
3. Portable Raman Spectroscopy for Pharmaceutical Counterfeit Detection: R. Kalyanaraman, M. Ribick and G. Dobler, Bristol-Myers Squibb; European Pharmaceutical Review, Non-destructive Materials Identification Supplement, 17, (5), 2012, http://www.europeanpharmaceuticalreview.com/wp-content/uploads/Raman-Supplement-2012.pdf
4. Fake Pharmaceuticals: Bad Medicine, The Economist, October 13, 2012, http://www.economist.com/node/21564546
5. Portable Raman for Raw Material QC: What’s the ROI? E. Lozano Diz and R. J. Thomas, Pharmaceutical Manufacturing, January, 2013, http://www.pharmamanufacturing.com/articles/2013/006.html?page=1
6. The Benefits of a High-Performance, Handheld Raman Spectrometer for the Rapid Identification of Pharmaceutical Raw Materials, D. Yang and R. J. Thomas, American Pharmaceutical Review, December 6, 2012, https://www.americanpharmaceuticalreview.com/Featured-Articles/126738-The-Benefits-of-a-High-Performance-Handheld-Raman-Spectrometer-for-the-Rapid-Identification-of-Pharmaceutical-Raw-Materials/
7. Automated Spectral Searching in Infrared, Raman and Near-Infrared Spectroscopy, S.R. Lowry, in Handbook of Vibrational Spectroscopy, Vol. 3 Eds. J.M. Chalmers and P.G. Griffiths, pp. 1948-1960, Wiley, 2002.
8. Spectral Preprocessing for Raman Library Searching, J. Kauffman, J.D. Rodriquez, and L.F. Buhse American Pharmaceutical Review, 14, (4), 2011, https://www.americanpharmaceuticalreview.com/Featured-Articles/36904-Spectral-Preprocessing-for-Raman-Library-Searching/
9. Libraries, Classifiers, and Quantifiers: A Comparison of Chemometric Methods for the Analysis of Raman Spectra of Contaminated Pharmaceutical Materials, C.M. Gryniewicz-Ruzicka, J. Rodriguez, S. Arzhantsev, L.F. Buhse, J. Kauffman, J. Pharm. Bioan. Anal. 61, 191-198 (2013).
10. “Noninvasive identification of materials inside USP vials with Raman spectroscopy and a Raman spectral library”, R.L. McCreery, A. J. Horn, J. Spencer, and E. Jefferson , Journal of Pharmaceutical Science, 87, 1-8, 1998.
11. Champagne A. B., Emmel K. V., Rapid screening test for adulteration in raw materials of dietary supplements, Vibrational Spectroscopy, 55, 216-223, 2011
12. Pattern Recognition by Means of Disjoint Principal Component Models, S. Wold, Pattern Recognition 8, 127-139, 1976.
13. Classification of Chemically Modified Celluloses Using a Near-Infrared Spectrometer and Soft Independent Modeling of Class Analogies, O. Svensson, M. Josefson, and F. W. Langkilde, Applied Spectroscopy, 51, (12), 1826-1835 (1997)
14. Richard G. Brereton, Chemometrics for Pattern Recognition, Wiley, New York, 2009.
15. Chemical Systems Under Indirect Observation: Latent Properties and Chemometrics, S.D. Brown, Applied Spectroscopy 49, (12), 14A – 31A, 1995