Abstract
Accurate buffer preparation is a simple yet quintessential step towards developing robust biologics manufacturing processes. Many of the salts used in preparing buffers for purification of biologics are inherently hygroscopic. The accuracy of buffer preparation becomes more questionable over time as the buffer salt is exposed to more and more moisture. While ingress of moisture into salts is easily recognized by an increasing propensity to form clumps, it is difficult to measure them quickly. The handheld NIR spectrometer is a rapid and non-destructive tool that is used to determine the water content in buffer salts. This rapid and effective determination of water content is key in assessing buffer salts’ suitability for use during biologics manufacturing.
Introduction
Water plays an important role within pharmaceutical sciences. This simple yet fascinating molecule can interact with the individual excipients during a pharmaceutical manufacturing process in ways that can affect the quality of the final dosage form [1]. A large number of active pharmaceutical ingredients (API) and raw materials contain water that is either in adsorbed form (surface water) or bound as hydrate (water of crystallization). It is estimated that approximately one-third of known APIs are capable of forming a hydrated salt [2]. The amount of water in these materials can greatly influence the shelf life, stability, and also the pharmaceutical manufacturing process [3]. Salts such as sodium chloride, phosphates, etc., that are used in buffer preparations of cell culture media and in purification of biologics are inherently hygroscopic. The accuracy of buffer preparation and concentration becomes less reliable as the buffer salts are exposed to more and more moisture over time. The buffer action is inherently dependent on the pH of the solution and works consistently only when the concentration is well controlled. While ingress of moisture into salts is easily recognized by an increasing propensity to form clumps, it is difficult to measure the actual water content rapidly before the use of salts in biologics manufacturing. Therefore, it is desirable to have a rapid analytical method to measure the amount of water in the buffer salts during biologics manufacturing.
Typically, the amount of water in pharmaceutical materials is measured by Loss on Drying (LOD) or by Karl Fischer (KF) titration. Both methods have pros and cons in terms of accuracy, precision, speed, and ease of measurement. For example, KF titration is routinely used in quality control laboratories and is labor intensive, time consuming, and uses toxic chemicals [4]. The LOD method on the other hand is not very sensitive and lacks precision if the level of water is approximately below 0.1% wt/wt in a given sample. Other techniques, such as microwave resonance, are also known for measuring water content, but this technique is fairly new and not widely used in the pharmaceutical industry [5]. Importantly, all of these techniques are offline methods that cannot provide real-time water levels in pharmaceutical excipients and raw materials during a manufacturing process.
Even though there are several different portable spectrometers that are available, such as Raman and NIR, both based on vibrational spectroscopy, this article only focuses on portable NIR spectrometer for the determination of water content in salts. Water is weak Raman scatterer and therefore, is not a viable technique to determine water content in salts. The main peak centered around 1940nm in the NIR region for water is from the ν1 + ν2 combination band and is fairly a strong band.
In this article, a handheld portable near infrared (NIR) spectrometer is used to rapidly determine the water content (0.1 to 0.8% wt/wt) in sodium chloride salt. This range covers the USP36-NF31 limit of 0.5% wt/ wt for water in sodium chloride using USP <731> LOD method. The development and validation of the partial least squares (PLS) NIR calibration model is described in this article. The validated model is loaded into the portable NIR spectrometer which is routinely used for a limit test for water content in sodium chloride during the manufacture of biological drug substances.
Portable NIR Spectrometer
The portable NIR spectrometer used in this study has a tungsten lamp source and covers a spectral range of 1600 to 2400nm. This wavelength range covers most of the combination and first overtone bands which are the strongest in the NIR region. The measurement time for a spectrum is typically only five seconds and the spectral data can be transferred easily to a PC via a USB cable. The unit weighs approximately 3 lbs and uses a rechargeable lithium ion battery with a life of about 5 hours.
In contrast to a benchtop FT-NIR where there are many real-time operation restrictions including being a large instrument, needs longer time to acquire results, and difficult chemometrics software, the portable NIR is highly accessible, has easy-to-use chemometrics software, and the results are obtained within seconds. Calibration models are built outside the unit using the vendor-provided software which are then validated and then uploaded onto the unit for regular use.
Even though the NIR technique works in both transmittance and reflectance modes, the portable units are designed to operate only in the reflectance mode. The reflectance signal collected in NIR is diffuse reflectance in nature, and therefore probes both the surface and subsurface of a powder sample, in this case the sodium chloride salt. About 10g of sodium chloride sample is taken in a glass vial and the vial is placed on top of the NIR spectrometer. The spectra are collected, ensuring that the vial is held steady during the measurement.
The spectral resolution for the portable unit used in this present study ranges between 20 and 42cm-1, which is appreciably lower than a typical benchtop FT-NIR instrument with a resolution of 2cm-1. However, this lower spectral resolution was found not to be a limiting factor in using the portable spectrometer for water content due to the inherent broad spectral peak shape for NIR bands [6]. Because the NIR spectral bands are broad, data pretreatment is typically necessary to build the calibration model.
NIR Water Band
Sodium chloride is a simple ionic salt and therefore there are no spectral features in the NIR other than the water bands. As there is no interference from any other component, the sensitivity is greatly enhanced for the water bands. Figure 1 shows the NIR spectrum for water in a sodium chloride salt sample. The main peak centered around 1940nm is from the ν1 + ν2 combination band [7] from water. This peak is the primary peak used in the PLS quantitative calibration model.
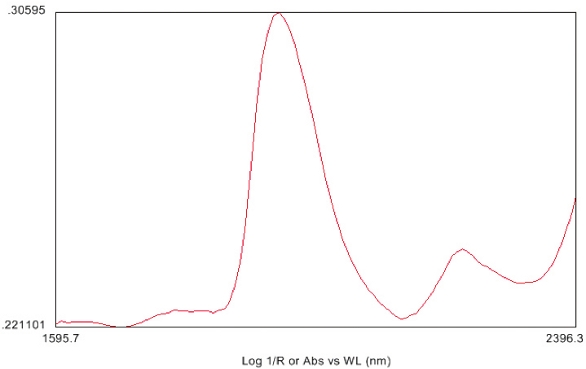 Figure 1. NIR Spectrum of Water in Sodium Chloride Buffer Salt
Calibration Standard Preparation
The first step in developing a NIR calibration model for water content in sodium chloride is to prepare the calibration standard samples. For this purpose, five different lots of sodium chloride from different suppliers were mixed in a shaker mixer for one hour to make a 150g sample. For each calibration level, about 30g of the sample was transferred to a clean glass jar and exposed in a closed glass container to different humidity conditions, achieved with water or saturated salt solutions [8,9]. A combination of saturated salt solution and/or water along with different exposure times was used to achieve different amounts of water (0.1-0.8% wt/wt) in sodium chloride, as given in Table 1. For each level, about 10g of calibration sample was taken in two different glass scintillation vials and five NIR spectra were collected for each vial using the portable spectrometer. Following this, LOD was performed using a thermogravimetric moisture analyzer for each of the 10g samples. The temperature was ramped to 160 °C in the moisture analyzer within 10 minutes and the loss in sample weight was measured to obtain the LOD values. These values were used as reference values in the NIR model for the calibration samples. A total of seven different calibration samples were prepared covering the range of 0.1-0.8% wt/ wt, with two samples at each level totaling 14 calibration standards. A level below 0.1% for the calibration was also used and was obtained by using the unexposed sodium chloride sample. Three samples were used for this purpose compared to the two used for the other seven levels. Therefore, a total of 17 calibration samples were used to build the NIR model.
Table 1. Conditions Used to Prepare the Sodium Chloride Calibration Standards

Calibration Model Development
As stated previously, 17 calibration samples were used to build the PLS model. Five spectra were collected from each sample totaling 85 calibration spectra. Several spectral pre-processing methods were used and compared to determine the conditions for the best calibration model. The final pre-processing conditions used for all 85 calibration spectra are given in Table 2.
Table 2. Spectral Pre-processing Conditions for Calibration Model

The pre-processed spectra along with the NIR calibration plot for all levels are given in Figures 2 and 3.
 Figure 2. Pre-processed Spectral Data for Calibration Standards
 Figure 3. PLS Calibration Model for Water Content in Sodium Chloride Using Portable NIR Spectrometer
Validation of the Calibration Method
For validation of the NIR method, accuracy, intermediate precision, and sample stability were assessed. A comparison of results between the moisture analyzer method and USP <731> LOD method was also made to verify the accuracy of the method. Results are summarized below.
Accuracy
For accuracy assessment, two samples at three different levels (~0.5, 0.7, and 0.9% wt/wt) were prepared using the conditions from Table 1, and five spectra collected for each sample. The calibration model was used to determine the water levels in these samples. The moisture analyzer was also used to determine the amount of water in these samples. The differences in the results between the NIR prediction using the calibration model and the moisture analyzer results for the two samples at each level are given in Table 3.
Table 3. Accuracy Results for the Three Water % wt/wt Levels
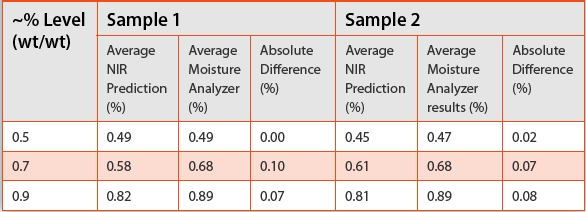
The maximum absolute difference in the amount of water using the NIR model and the moisture analyzer is about 0.1%, which is little more than twice of RMSECV. This error is about 20% (relative) to the USP specification limit of 0.5% wt/wt for moisture content in sodium chloride and is acceptable for a limit test method like this.
Intermediate Precision
Four samples were prepared ranging from 0.2 to 0.8% wt/wt using the conditions from Table 1. Two analysts tested each sample using the same portable NIR spectrometer, and the NIR predicted results from the calibration model are given in Table 4.
Table 4. Intermediate Precision Results for Water Content in Sodium Chloride

The maximum absolute % difference between the analysts is 0.04%, obtained at the lowest level (~0.2% wt/wt). This corresponds to a relative difference of approximately 20%, which is considered to be acceptable for this test at this level.
Sample Stability
One sample was prepared at ~0.50% wt/wt level and the NIR spectra were collected for this sample every hour for six hours. Five spectra were collected at each time point and the average NIR predicted results from the calibration model are given in Table 5.
Table 5. Sample Stability Results for ~0.50% wt/wt Water Content in Sodium Chloride
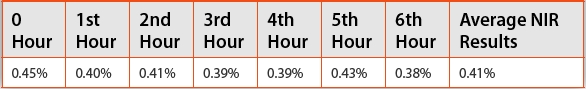
The intended purpose of the stability testing was to determine if there is a trend in the NIR predicted result as a function of time. As observed, the maximum result is 0.45% wt/wt at time 0, and the minimum is 0.38% wt/wt at the 6th hour. However, these results appear to be within the variability observed throughout the study and do not show any significant trend. Thus, the samples are considered to be stable for up to at least six hours.
Moisture Analyzer Method Comparison with USP <731> LOD
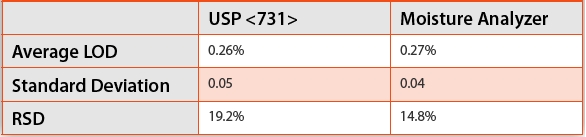
Results obtained by the moisture analyzer reference method were compared to those obtained by LOD by analyzing five samples prepared around ~0.3% wt/wt using both the methods. The average results for water % wt/wt using both the methods are given in Table 6. The standard deviation and RSD results from Table 6 indicate that the moisture analyzer method is comparable to the USP <731> LOD method and can be used as the reference method to build the NIR calibration model.
Table 6. Average LOD Results Using USP <731> and Moisture Analyzer
Conclusion
This article demonstrates that a portable NIR spectrometer can be used rapidly and in a non-destructive way to measure the amount of water in sodium chloride salt. Using reference values obtained with a moisture analyzer, one can build a PLS calibration model for the portable NIR to measure water content. Calibration standards (0.1-0.8% wt/wt) were prepared by exposing sodium chloride to various humidity conditions using water and different saturated salt solutions (sodium chloride, potassium chloride, and potassium nitrate) in a closed environment. Based on the results from the method validation, Savitzky-Golay, 1st derivative, 9-point smoothing, and 2nd order polynomial fit appears to be a suitable pre-processing condition for the calibration model. The success of the sodium chloride method leads us to develop a model for water content in anydrous dibasic sodium phosphate, another common salt used for buffer preparation in biologics manufacturing. These methodologies allow us to determine the suitability of raw materials not only upon receipt but also after storage to ensure that manufacturing is not negatively affected by excess moisture.
Author Biographies
Judith Rhea Punzalanis an analytical chemist at Bristol-Myers Squibb Company in Pharmaceutical Investigation and Technology group with Global Manufacturing and Supply. She received her B.S. in Chemistry from William Paterson University in 2011. She has been working with Bristol-Myers Squibb since 2012. Her work at Bristol-Myers Squibb is involved in developing and validating signatures using spectroscopy techniques, such as Raman and Near Infrared Spectroscopy (NIR), for product complaint testing and detecting pharmaceutical counterfeits. Her recent work has been focused on developing methods for moisture content in biologics raw materials using portable NIR spectrometer.

Nisha Patel is an analytical chemist at Bristol-Myers Squibb Company in Pharmaceutical Investigation and Technology group with Global Manufacturing and Supply. She received her B.S. in Biology from Temple University in 2011. She has been working with Bristol-Myers Squibb since 2012. Her work at Bristol-Myers Squibb is involved in developing and validating signatures using spectroscopy techniques, such as Raman and Near Infrared Spectroscopy (NIR), for product complaint testing and detecting pharmaceutical counterfeits. Her recent work has been focused on developing methods for moisture content in biologics raw materials using portable NIR spectrometer.

Abdelhady Elkhouga is a Senior Scientist at Bristol-Myers Squibb Company in Global Analytical Technology group with Global Manufacturing and Supply. He received his B.S. from the University of Alexandria Egypt, June 1982. He has been with Bristol-Myers Squibb since 1991. His recent work with Bristol-Myers Squibb has been focused on developing new and novel techniques to detect pharmaceutical counterfeits, raw material identification using vibrational spectroscopic techniques, such as Raman, mid and Near-Infrared (NIR).

Billie Herzer, Ph.D., is a Principal Scientist at BMS in the recovery and purification group in Hopewell, NJ. She joined BMS in 2010 with more than 13 years of experience in process development and process support for biopharmaceuticals. Billie has a diploma in genetics from the University of Basle and received her Ph.D. in cell biology and cancer research mangna cum laude from the University of Basle, Switzerland in 1997. Her career has allowed her to gain a broad understanding of all stages of process development as well as commercial process support. Billie considers herself fortunate in having built a solid foundation in a wide variety of topics from cGMP requirements, process analysis, Quality by Design, six sigma methodologies to scale-down modeling. This knowledge has proven beneficial in ensuring that newly developed processes are scalable and commercially viable and helped with a more systematic approach to troubleshooting.

Ravi Kalyanaraman, Ph.D., is an Associate Director at Bristol-Myers Squibb Company in the Global Analytical Technology group with Global Manufacturing and Supply. He received his Ph.D. from the University of Idaho in 1996 and did his post-doctoral work at the University of Puerto Rico. He has been with Bristol-Myers Squibb since 2002. His recent work with Bristol- Myers Squibb has been focused on developing new and novel techniques to detect pharmaceutical counterfeits, raw material identification using vibrational spectroscopic techniques, such as Raman, mid-, and nearinfrared (NIR). He also leads the analytical team that is involved in the analysis of products received from complaints and from corporate security groups. More recent work is involved with the application of using portable NIR spectrometer in Process Analytical Technology (PAT), especially for moisture content in biologics raw materials.
References
- A.C. Jorgensen; C.J. Strachan; K.H. Pollanen; V. Koradia; F. Tian; and J. Rantanen. J. Pharm. Sci. November 2009; 98(11): 3903-3932.
- U.J. Griesser. The importance of solvates: In: Hilfiker. R, Editor. Polymorphism in the Pharmaceutical Industry. 1st edition. Weinheim, Germany: Wiley-VCH, 2006; pp 211-233.
- F.J.S. Nieuwmeyer; M. Damen; A. Gerich; F. Rusmini; K. van der Voort Maarschalk; and H. Vromans. Pharm. Research October 2007; 24(10): 1854-1861.
- P. Bruttel and R. Schlink. Water Determination by Karl Fischer Titration; http://golik.co.il/ Data/WaterdeterminationbyKarlFischerTitration_1426721477.pdf.
- C.C. Corredor; D. Bu; and D. Both. Anal. Chim. Acta 2011; 696: 84-93.
- L. Herberholz; O. Kolomiets; and H.W. Siesler. NIR News May/June 2010; 21(4): 6-8.
- J. Workman, Jr. and L. Weyer. Practical Guide to Interpretive Near-Infrared Spectroscopy. CRC Press, 2008, Chapter 6, Water, pp 63-70.
- G. Quincot; M. Azenha; J. Barros; and R. Faria, Civil Engineering Department, University of Minho, Faculty of Engineering, University of Porto; http://paginas.fe.up.pt/~selco/wpcontent/ uploads/2011/11/Containers-Report-Rev02.pdf, 2011.
- http://www.omega.com/temperature/z/pdf/z103.pdf