Introduction
Over the past decade, Raman spectroscopy has become a “household name” in the pharmaceutical industry mainly because of its widespread use in areas such as incoming material inspection,1-4 counterfeit/adulterated drug screening,5-6 and process monitoring.7-8 Lesser known is how heavily Raman spectroscopy is being investigated in the biomedical industry as a screening tool for various diseases including cancer.9-16 In this article, we discuss the intersection of these 2 industries by looking at an application in which an off-patent drug undergoes a chemical change within patients who have cancer which can be detected in urine via Raman spectroscopy.17
Background
There is now strong empirical evidence demonstrating a correlation between an upregulation of the spermidine/spermine N1-acetyltransferase (SSAT1) enzyme and the presence of various cancers, including lung cancer, in mammals.18-20 SSAT1 is present in cells in very low concentrations, making it very difficult to detect activity levels, until Dr. Sitar and Dr. Bras from the University of Manitoba developed and later patented a method of detection based on acetylation of the drug amantadine as a smart probe to measure the cell biology.21-24 Amantadine is considered a smart probe in this case because, after acetylation, it will not enter into any catabolic or anabolic reaction, nor accumulate in the body. As a result, when the blood is filtered by the kidney, the N-acetylamantadine in the urine is a true metabolite that is directly proportional to the enzymatic activity of SSAT1. For the past 10 years, there have been numerous clinical studies performed around the world aimed at validation of this method for cancer detection and screening.25-29 Currently, clinical results are extremely promising using methods such as solid phase extraction (SPE) and liquid chromatography combined with tandem mass spectroscopy (LC-MS/MS) for the detection of N-acetylamantadine in urine.
In a recent correspondence with the authors, Dr. Sitar, currently a Professor Emeritus in the Department of Pharmacology and Therapeutics at the University of Manitoba, stated “Our initial goal was to understand the mechanism of amantadine acetylation, since initial studies ruled out the acetyltransferases NAT1 and NAT2 as contributing enzymes. With the demonstration that it was SSAT1 that specifically catalyzed acetylation of amantadine, the biological relevance to cancer and its use as a biomarker for this disease category became apparent to us.” Dr. Sitar continued, saying, “Subsequently, research studies have provided data in support of this hypothesis [as previously noted in this article]. Lately, focus has been modified to identify more economical detection methods that would make the test available to a greater proportion of the world’s population.”
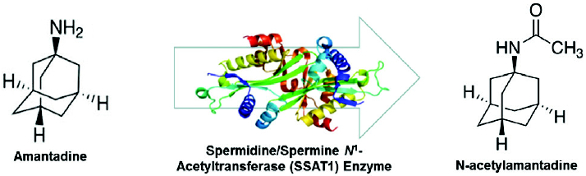 Figure 1. Representation of the acetylation of amantadine in mammalian cells.
While traditional chemistry techniques such as LC-MS/MS work well for the detection of N-acetylamantadine in urine, when it comes to mass deployment, they suffer from 2 major drawbacks: cost and complexity. For this reason, there is a great deal of interest in finding an alternative method for the quantitation of N-acetylamantadine in biological samples, especially urine, that is low-cost, compact, and able to be operated by a laboratory technician, thus enabling large-scale clinical studies to determine the specificity and sensitivity for various cancers. The method currently showing the most promise as an alternative to the traditional methods is Raman spectroscopy. Since Raman spectroscopy probes the various vibrational and rotational modes of a molecule, it is ideal for differentiating similar molecules with different functional groups. Additionally, Raman spectroscopy is ideally suited for biological samples due to its inherent insensitivity to aqueous interference, unlike infrared spectroscopies. When asked about the potential of Raman spectroscopy for detection of N-acetylamantadine, Dr. Sitar was recently quoted by the Royal Society of Chemistry in Chemistry World as stating, “This detection strategy is more economical than the currently used LC/MS approach, and enables development of an easy-to-use point-of-care tool that should provide more rapid turnaround to the health care provider.”30
Surface Enhanced Raman Spectroscopy
While Raman spectroscopy is known to provide a high degree of selectivity and specificity for molecular identification, it is not known as a high sensitivity method for identifying trace amounts of a substance. This is seemingly a major issue in the detection of N-acetylamantadine in urine because it is present in concentrations on the ng/mL level. Fortunately, there exists a well-established method of signal enhancement by several orders of magnitude known as surface enhanced Raman spectroscopy (SERS).31 In fact, SERS has been shown to allow Raman spectroscopy to be performed on single molecules.32
For the initial research into the viability of SERS to detect the presence of N-acetylamantadine in urine, a commercially available gold SERS substrate was evaluated by Dr. Gordon’s and Dr. Hof’s groups at the University of Victoria utilizing mock urine spiked with N-acetylamantadine. Initial samples were pipetted onto the gold substrates and, after drying, were analyzed using a fiber-optic Raman probe coupled with a wavelength stabilized 785-nm laser and miniature spectrometer with a TE cooled back-thinned CCD detector.
 Figure 2. Molecular structure of beta-cyclodextrin.
Initial results fell well short of the desired detection limit of 1 ng/mL leading the researchers to functionalize the substrates with the capture molecule beta-cyclodextrin. As shown in Figure 2, this particular molecule forms a cone-like shape with a hydrophobic interior and a hydrophilic exterior, which is ideal for this application because it can be dissolved in water while capturing the hydrophobic analyte, keeping it close to the surface of the substrate. In addition, they decided to submerge the substrate in the mock urine for 4 hours to allow sufficient time to be captured by the beta-cyclodextrin. This work, which was recently published in Analyst, 17 has successfully shown detection for concentrations as low as 1 ng/mL in the absence of steroids.
Translational Research
Building on the success of the initial research at the University of Victoria, the translational phase of the research investigates the potential of this technology to take the leap from laboratory bench to clinicians’ offices. This phase of the research contained 2 main objectives:
- Identification of a low-cost disposable SERS substrate.
- Proof of principal demonstration of a compact and transportable SERS reader capable of detecting N-acetylamantadine in solution.
For the first objective, we evaluated a new SERS technology out of the University of Maryland which utilizes gold nanoparticles suspended in liquid, printed on paper via an inkjet printer cartridge.33-34 This new form of SERS substrate is called paper SERS, or simply pSERS.
These pSERS substrates offer 2 major advantages for the detection of N-acetylamantadine in urine over traditional gold substrates. First, they are significantly cheaper to manufacture, making them ideal for disposable applications. Second, and perhaps more important, due to the capillary effect, these substrates naturally absorb liquid samples and concentrate the analyte, allowing the sample preparation to be simplified to a relatively quick dip test.
To validate the ability of pSERS substrates to enhance the Raman signal of N-acetylamantadine in solution, we used slide-mounted pSERS (for convenience) and pipetted a small volume of the sample onto the paper. After drying, we also applied a small amount of hydrochloric acid in order to slightly lower the pH of the sample and increase the efficacy of the substrate. Next, we collected the spectra shown in Figure 3 using the same set-up as was used at the University of Victoria. From this data, the dominant 740-cm-1 vibrational band of the analyte is clearly visible.
 Figure 3. pSERS spectrum of 5 mg N-acetylamantadine.
 Figure 4. (a) pSERS slide holder with adjustable focus, and (b) Class I Raman spectrometer for analysis of slide-mounted pSERS substrates.
Finally, a prototype system was developed that was low-cost, transportable, and easy-to-use. For this, the need to both maximize the collection efficiency while simultaneously minimizing the form factor was recognized, making it imperative to maximize the throughput of the optical systems. As a result, an integrated Raman probe was utilized, including the laser as well as filtering and collection (excitation) optics, which had been shown to be 3× to 5× higher throughput than the traditional fiber Raman probe used in the previous work. The probe was coupled to a high-throughput f/1.3 transmission spectrometer, chosen due to the fact it has approximately 10× higher throughput than the spectrometer used for the laboratory tests and is approximately half the size. Next, an inverted slide holder was designed (slide-mounted pSERS were again chosen for convenience), shown in Figure 4(a), to position the pSERS substrate at the focus of the laser. This slide holder also includes a micrometer which can adjust the position of the sample in the z-dimension to assure the sample is always at the optimal focus.
After specifying the appropriate spectrometer, laser, probe optics, and sample holder, the system was integrated into a Class 1 enclosure shown in Figure 4(b) with a 12VDC power connector and USB interface on the back of the unit. This unit was able to easily detect the 740-cm-1 vibrational band of N-acetylamantadine at concentrations of 1 µg/mL, as shown in Figure 5, without any functionalization of the substrate or concentration methodology (ie, the dip approach). Figure 5 shows the spectrum collected from the unit with 2 µL of the analyte pipetted on the substrate, with an additional 2 µL of 0.1% HCL applied after drying.
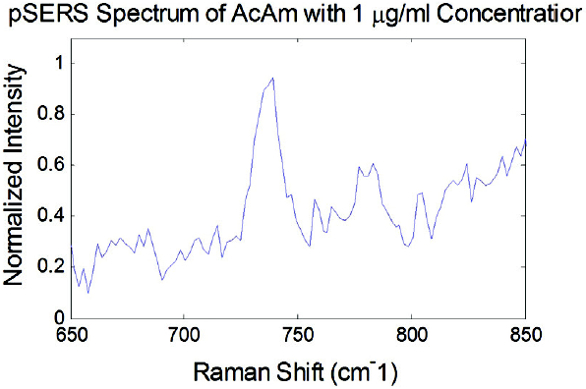 Figure 5. pSERS Raman spectrum of 2 μg of N-acetylamantadine measured using the system shown in Figure 4.
In the upcoming months, we plan to further increase the sensitivity of this device by having the pSERS nanoparticles functionalized with beta-cyclodextrin, and using a dip approach to take advantage of the capillary effect for concentration of the sample. In addition to the pSERS substrates, we will also continue to refine the Raman spectrometer in parallel. Lastly, we are working in collaboration with a team at the University of Waterloo to develop a software interface which will allow for an operator to get a simple “red light/yellow light/green light” readout from a single click. During the course of this collaboration we are also planning to develop a wireless connectivity system which will allow the data from the instrument to instantaneously be uploaded to a clinician’s smartphone or tablet as well as electronic medical records systems.
Final Thoughts
The approach detailed above indicates the potential for detection of pre-visible/pre-symptomatic cancer, by detecting the chemical signature of the acetylation process corresponding to the upregulation of SSAT1 in the presence of cancer. Additional research is still needed to prove equivalency between the traditional wet chemistry methods currently being utilized in clinical investigations and the Raman spectroscopy methods proposed in this article, but it currently shows the greatest potential for mass deployment of this technology. This is especially true in the developing world where access to advanced laboratory space and sample preparation (such as drying) is extremely limited.
Currently, we envision the Raman spectroscopic method of quantitating N-acetylamantadine in urine to be used as a clinical screening tool. In this case, the mass deployed Raman system would be used to identify the need for more detailed analysis via wet chemistry techniques such as LC-MS/MS and/or traditional pathology. By utilizing these 2 techniques in tandem, this method has the potential to help revolutionize early cancer detection and, as a result, save lives.
References
- Lozano Diz E and Thomas RJ. Portable Raman for raw material QC: What’s the ROI? Pharmaceutical Manufacturing Magazine. 2013;12(1):30-34. Available at: http://www. pharmamanufacturing.com/articles/2013/006/. Accessed November 18, 2014.
- Diehl B, Chen CS, Grout B, et al. An implementation perspective on handheld Raman spectrometers for the verification of material identity. Eur Pharm Rev. Non-destructive Materials Identification Supplement. 2012;17(5):3–8. Available at: http://www. europeanpharmaceuticalreview.com/wp-content/uploads/Raman-Supplement-2012. pdf. Accessed November 18, 2014.
- Yang D and Thomas RJ. The benefits of a high-performance, handheld Raman spectrometer for the rapid identification of pharmaceutical raw materials. Am Pharm Rev. 2012;15(7):S22-S26. Available at: http://www.americanpharmaceuticalreview. com/Featured-Articles/126738-The-Benefi ts-of-a-High-Performance-Handheld-RamanSpectrometer-for-the-Rapid-Identifi cation-of-Pharmaceutical-Raw-Materials/. Accessed November 18, 2014.
- Bakeev KA, Chimenti RV. Pros and cons of using correlation versus multivariate algorithms for material identification via handheld spectroscopy. Eur Pharm Rev. 2013. Available at: http://media.europeanpharmaceuticalreview.com/wp-content/uploads/Bakeev-WebArticle_proof.pdf. Accessed November 18, 2014.
- 5. Kalyanaraman R, Ribick M, Dobler G. Portable Raman spectroscopy for pharmaceutical counterfeit detection. Eur Pharm Rev. Non-destructive Materials Identification Supplement. 2012;17(5):11–15. Available at: http://www.europeanpharmaceuticalreview.com/wpcontent/uploads/Raman-Supplement-2012.pdf. Accessed November 18, 2014.
- Kauffman J, Gryienwicz-Ruzicka CM, Arzhantsev S, et al. Pharmaceutical surveillance with rapid spectroscopic screening technologies. Am Pharm Rev. 2010;13(1):58-64. Available at: https://www.americanpharmaceuticalreview.com/Featured-Articles/117601- Pharmaceutical-Surveillance-with-Rapid-Spectroscopic-Screening-Technologies/. Accessed November 18, 2014.
- Mungikar A, Kamat M. Use of In-line Raman spectroscopy as a non-destructive and rapid analytical technique to monitor aggregation of a therapeutic protein. Am Pharm Rev. 2010;13(7):78-83. Available at: https://www.americanpharmaceuticalreview.com/ Featured-Articles/37071-Use-of-In-line-Raman-Spectroscopy-as-a-Non-destructiveand-Rapid-Analytical-Technique-to-Monitor-Aggregation-of-a-Therapeutic-Protein/. Accessed November 18, 2014.
- De Beer T, Burggraeve A, Fonteyne M, Saerens L, Remon JP, Vervaet C. Near infrared and Raman spectroscopy for the in-process monitoring of pharmaceutical production processes. Int J Pharm. 2011;417(1-2):32-47.
- Thomas RJ, Bakeev KA, Claybourn M, Chimenti RV. The use of Raman spectroscopy in cancer diagnostics. Spectroscopy. 2013;28(9):36-43. Available at: http://www. spectroscopyonline.com/spectroscopy/Articles/The-Use-of-Raman-Spectroscopy-inCancer-Diagnostic/ArticleStandard/article/detail/822977. Accessed November 18, 2014.
- Fenn MB, Xanthopoulos P, Pyrgiotakis G, Grobmyer SR, Pardalos PM, Hench LL. Raman spectroscopy for clinical oncology. Advances in Optical Technologies. 2011;2011:1-20. Available at: http://www.hindawi.com/journals/aot/2011/213783/. Accessed November 18, 2014.
- Jing N, Lipert RJ, Dawson GB, Porter MD. Raman nanoparticle probes for antibody-based protein detection in tissues. Anal Chem. 1999:71(21):4903–4908.
- Tu Q, Chang C. Diagnostic applications of Raman spectroscopy. Nanomedicine. 2012;8(5):545–558.
- Choo-Smith LP, Edwards HGM, Endtz HP, et al. Medical applications of Raman spectroscopy: from proof of principle to clinical implementation. Biopolymers. 2002;67(1):1–9.
- Granger JH, Granger MC, Firpo MA, Mulvihill SJ, Porter MD. Toward development of a surface enhanced Raman scattering (SERS) based cancer diagnostic immunoassay panel. Analyst. 2013;138(2):410–416.
- Horsnell JD, Smith JA, Sattlecker M, et al. Raman spectroscopy—a potential new method for the intra-operative assessment of axillary lymph nodes. The Surgeon. 2011;10(3):123–127.
- Horsnell JD, Stonelake P, Christie-Brown J, et al. Raman spectroscopy—a new method for the intra-operative assessment of axillary lymph nodes. Analyst. 2010;135:3042-3047.
- Cao G, Hajisalem G, Li W, Hof F, Gordon R. Quantification of an exogenous cancer biomarker in urinalysis by Raman spectroscopy. Analyst. 2014;139:5375-5378.
- Casero RA, Pegg AE. Spermidine/spermine N1-acetyltransferase—the turning point in polyamine metabolism. The FASEB Journal. 1993;7(8):653-61.
- Pegg AE. Spermidine/spermine-N1-acetyltransferase: a key metabolic regulator. Am J Physiol Endocrinol Metab. 2008;294:E995–E1010.
- Wallace HM, Fraser AV, Hughes A. A perspective of polyamine metabolism. Biochem J. 2003;376(Pt 1):1-14.
- Aversa G, Bux R, Cheng B, Ramjiawan B, Sitar DS. Monoclonal antibody for acetylamantadine—Canadian Patent Application No. 2,835,506, Chinese Patent Application No. 201280024582.6, European Patent Application No. 12782078.5. United States Patent Application No. 14/116,743.
- Bras A, Sitar DS. A method for assaying the activity of spermidine/spermine N1-acetyltransferase—PCT Application No. PCT/CA2012/050828.
- Gordon R, Cheng DB, Bux R, Ramjiawan B, Ahmed A, Hof F. Detection and quantification of acetylamantadine in urine samples—PCT Application No. PCT/CA2014/050273.
- Cheng B. An immunological assay to detect and quantify acetylamantadine in a patient—United States Provisional Patent Application No. 61/871,642.
- Pabbies A, Blakley B, Bras A, Sitar DS. (2005). Salivary and urinary excretion of acetylamantadine in patients with head and neck cancer. Residents’ Research Day— Otolaryngology, St. Boniface Hospital Research Centre, May 20, 2005; Winnipeg, Manitoba.
- Sitar DS, Bras AP, Maksymiuk A, Pabbies A, Brandes L, Blakley BW. Amantadine acetylation as a biomarker for malignancy. Clin Pharmacol Ther. 2006;79(2) P10, PI–12.
- Sitar D, Bras AP, Maksymiuk A, Pabbies A, Brandes L, Blakley BW. Amantadine acetylation and malignancy. Molecular Medicine Tri-Conference; Febuary 28—March 2; 2007; San Francisco, CA.
- Sitar DS, Bras AP, Maksymiuk A, Pabbies L, Brandes L, Blakley BW. (2008). Amantadine acetylation in cancer patients and utility as a diagnostic biomarker. World Conference on Clinical Pharmacology and Therapeutics; July 30; 2008; Quebec City, QC.
- Sitar DS, Bras AP, Maksymiuk A, Cheng, KM, Zhou H. Progress in the development of SSAT1 activity as a biomarker for diagnosis of cancer. BIT Life Sciences 2nd World Cancer Congress Proceedings; June 22-25, 2009; Beijing, China.
- Lim KLH. Urine test could catch lung cancer early. Chemistry World. 5 September 2014(30).
- McNay G, Eustace D, Smith WE, Faulds K, Graham D. Surface-enhanced Raman scattering (SERS) and surface-enhanced resonance Raman scattering (SERRS): A Review of Applications. Appl Spectroscopy. 2011;65(8):825–837.
- Kneipp K, and Kneipp H. Single molecule Raman scattering. Appl Spectrosc. 2006;60(12):322A-334A.
- Hoppmann EP, Yu WW, White IM. Inkjet-printed fluidic paper devices for chemical and biological analytics using surface enhanced Raman spectroscopy. Journal of Selected Topics in Quantum Electronics. 2014;20(3):195-204.
- Hoppmann EP, Yu WW, and White IM. Highly sensitive and flexible inkjet printed SERS sensors on paper. Methods. 2013;63(3):219-224.
Author Biographies
Robert V. Chimenti currently holds the position of Sr. Strategic Applications Engineer at Innovative Photonic Solutions, focusing on laser-based spectroscopy applications with a particular emphasis on Raman spectroscopy. He has earned a MS in Electro-Optics from the University of Dayton and has 10 years of experience in the fields of spectroscopy and laser technology. Additionally, he is an Adjunct Professor in Rowan University’s Department of Physics and Astronomy teaching photonic-based courses.
James Elliott, BSc, BASc, MESc, is currently an engineering consultant at BioMark Diagnostics Inc., responsible for device development and commercialization. Mr. Elliott’s engineering efforts in the medical device industry since 1988 have allowed for a wide range of novel product realizations in the diagnostics and therapeutics sectors. Most recently, Mr. Elliott has worked through Innovative Photonic Solutions to innovate a p-SERS device to be used in Cancer detection applications.
Rashid A. Bux is the founder and CEO of BioMark Diagnostics Inc. Previously he co-founded and served as COO of Optima Health and KKT Spine Centers. He earned a MBA from the University of Western Ontario, and was a medical student at Nairobi University prior to pursuing a business degree. Mr. Bux has co-authored several articles and holds numerous patents related to cancer diagnostics and therapeutics applications.