Abstract
Vaccine manufacturing is a lengthy and labor-intensive process that can take up to 22 months from raw material stage to release of the final product. Therefore robust, rapid and reliable analytical methods for product identification and characterization are essential to monitor the entire process. Portable and non-invasive tools provide additional benefits to analyze raw materials and in-process samples for product manufacturing that involves multiple facilities. This allows testing of samples with minimal delay between sampling and the actual testing, thus reducing cycle times. In this study, a portable Raman spectrometer was used to develop a method to identify raw materials and other components of vaccine products within the manufacturing chain. We demonstrate that novel vaccine candidates can be monitored using portable Raman spectroscopy at different stages of the manufacturing process.
Keywords
Raman spectroscopy, vaccine, method development, portable, Good Manufacturing Practices, raw materials
Introduction
Manufacturing of vaccines is a lengthy and labor-intensive process that involves numerous steps (Figure 1). This entire process can take from 6 to 22 months1 and each step needs the appropriate controls to comply with the standards of Good Manufacturing Practices (GMP).2 Upon completion of these steps, the vaccine is released for human use.
 Figure 1. Manufacturing chain of a vaccine
Considering the complexity and duration of vaccine manufacturing, it is important to establish reliable analytical tools to identify the different vaccine components in addition to other quality control measures.3 In most circumstances, selection of analytical techniques depends on the nature and environment of the analyte(s). In this study, Raman spectroscopy was used to identify and characterize raw materials, intermediates and formulated vaccine.
The Raman effect is caused by the inelastic scattering of electromagnetic radiation, whereby the scattered photons have different energies versus the incoming photons. Each compound has a characteristic “fingerprint” Raman spectrum that can be verified against a library of spectra collected from known compounds. Raman spectroscopy was previously limited to specialized laboratories and considered an unwieldy technique due to the long acquisition time to record a spectrum and the stringent requirements of the technique.4 In recent years, Raman spectroscopy has become more usable due to advances in lasers, filtering technologies and detectors, and is now used as major research tool for process monitoring and quality control.5 Moreover, Raman can be performed non-destructively in solid, liquid or gaseous states with no or minimal sample preparation or manipulation. Raman spectroscopy using a portable device was applied in this study to assess its feasibility on different vaccine components and product stages.
Methods
Raman spectroscopy was performed using a portable Raman system equipped with a 785 nm laser. The spectra were collected using a Raman shift of 200 to 3200 cm-1. The exposure time and laser output were optimized such that the spectral intensity was at the maximum for the given sample to identify all spectral features. This was important to trace minor contributions to the overall spectrum for consistency. All tested samples taken from different stages of the manufacturing process and were measured directly without further modification or preparation. The samples were tested using screw cap glass vials in a vial holding assembly that blocks ambient light during measurements. Data acquisition and analysis was performed with the instrument software where baseline correction was applied for all measured spectra with a lambda factor of 6500.
Results and Discussion
All samples analyzed for this study represent different com-ponents of the vaccine candidate manufacturing chain. This includes raw materials, intermediates, adjuvants, the drug substance, and the formulated vaccine drug product.
In a Raman spectrum, the wave number position indicates different vibrational states of the sample while the width of the peaks describes the structural details at the molecular level. Cyclohexane and acetaminophen were routinely used as standards to verify the instrument suitability. The recorded spectra shown in Figure 2 were compared to the literature data. The Raman peaks for cyclohexane (Table 1) are in agreement with previously reported values.6 The main peaks of acetaminophen are amide I (C=O) at 1650 cm-1, N-H stretch at 1612 cm-1, amide II at 1556 cm-1, C-H bend at 1325 cm-1, ring breathing at 850 cm-1, and phenyl ring stretch at 800 cm-1. 7-9
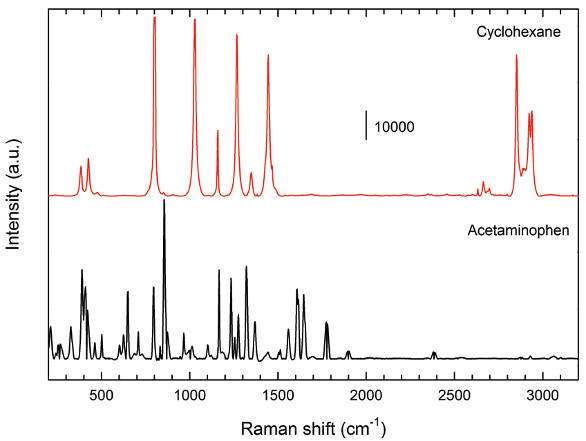 Figure 2. Raman spectra for cyclohexane (red trace) and acetaminophen (black trace) system suitability controls. The spectra are off set vertically for clarity.
The spectra, as expected, clearly showed Raman active features for cyclohexane and acetaminophen that established the system’s suitability. Subsequently, Raman spectroscopy was used to identify and characterize different vaccine components. A synthetic peptide and the oligonucleotide used as raw materials for a vaccine adjuvant showed distinct spectral features associated with the backbone as well as other vibrational modes (Figure 3). The peptide component showed Raman peaks for amide I (1666 cm-1) and amide III (weak 1244 cm-1) with other vibrational modes as assigned in Table 1.
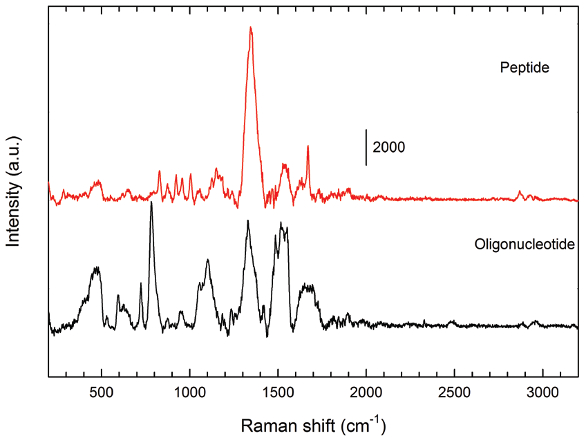 Figure 3. Raman spectra for synthetic peptide (red trace) and synthetic oligonucleotide (black trace) vaccine adjuvant components. The spectra are off set vertically for clarity.
Table 1. Peak positions and tentative assignments of Raman bands for cyclohexane and acetaminophen system suitability controls

In the case of the oligonucleotide, O-P-O stretch, dA (deoxynucleotide) and PO2 ¯symmetric stretch were observed at 783, 720 and 1100 cm-1, respectively. These spectral features can be used as fingerprints to identify these raw materials during the manufacturing process.
Raw materials for a different vaccine component also showed characteristic Raman spectra (red trace in Figure 4). Upon formulation of the raw material to make the vaccine component, additional changes in the spectrum were evident (black trace in Figure 4). The vaccine buffer is not part of the vaccine component, and therefore has distinct spectral features (gray trace in Figure 4).
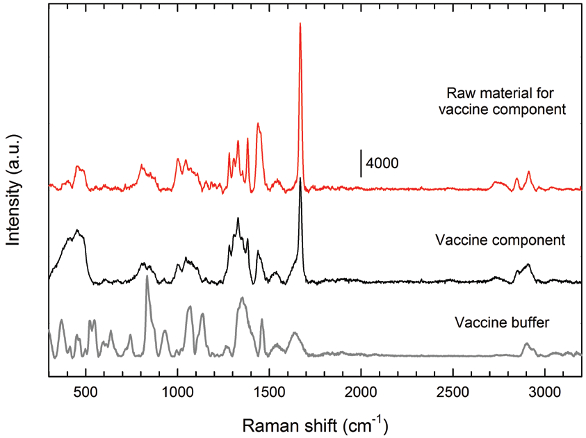 Figure 4. Raman spectra for one of the raw material (red trace), vaccine component (black trace) and vaccine buffer (gray trace). The spectra are off set vertically for clarity.
Upon formulation of the raw material to make the vaccine component, spectral differences around 800-1300 cm-1 were observed (compare red and black trace in Figure 4). Only the backbone C=C stretching at 1668 cm-1 was preserved in both raw material and vaccine component. On the other hand, the vaccine formulation buffer showed COH bend, C-O stretch, C-C stretch and CCO bend features at 1130, 1064, 836 and 520-550 cm-1, respectively, for sucrose that was used as an excipient, in agreement with earlier reported values.10
During the manufacturing process, the drug substance containing the viral antigen and the vaccine buffer was prepared prior to formulation of the vaccine product. Upon formulation, the vaccine product showed significant changes in Raman spectrum compared to the drug substance, consistent with altered intermolecular interactions resulting in changes in polarizability of molecules (Figure 5). The two spectra showed major differences at wavenumbers below 1700 cm-1. Most of the spectra can be compared directly for identification purposes without the need for deconvolution, making the analysis rapid. The drug substance contains proteins which gave prominent Raman peaks for C-H stretch and amide I at 2900 and 1650 cm-1, respectively. This is in line with similar studies of proteins reported elsewhere.11 Tyrosine peaks were also observed at 638 and 831 cm-1 with non-aromatic side chains at 1131 cm-1.12 Also, the peaks from the vaccine buffer spectrum (gray trace in Figure 4) are present in the drug substance spectrum with different intensities due to changes in the local environment (red trace in Figure 5).
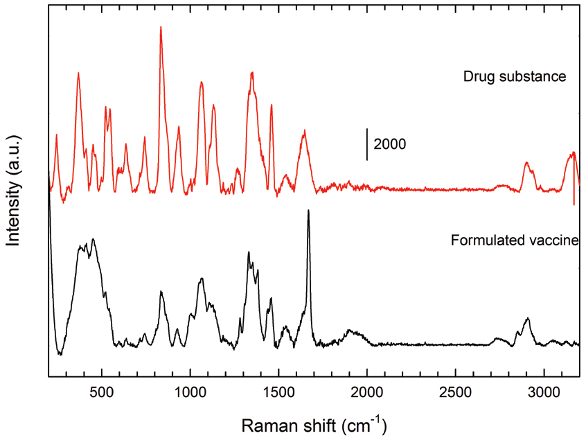 Figure 5. Raman spectra for drug substance (red trace) and formulated vaccine (black trace). The spectra are off set vertically for clarity.
Formulated vaccines may have many individual components and thus display complex Raman spectra containing features from each component. Raman peaks in such samples can be shifted in frequency due to changes in the local environment of the functional groups and molecular bonds as a result of formulation.
In some of the tested samples fluorescence from glass containers masked the underlying spectral features which otherwise could have been used for comparison across different samples (data not shown). This was partly due to low concentrations of the analytes and also the back-scattering configuration of the instrument for the collection beam from the analyte. The fluorescence effect can be reduced by using long-wavelength lasers.13-15 However, the intensity of the Raman signal is proportional to the 4th power of the laser frequency; thus intensity of the signal drops as the laser wavelength increases.4 To overcome these limitations, further experiments are underway aimed at minimizing the effects of glass fluorescence while maintaining resolution of the Raman spectra.
Conclusion
A portable Raman spectrometer was successfully used to identify various key components of vaccine products at different stages of the manufacturing process. While glass fluorescence obscured the spectra in some cases, it was still possible to identify vaccine components and raw materials and to distinguish between different products and product stages. In addition, interactions between different product components can be studied via changes in the environment of molecular bonds or functional groups that would lead to shift in the Raman peaks or appearance of new peaks. Portable Raman spectroscopy is a promising method to identify and characterize vaccine components faster and in a non-invasive manner throughout the vaccine manufacturing chain.
Acknowledgement
This work was supported by SanofiPasteur Ltd. We would like to thank Lillian Li and Roger Brookes, SanofiPasteur Ltd. for generously providing the samples for this study.
Conflict of interest
The authors are the employees of SanofiPasteur Ltd. The authors have no other relevant affiliations or financial involvement with any organization or entity with a financial interest in or financial conflict with the subject matter or materials discussed in the manuscript. Thus includes employment, consultancies, stock ownership or options, or royalties. No writing assistance was utilized in the production of this manuscript.
References
- C. Gerdil, Vaccine, Vol 21, 2003, pp. 1776–1779.
- K. T. Patel and N. P. Chotai, J Young Pharm., Vol. 3(2), 2011, pp.138–150.
- CHMP. Guideline on requirements for quality documentation concerning biological investigational medical products in clinical trials. European Medicines Agency, London, UK 2012. Available from: http://www.ema.europa.eu/docs/en_GB/document_library/Scientific_guideline/2012/05/WC500127370.pdf. Accessed on 06Jul2016
- P. Vandenabeele, Practical Raman Spectroscopy – An Introduction, 2013, John Wiley & Sons, Ltd.
- F. Adar, R. Geiger, J. Noonan, Appl Spectrosc Rev 1997;32:4-101
- R. L. Owen, A. R. Pearson, A. Meents, P. Boehler, V. Thominet, and C. Schulze-Briese, J. Synchrotron Radiat., 16, 2009, pp. 173-182.
- V. G. Borio, R. Vinha Jr., R. A. Nicolau, H. P. M. de Oliveira, C. J. de Lima, and L. Silveira Jr., Spectrosc. Int. J., Vol. 27, 2012, pp. 215-228.
- J. P. Pestaner, F. G. Mullick, and J. A. Centeno, J. Forensic. Sci., Vol. 41, 1996, pp. 1060-1063.
- C. Shende, W. Smith, C. Brouillette, and S. Farquharson, Pharmaceutics, Vol. 6, 2014, pp. 651-662.
- M. Mathlouthi, and D. V. Luu, Carbohydr. Res., Vol. 81, 1980, pp. 203-212.
- G. J. Thomas Jr., Annu. Rev. Biophys. Biomol. Struct., Vol. 28, 1999, pp. 1-27.
- P. Ruokola, E. Dadu, A. Kazmertsuk, H. Häkkänen, V. Marjomäki, and J. A. Ihalainen, J. Virol., Vol. 88, 2014, pp. 8504-8513.
- D. B. Chase, J. Am. Chem. Soc., Vol. 108, 1986, pp. 7485-7488.
- T. Hirschfeld and B. Chase Appl Spectrosc., Vol. 40, 1986, pp. 133-137.
- O. F. Nielsen, Biotechnology: Pharmaceutical Aspects Vol. III, 2005, pp. 167, Eds. Jiskoot, W. and Crommelin, D. J. A. AAPS PRESS, USA.
Author Biographies
Sasmit Deshmukh is an Associate Scientist at SGS Canada and SanofiPasteur Ltd., Toronto, ON. He received his PhD in Chemistry at Concordia University, Montreal, QC. He has over 8 years of extensive multidisciplinary research experience in chemistry, biochemistry and biophysics.
Kamaljit Bhandal is an Associated Scientist in the Biochemistry Platform, Analytical R&D North America, SanofiPasteur Ltd. He completed his Master of Biotechnology at University of Toronto and his undergraduate studies at McGill University. Before joining SanofiPasteur, Kamaljit has worked with pre-clinical studies at Charles River Laboratories.
Bruce Carpick is Director, Biochemistry Platform, Analytical R&D North America, SanofiPasteur Ltd., Toronto, Ontario. He has more than 17 years’ experience in vaccine formulation and analytical development. He received his Ph.D. in Medical Biophysics from the University of Toronto and performed postdoctoral research in Cancer Biology at the Lerner Research Institute, Cleveland Clinic Foundation.
Marina Kirkitadze is Head of Biophysics and Conformation Unit, Biochemistry Platform, Analytical R&D North America, SanofiPasteur Ltd. She has 14 years’ experience in the vaccine industry. Marina received her PhD in Biological Sciences at the Institute of Protein Research, Russian Academy of Sciences, Pushchino, Russia, and her MBA from the University of Phoenix, AZ, USA.