Introduction
It wasn’t all that long ago that Raman spectroscopy was an expensive, lab-based research tool. It was largely used for structural information and identification of materials in mixtures. One problem had been the LASERs used, mostly in the visible wavelength range, caused a lot of fluorescence interference with the “pure” Raman signal. In fact, my first introduction, in the early 1970’s, was less than impressive. One of the professors at Rutgers (Newark) was working with highly constrained inorganic compounds. When the full energy of the LASER struck the sample the resulting explosion even powdered the cuvette.
In nearly a half-century, the technology has been made (obviously) far superior and safer. LASERs have become smaller, more dependable, and less expensive. Computer power, in both speed and capacity, has become a major reason that complicated algorithms may be used in almost instantaneous response to a measurement. There are several reasons why Raman has been slower to become a mainstay in the Pharma industry, but none as strong as tradition. Newness means “lack of regulatory experience” which, in turn, means fear of being the first to submit an application for fear of delay. Fortunately, this is changing.
Hardware and Applications
I will highlight two different pieces of equipment: one large-ish and the other small-ish. The first addresses one of the most infuriating annoyances associated with Raman spectroscopy: massive fluorescence interference. I will not go into detailed theory (especially since it was well covered in a previous issue),1 but merely look at solutions to problems. While fluorescence steadily diminishes with increasing wavelength of the LASER (from 532 nm to 1064 nm) the Raman signal, itself, diminishes by the fourth power of the incident wavelength. For decades, the best method to discriminate against fluorescence was to “gate” the light emitted by the sample. That is, a quick LASER pulse strikes the sample and only the first fractions of a second of the light is collected. The Raman light emerges first, quickly overwhelmed by the fluorescence signal. A gated or time resolved signal is principally the Raman spectrum, with any residual fluorescence easily suppressed digitally.
While a number of experimenters built such equipment (including the supplier of the second unit I will discuss), one company has successfully produced a commercial version. Figure 1 shows the mechanics of the device. Figure 2 shows the Raman and fluorescence spectra and how they overlap in the time domain, where a fast “shutter” effect can effectively block unwanted radiation. This also allows the analyst to use whichever wavelength is best for the analysis, not choosing a wavelength with the least interference. This is important when looking for low concentrations or materials with a weak Raman signal. Figures 3-5 show the “normal” versus time-gated signal at three various excitation wavelengths.
 Figure 1. General schematic of time-gated Raman spectrometer.
 Figure 2. Overall signal, made up from Raman and Fluorescence signals.
 Figure 3. Overall signal (red) vs. “pure” Raman spectrum (blue) of an apatite-containing mineral with 532 nm LASER excitation.
 Figure 4. Overall signal (red) vs. “pure” Raman spectrum of an apatite-containing mineral with 785 nm LASER excitation.
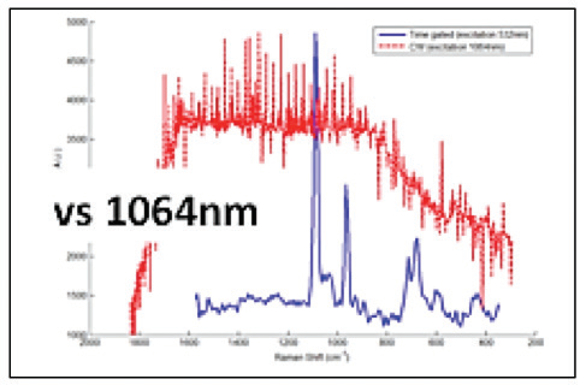 Figure 5. Overall signal (red) vs. “pure” Raman spectrum of of an apatite-containing mineral with 1064 nm LASER excitation
Another way of “seeing” the time-gated spectra is to display a 2-D graph of the Raman shift (cm-1) vs. delay in nanoseconds (Figure 6) or a 3-D graph (time delay vs. counts vs. Raman shift (Figure 7). This visualization aids in selecting wavelengths to monitor an experiment.
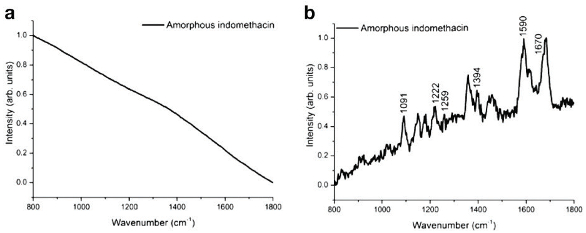 Figure 6. Comparison of “normal” Raman signal vs. time-gated Raman spectrum for amorphous indomethacin using 1064 nm LASER excitation.
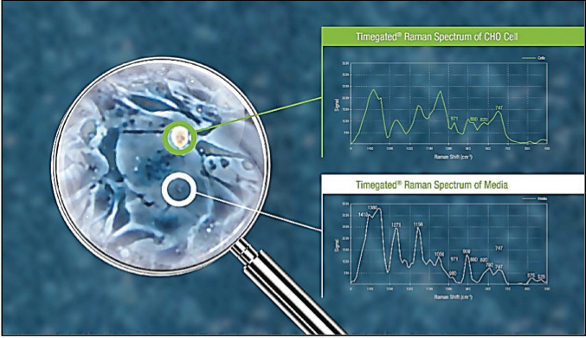 Figure 7. Raman spectrum of CHO (Chinese Hamster Ovary) cell (upper) in medium and medium (lower).
While the unit may, of course be used for small molecule applications, such as checking the spectrum of indomethacin for crystallinity (Figure 8), I believe an excellent application is in fermentation production. Since the Raman activity is strongest for linear molecules with a center of symmetry (no, I will not get too technical here; you could take a course in Group Theory, if you need a better understanding), water is nearly invisible in Raman. [Unlike IR and NIR, where it is, respectively, nearly impossible to measure and a nuisance.] As such, the time-gated unit may be used to examine both the cells and the surrounding medium (see Figure 9). Such information allows the production team to monitor the growth of cells, remaining nutrients, and potential harmful byproducts, simultaneously.
 Figure 8. 2-D presentation of gated Raman spectrum (Raman shift vs. delay in nanoseconds)
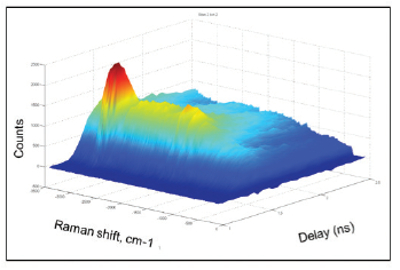 Figure 9. 3-D presentation of gated Raman spectrum (delay in nanoseconds, counts, and Raman shift)
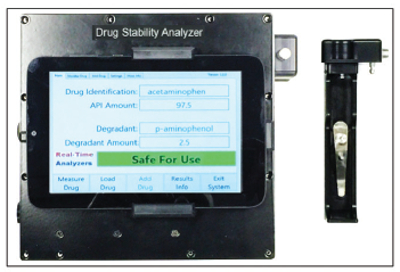 Figure 10. Dedicated drug stability analyzer.
The second, smaller (yet rugged and accurate) instrument was designed for the International Space Station (Figure 10). It was thought that medicines might degrade faster or differently in orbit, due to the extra radiation. It is also being employed by a company called Dynalabs (A-3) in its program to control diversion and of controlled drugs in hospitals and clinics. The company already supplies an instrument for liquid dosage forms (reading in the UV) and wanted to move to solid dosage forms. A typical Raman spectrum is seen in Figure 11.
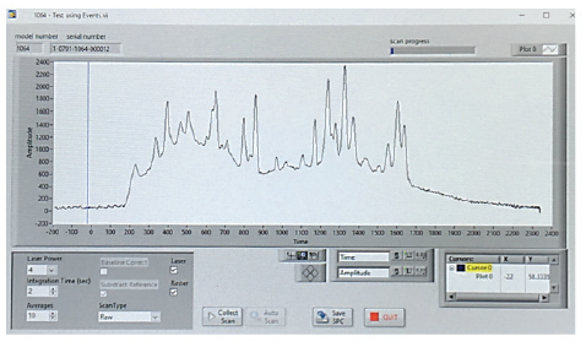 Figure 11. Raman spectrum of acetaminophen from drug stability analyzer.
The ability to perform quantitative measurements (to assure proper dosage form) is demonstrated in Figure 12, using two levels of DHEA (dehydroepiandrosterone) in a common dosage form. The qualitative or discriminatory power between similar steroids in dosage forms is shown in Figure 13 (7-Keto-Progerterone, Progerterone, DHEA, and D. Estriol). The results of the study on stability testing of dosage forms has not been released for publication, as yet, so I cannot share them here.
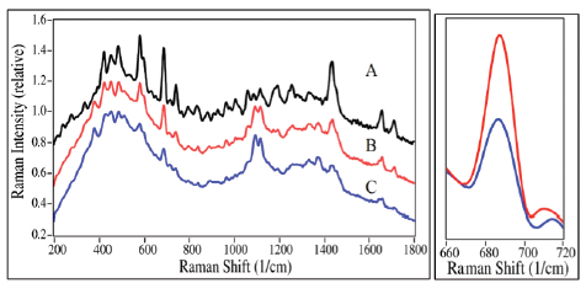 Figure 12. A = pure API (black), B = 50 mg DHEA (red), C = 25 mg DHEA (blue) [second figure shows relative intensities of two dosage levels].
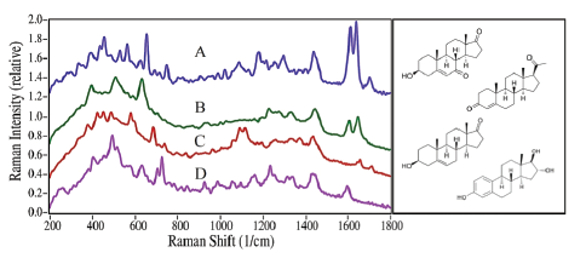 Figure 13. Spectra of dosage forms containing: A. 7-Keto, B. Progerterone, C. DHEA, and D. Estriol [Raman conditions: 200 mWatt for 20 seconds].
8), I believe an excellent application is in fermentation production. Since the Raman activity is strongest for linear molecules with a center of symmetry (no, I will not get too technical here; you could take a course in Group Theory, if you need a better understanding), water is nearly invisible in Raman. [Unlike IR and NIR, where it is, respectively, nearly impossible to measure and a nuisance.]
Some Closing Comments
From just these two (of many) modern Raman instruments, it can be seen that, not only are there excellent instruments across the range of lab, process, and portable instruments, but the results are at least as good as any spectroscopy, now in use. For years, Raman was considered a research and teaching tool for universities or useful for synthesis labs to use for structural confomation. Clearly, the technology should be among the first considered for pharmaceutical analytical applications. As a final suggestion, I would like someone to use Raman for pre-formulation testing. The mixtures should not merely be 50:50 mixes API:single excipient. They could be a carefully made design of experiment matrix, where the interactons of API with various potential excipients could give formulations a better picture of what might be the best formulation, saving a lot of bench time. Since the measurements are nondestructive and rapid, they could be made more often through the glass containers (if not daily). Samples could be “sacrificed” and analyzed via conventional HPLC for confimation of any and all “irregularities” spotted by Raman monitoring.
Acknowledgements
- Timegate Instruments Oy, Teknologiantie 5B, 90590 Oulu, Finland
- Real-Time Analyzers, 352 Industrial Park Rd., Middletown, CT 06457, USA
- Dynalabs, LLC, 2327 Chouteau Ave., Saint Louis, MO 63103, USA
References
- S. Farquharson, Am. Pham. Rev., “Pharmaceutical Applications of Raman Spectroscopy,” 17 (2), 2014.