- Society for Applied Spectroscopy
Optical spectroscopy is defined as the study of how matter interacts with electromagnetic radiation. The technique has been used as a tool to characterize samples in a variety of industries including pharmaceuticals. It can be used to determine metal content, the amount of active ingredient, the color of a sample, or the identity of the material.
Covering the electromagnetic spectrum from the X-ray region (0.1 nanometers) to the terahertz region (500 microns), (see Figure 1) the instrumentation for these measurements are typically based in the laboratory and used by highly trained scientists. These instruments are used in Research and Development as well as quality control. They have undergone major changes in design and shifts in usage since their development that have impacted who uses the instrument and where.
 Figure 1. Electromagnetic spectrum illustrating the common regions for optical spectroscopy.
Optical spectrometers became required instruments in an analytical laboratory after World War II. These instruments were very large, analog in nature and based on vacuum tube technology. After the initial excitement in the analytical instrument industry over equipment that could conduct these analyses and add to the body of knowledge on a material, these instruments became work horses in any chemistry lab. They were usually located in an R&D facility and under the control of a trained scientist who could interpret the data.
With the introduction of solid state electronics and minicomputers, these instruments underwent a revolution. They became somewhat smaller, more robust and definitely easier to use. The trend was towards smaller instruments, with lower power consumption and built-in data analysis. The market drive was to move the analyses from a highly skilled scientist to a technician. Although the move went from a trained PhD to a technician, the technician still understood the technology and how to interpret the data. These instruments were still located in the laboratory but had spread from R&D to QC. The revolution also succeeded in minimizing the footprint since lab space is expensive.
This trend led to the development of portable and handheld instruments.1-4 These portable and handheld instruments moved the analysis from the central laboratory to a QC lab, loading dock or field. This change in technology was supported by two major drivers. The first was the advances in optical technologies driven by the telecommunication industry, and the second was the support by the government to provide tools to analyze chemical hazards in the field. Because of the government drive to put the technology in the hands of first responders, the data analysis had to become much more sophisticated on a much smaller data set. Unfortunately, this has led to the “squiggly line” syndrome where a user does not really understand either what the measurement does or what the results mean. The user accepts the results reported by the instrument blindly.
We are in the midst of a fourth major change being driven by both changes in technology and, more important, by customer interest and demand. Measurement techniques are needed in the field, and there is a drive, led by the MOEMS (micro-opto-electro-mechanical systems) revolutions, to miniaturize devices. In a MOEMS device, the optics, electronics and mechanical systems are all fabricated into a single device.5 (See Figure 2). Operating in the visible to very near IR, these devices are enabling a variety of applications in areas such as food analysis,6 medical diagnostics,7,8 and agriculture. The technology extends beyond grating-based instruments to interferometers9 that will mitigate the cost of expensive detectors to make the technology much more accessible for at-the-sample analysis.
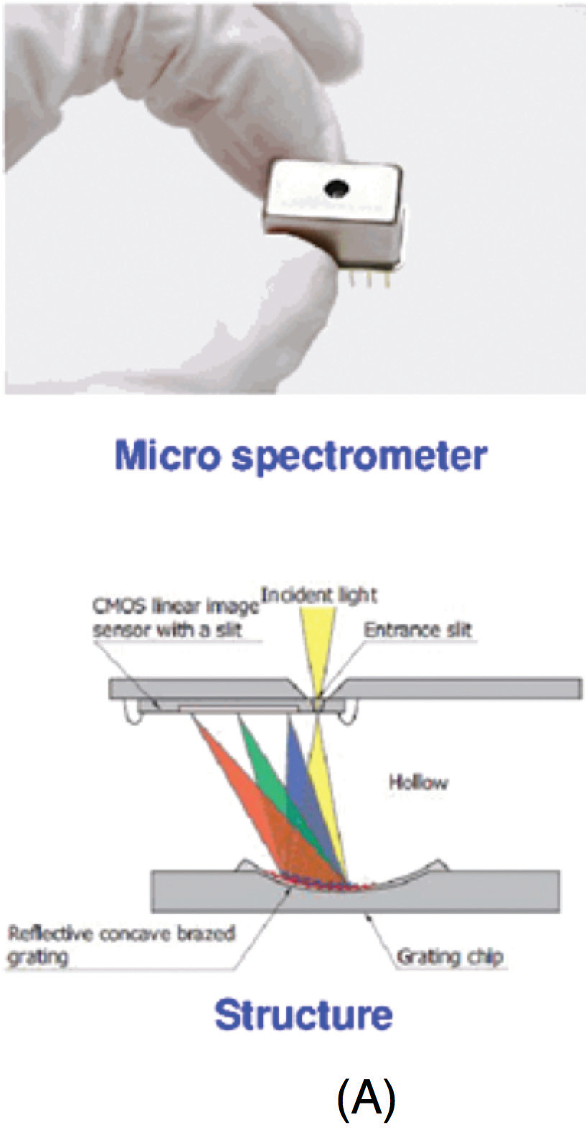 Figure 2. Hamamatsu MOEMS spectrometer device illustrating construction (A) and an implementation of the device to measure fruit ripeness. (B)
Because the technology is so small, consumers are now looking for a “tricorder” to make a measurement and tell them about the sample. Based on many reports in the popular press, customer demand is driving a need for devices to provide information about foods, pharmaceuticals and the environment. This has been shown to work in very controlled situations.10 Unfortunately, a number of recent startups have made a splash by proposing technology, developing the technology on crowd funded platforms and then trying to rely solely on processing power and crowd sourced data to make correlations. They have not worked well.11
The power of the technology is undeniable. But the principles of the measurement science must be kept in mind. You must understand the optics of the sampling and measurement system. You must have a representative sample or be prepared to make multiple measurements on one sample. You have to have reference chemical information on the sample. You must have multiple samples to generate a valid data set. You must understand that the data from a thumb-sized spectrometer is not the same quality as from a benchtop instrument. Addressing all these questions is what makes a valid spectroscopic measurement.
In this fourth step, change in spectroscopic instruments are being empowered by the changing technology. Measurements can now be made at the sample by untrained laymen. We have enormous potential for moving the traditional analysis to the sample and providing more data than ever. But data is not knowledge. In every industry that uses optical spectroscopic measurements, we need to ensure that the measurement provides knowledge, not just more “squiggly lines.”
References
- Crocombe, R.A., Miniature optical spectrometers: The art of the possible, Part IV: New near-infrared technologies and spectrometers. Spectroscopy, 2008. 23(6): p. 26-+.
- Crocombe, R.A., Miniature optical spectrometers, Part III: Conventional and laboratory near-infrared spectrometers. Spectroscopy, 2008. 23(5): p. 40-+.
- Crocombe, R.A., Miniature optical spectrometers: Follow the money - Part II: The telecommunications boom. Spectroscopy, 2008. 23(2): p. 56-+.
- Crocombe, R.A., Miniature Optical Spectrometers: There’s Plenty of Room at the Bottom Part 1: Background and Mid-Infrared Spectrometers Spectroscopy, 2008. 23(1).
- Shibayama, K., et al. Miniaturized UV/VIS spectrometer made by MOEMS technology. 2009.
- Das, A.J., et al., Ultra-portable, wireless smartphone spectrometer for rapid, non-destructive testing of fruit ripeness. Scientific Reports, 2016. 6: p. 32504.
- Das, A., et al. Mobile phone based mini-spectrometer for rapid screening of skin cancer. 2015.
- Rampazzi, S., et al., A Localized Surface Plasmon Resonance-Based Portable Instrument for Quick On-Site Biomolecular Detection. IEEE Transactions on Instrumentation and Measurement, 2016. 65(2): p. 317-327.
- Warashina, Y., et al. MEMS based miniature FT-IR engine with built-in photodetector. 2014.
- Snik, F., et al., Mapping atmospheric aerosols with a citizen science network of smartphone spectropolarimeters. Geophysical Research Letters, 2014. 41(20): p. 7351-7358.
- Khazan, O., Have You Contributed to a Health Scam? The Atlantic, 2014.