Faculty of Science and Technology
Faculty of Science and Technology
Abstract
Handheld Raman spectroscopy has emerged over the last few years as a rapid technique for authenticating medicines. Major challenges arose in the authentication process attributed to the Raman activity of the main constituents or to the formulation type. This witnessed the masking of the Raman signal of herbal medicinal products or medicinal products of low dosage forms. Liquid and semisolid formulations represented a further challenge in the authentication process which was mainly attributed to the number of soluble/insoluble constituents. The present work aims to optimize the method for authenticating medicinal products of different dosage forms using dual laser handheld Raman spectroscopy.
Introduction
Medicine authentication is a complex process that takes into account not only the chemical signature of the medicine but also its physical properties.1 Handheld Raman spectroscopy has emerged over the last few years as a quick tool for authenticating medicines and related formulations.2-5 Many factors have contributed to the efficiency of handheld Raman and were mainly associated with the flexibility of the technique in relation to the user and analyte. For users, Raman spectroscopy offers portability, flexibility and ease of analysis. Handheld Raman instruments offer portability as they can be carried out in the field to the sample location. In the field, handheld Raman instruments operate over a wide temperature range of -5°C to +40°C without the need for power supply (battery lifetime around 4-8 hours). They are equipped with built in identification algorithms that give instant yes/no answers. Nonetheless, the results can be exported after measurement to a computer for offline analysis.6-8
In relation to the analyte, handheld Raman spectroscopy surpassed other spectroscopic characterization techniques as it showed to be: (1) non-destructive in contrary to attenuated total reflectance-Fourier transform infrared (ATR-FTIR) that required crushing tablets, (2) gives specific chemical signatures to the analyte(s) of interest, (3) Raman signatures are seen regardless of the physical state of analyte (solid, liquid, semi-solid, etc.), (4) water does not interfere with the Raman signature of liquids.9
Nonetheless, the majority of handheld Raman authentication studies were conducted on solid formulations being tablets or powders; with very few studies focusing on liquids.5-13 This was mainly attributed to the low amounts of active pharmaceutical ingredients (APIs) present in liquid formulations, the presence of multiple Raman inactive excipients which fluoresce and mask the Raman signatures, and the fact that most handheld instruments operate over the range of 250-2000 cm-1 missing the water peaks around 3000 cm-1. Handheld Dual laser Raman equipped with SSE can overcome these disadvantages as it overcome both fluorescence caused by constituents of low Raman activity, and operate over a wide wavenumber range of 300-3200 cm-1.14-15 Therefore, this work aims to utilize handheld dual laser Raman spectroscopy for authenticating medicines of different dosage forms.
Methods
Different formulations of active pharma-ceutical ingredients, excipients and medicinal products were included in this study, being: powders, tablets, capsules, liquids and semi-solids. For powder formulations: one API (sildenafil citrate) and six different excipients were obtained from chemical suppliers: lactose, magnesium stearate, microcrystalline cellulose, sodium carboxymethylcellulose, sucrose and titanium dioxide. Three different tablet formulations were used and included medicines containing paracetamol, clopidogrel, and levothyroxine. Two capsule formulations were used, one containing orlistat and the second sibutramine. Liquid formulations used included antihistamines, cough syrups and emollients. Additionally, anti-inflammatory and antihistamine creams were included.
The aforementioned formulations were measured using a dual laser handheld Raman instrument equipped with two different sample holders for both tablets and vials. Spectra of tablets were collected from both sides with no sample preparation. Liquids, powders, gels and capsule contents were emptied into glass vials and multiple spectra were measured through glass vials.
The Raman method was optimized taking into account the following parameters: the instrument position, sample holder, number of scans per spectrum, number of spectra per sample and accuracy of identification method. Spectral analysis was conducted using two types of software. Spectral quality was evaluated by taking into account the spectral integration time, range of scattering, scattering intensities and signal to noise (S/N) ratio. For authentication, two identification algorithms were evaluated being: correlation in wavenumber space (CWS) and principal component analysis (PCA). CWS algorithm evaluated the correlation coefficient (r) value between the test and reference spectrum. The threshold taken for r values was 0.95.8
Results and Discussion
Spectral Quality
Powders and tablets showed better spectral quality than capsules, gels and liquids, when the four variables were taken into account being: exposure time, number of peaks, maximum intensities and S/N. Powders and tablets showed lower exposure times, more peaks and higher S/N compared to other formulations.
Powders
Excipients showed better-quality signals when measured through the vial holder. The exposure time and number of scans depended on the Raman activity of the individual substances. It is noteworthy to mention that none of the excipients showed weak Raman signatures and their Raman spectra were generated in less than three seconds (Table 1).
Table 1. Spectral quality of the excipients and medicines measured.

The Raman activity of the measured excipients was of medium or strong activity. Titanium dioxide signatures required the minimum time (of 0.5 seconds) and this is attributed to its strong Raman activity.16 This was followed by sucrose and magnesium stearate which needed 0.7 and 1.65 seconds respectively. Microcrystalline cellulose, sodium carboxymethylcellulose and lactose required between two and three seconds. Apart from titanium dioxide, 2-3 scans were enough to get a clear Raman signature for the excipients. The number of peaks per spectrum of the aforementioned excipients ranged between 11 (observed for magnesium stearate) and 33 (observed for sucrose). Microcrystalline cellulose and sodium carboxymethylcellulose showed 16 and 17 peaks respectively. Lactose showed numerous peaks (n = 30), which is ideal for material characterization. Furthermore, the six excipients showed variable Raman intensities and the increase in intensity was associated with the Raman activity of the excipient measured with the exception of titanium dioxide (Figure 1).
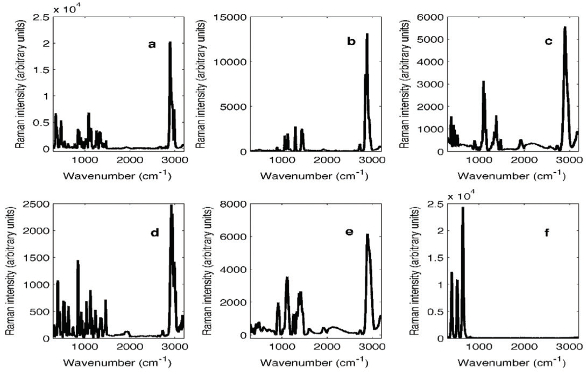 Figure 1. Raw Raman spectra of (a) lactose, (b) magnesium stearate, (c) microcrystalline cellulose, (d) sucrose, (e) sodium carboxymethylcellulose and (f) titanium dioxide measured using a handheld dual laser Raman spectrometer.
Lactose showed high scattering intensity of 20356 arbitrary units and high S/N (10.6).
This was followed by magnesium stearate which showed scattering intensity of 13161.6 arbitrary units. In addition, sucrose, microcrystalline cellulose and sodium carboxymethylcellulose showed scattering intensities of 2461.9, 5568 and 6147.9 arbitrary units, and S/N of 4.87, 7.7 and 2.4 respectively. Yet all the aforementioned substances showed significant scattering over the full wavenumber range between 300 and 3200 cm-1 which allowed their characterization. Titanium dioxide showed a maximum scattering intensity of 24415.4 arbitrary units at 638 cm-1; yet, this increase was associated with increased noise (S/N = 3). This could be partly due to the low exposure time for titanium dioxide (one scan over 0.5 seconds). Increasing the exposure time of titanium dioxide resulted in saturating the Raman signal.16
Tablets
There were no significant differences between spectra collected from both sides of the tablets using the tablet holder. The Raman activity of tablets showed to depend on the formulation type and mixture of excipients used. Key differences were seen in the Raman activity between authentic and counterfeit tablets (Table 1).
Authentic clopidogrel tablets (clopidogrel B1, B2, B3 and B5) showed medium or strong Raman activity in contrary to the counterfeit tablets that had weak Raman activity. The authentic clopidogrel tablets had shorter exposure time between 0.22-0.25 seconds that was required to take 3-4 scans/spectrum. The authentic tablets also showed 8 - 12 characteristic peaks, Raman intensities in the range of 2684.9 – 5082 arbitrary units and S/N in the range of 2.57-29.9 arbitrary units. Nonetheless, the counterfeit clopidogrel tablets showed longer exposure time of 0.75 seconds that was required to take one scan/spectrum only. Both counterfeit tablets showed 12 characteristic peaks and intensities around 5000 arbitrary units; however, they had differences in S/N. The second counterfeit batch’s spectrum (clopidogrel B6) showed more noise that the first (S/N = 3.85).
Levothyroxine tablets evaluated were all authentic and contained the same list of excipients. Subsequently, the Raman activity of the evaluated batches was medium or strong. All four batches showed around 0.7 seconds exposure time to collect two scans/ spectrum. The aforementioned batches showed 27 characteristic peaks, Raman intensities in the range of 7023.6-7127.4 arbitrary units and S/N in the range of 8.8-22. It is notable to mention that levothyroxine B4 showed a significantly high S/N to other batches, which could be attributed to less noise in batch’s spectra.
Capsules
Raman signatures of capsules could not be obtained through the gelatin material. Subsequently, capsule contents were emptied into glass vials and the Raman signatures of the capsules were measured through glass vials using the vial holder. All the evaluated capsules were authentic and showed similar Raman activity for each medicine (Table 1). Overall, the capsules’ content required longer exposure times than tablets despite the presence of similar excipients. This could be attributed to the formulation type.
Orlistat batches (B1 – B6) showed 1.5 seconds exposure time required to collect two scans/spectrum. Despite taking longer times to scan, the aforementioned batches showed medium Raman activity with 25 characteristic peaks per spectrum over the wavenumber range of 300 – 3200 cm-1, and maximum Raman intensities in the range of 10943.6 – 13665.9 arbitrary units. Yet, the noise in the spectra was high (S/N around 2-3) and this contributed to the medium Raman activity of the batches.
Sibutramine batches (B1-B6) showed better Raman activity (strong) than orlistat batches despite requiring similar exposure times. Sibutramine batches had 1.4 seconds exposure time for collection of two scans/spectrum. However, they showed more characteristic peaks (n = 31) compared to orlistat batches. Also, sibutramine batches showed higher S/N ratios (between 10.7 and 16.9) despite having lower maxima intensities (between 9134.3 and 9916.6 arbitrary units).
Gels
Gel (semisolid) formulations used showed weaker Raman activity than powders, tablets and capsules. Exposure times varied between diverse batches of the same medicine and that could be attributed to difference in both constituents and formulation. Hence, the three ibuprofen gels evaluated showed exposure times of 2.1, 1.8 and 3.1 respectively (Table 1). The number of characteristic peaks for the aforementioned three formulations were 8, 12 and 10, and the maximum intensities were 3712.6, 3701.6 and 3686.3 respectively. The gel (ibuprofen B2) with the least exposure time showed better spectral quality than the other two batches. Hence, ibuprofen B2 showed higher S/N (of 8.28) despite having close maximum Raman intensity that was 3701.6 arbitrary units.
Less differences were seen between the spectra; of diclofenac gel batches (B1-B5), which showed shorter exposure times than ibuprofen batches. Exposure times for diclofenac batches were in the range of 0.25 – 2.67 seconds. The batch with the longest exposure time (i.e. diclofenac B5) showed the lowest number of characteristic peaks (n = 11) and S/N of 5.7 despite a high intensity of 6278.9 arbitrary units. Likewise, batches with exposure times of around one second (B1 and B2) showed characteristic peaks of 17 and 13 respectively. B1 had better spectral quality than B5 and B2 due to the low noise attributed in the spectra. Batches with shorter exposure times (B3 and B4) showed 20 and 21 peaks respectively. Therefore, increased noise in the gels’ spectra was featured with longer exposure times.
Liquids
Similarly, liquids with longer exposure times showed noisier spectra (Table 1). For instance, cough mixture B1 showed exposure time of 3.1 seconds, nine peaks and S/N = 5.91. Cough mixture B2 showed slightly less exposure time (2.5 seconds) that corresponded to higher S/N (8.32). The number of peaks for the aforementioned formulation was 16. On the other hand, cough mixture B3 showed the shortest exposure time (1.7 seconds) and better spectral quality among the cough mixtures. Thus, cough mixture B3 showed 18 characteristic peaks and S/N of 24.4.
Authentication
The signatures of medicines are proportional to the Raman active substance(s) present in these medicines.6,7 Therefore, linear classification algorithms including CWS and PCA have proved successful in previous work for identifying pharmaceutical powders and tablets.7-9,14 Yet, the accuracy of this approach was not evaluated for liquids and semisolids; or for closely related substances. So, both methods were evaluated in this work for identifying the different formulations measured; taking both type I and type II errors into account.
For CWS method, Type I errors were encountered when an authentic substance gave an r value < 0.95 against the spectra of the same substance/material. Type II error was encountered when a substance/formulation gave an r value > 0.95 for different material. When the excipients were evaluated, Type I error was observed among the Raman spectra of microcrystalline cellulose and sodium carboxymethylcellulose (Figure 2). This could be attributed to fluorescence encountered in both samples’ spectra between 1800 and 2500 cm-1. Remarkably, no Type II errors were observed between the different excipients. Likewise, no Type II errors was observed among tablets spectra and only Type I error was observed with counterfeit clopidogrel (B4 and B6) tablets’ spectra. Capsules showed only Type I error among orlistat batches’ spectra but not sibutramine tablets’ spectra. On the other
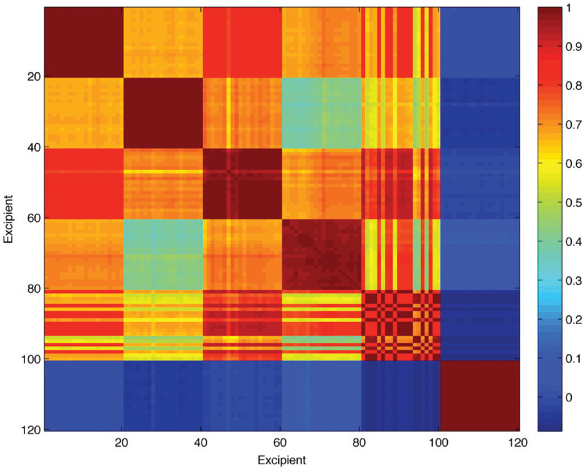 Figure 2. Correlation map of the raw Raman spectra of lactose (1-20), magnesium stearate (21-40), microcrystalline cellulose (41-60), sucrose (61-80), sodium carboxymethylcellulose (81-100) and titanium dioxide (101-120) measured using a handheld dual laser Raman spectrometer. The colour bar on the left shows the range of r values between 0 (blue) and 1 (dark red). Blue colour indicates 0-0.3, green 0.30.5, yellow 0.5-0.6, orange 0.7-0.9 and red above 0.9.
hand, only Type II errors were observed with spectral comparison of liquids and gels. This could be partly due to the overlapping constituents among the different formulations and to the low Raman activity compared to powders.
Subsequently, PCA was applied to the Raman spectra of different formulations including powders, tablets, capsules, gels and liquids. Type I error was observed in PC scores when a substance’s score was not clustered among its reference scores, or when an authentic medicine’s score was not clustered among the additional authentic medicines’ score. Moreover, Type II error was seen when a substance’s score was clustered among the scores of different substances, or when a counterfeit medicine’s score was clustered among the authentic scores.
PCA showed to be a more accurate and precise technique than CWS as it investigated variance among the spectra provided.17 In this respect, PC1 corresponded to the highest variance among the spectra, PC2 to the second highest variance not related to PC1 and so on. With this approach, noise in spectra did not show significant interference with the accuracy of identification. Figure 3 shows the PC scores of the Raman spectra of the six excipients evaluated with no Type I and Type II errors. The scores in the aforementioned case contributed to 95.1% of the variance among the data. The scores plot showed a clear differentiation between the five excipients. Two scores showed clusters near each other (microcrystalline cellulose and sodium carboxymethylcellulose), and that was attributed to similarity in their chemical signatures and Raman scattering (Figure 1).
 Figure 3. PCA scores plot of the raw Raman spectra of lactose (blue), magnesium stearate (green), microcrystalline cellulose (red), sodium carboxymethylcellulose (magenta), sucrose (cyan) and titanium dioxide (black) measured using a handheld dual laser Raman spectrometer.
Hence, PCA was successful in authenticating the different formulations despite the presence of low APIs within the formulations. For instance, the PC scores of authentic and counterfeit clopidogrel tablets were clearly clustered with no overlaps (Figure 4). The counterfeit tablets showed two distinct clusters that could be attributed to the manufacturing source. Likewise, the PC scores of levothyroxine reference and test tablets were clustered together (with the exception of one score) and this attributed to the same manufacturing source (Figure 4).
 Figure 4. PCA scores plot of the raw Raman spectra of (a) authentic (blue) and test (red) clopidogrel (left), and levothyroxine measured using a handheld dual laser Raman spectrometer.
Conclusion
Handheld Raman spectroscopy offered a rapid technique for authenticating different medicine formulations. The results showed that the Raman signatures of the investigated samples could be collected in less than four seconds. The Raman signatures did not only depend on the Raman active substances and their concentrations; but also, on the formulation type and physical properties of the materials measured. The spectral quality was an important factor to be taken into account when authenticating medicines. Noise was seen as a key factor that interfered with the Raman signatures of medicines and thus gave type I/type II errors when using the CWS algorithm. PCA algorithm was successful in overcoming issues associated with noise but showed overlap among substances of similar chemical structures. Therefore, future approach to medicines’ authentication should take into account multiple factors including spectral quality and two identification algorithms.

References
- Moffat, A. C., Assi, S., & Watt, R. A. (2010). Identifying counterfeit medicines using near infrared spectroscopy. J. Near Infrared Spectrosc, 18(1), 1-15.
- Das, R. S., & Agrawal, Y. K. (2011). Raman spectroscopy: recent advancements, techniques and applications. Vibrational Spectroscopy, 57(2), 163-176.
- Gala, U., & Chauhan, H. (2015). Principles and applications of Raman spectroscopy in pharmaceutical drug discovery and development. Expert opinion on drug discovery, 10(2), 187-206.
- Sacré, P. Y., Deconinck, E., De Beer, T., Courselle, P., Vancauwenberghe, R., Chiap, P., ... & De Beer, J. O. (2010). Comparison and combination of spectroscopic techniques for the detection of counterfeit medicines. Journal of pharmaceutical and biomedical analysis, 53(3), 445-453.
- Witkowski, M. R. (2005). The use of Raman spectroscopy in the detection of counterfeit and adulterated pharmaceutical products. Am. Pharm. Rev, 8(1), 56.
- Assi, S., Watt, R., & Moffat, T. (2011). Comparison of laboratory and handheld Raman instruments for the identification of counterfeit medicines.
- Assi, S. (2014). Investigating the quality of medicines using handheld Raman spectroscopy. European Pharmaceutical Review, 19(5), 56-60.
- Assi, S. (2013). Raw material identification using dual laser handheld Raman spectroscopy. European Pharmaceutical Review, 18(5), 25-31.
- Assi, S. (2016), Evaluating handheld spectroscopic techniques for identifying counterfeit branded and generic medicines worldwide. American Pharmaceutical Review, 19, 3.
- Hajjou, M., Qin, Y., Bradby, S., Bempong, D., & Lukulay, P. (2013). Assessment of the performance of a handheld Raman device for potential use as a screening tool in evaluating medicines quality. Journal of pharmaceutical and biomedical analysis, 74, 47-55.
- Jentzsch, P. V., Torrico-Vallejos, S., Mendieta-Brito, S., Ramos, L. A., & Ciobotă, V. (2016). Detection of counterfeit stevia products using a handheld Raman spectrometer. Vibrational Spectroscopy, 83, 126-131.
- Fukami, T., Koide, T., Hisada, H., Inoue, M., Yamamoto, Y., Suzuki, T., & Tomono, K. (2016). Pharmaceutical evaluation of atorvastatin calcium tablets available on the Internet: A preliminary investigation of substandard medicines in Japan. Journal of Drug Delivery Science and Technology, 31, 35-40.
- Lawson, L. S., & Rodriguez, J. D. (2016). Raman Barcode for Counterfeit Drug Product Detection. Analytical chemistry, 88(9), 4706-4713.
- Assi, S., (2016). Authentication of medicines using dual laser Raman spectroscopy, European Pharmaceutical Review, 21 (6), 30-34.
- Assi, S., Wallis, B. and Osselton, D. (2016). The evaluation of dual laser handheld Raman spectroscopy for identification of novel psychoactive substances, American Pharmaceutical Review, September.
- Balachandran, U. G. E. N., & Eror, N. G. (1982). Raman spectra of titanium dioxide. Journal of Solid State Chemistry, 42(3), 276-282.
- H. Martens and T. Naes, Multivariate calibration. John Wiley & Sons, (1992).