Center for Structured Organic Particulate Systems (C-SOPS)
Introduction
Near infrared (NIR) spectroscopy is today used widely to monitor mixing of excipients and active pharmaceutical ingredients in pharmaceutical manufacturing.1-8 The feasibility of this application was demonstrated more than 20 years ago.9 The moving block standard deviation may be used to evaluate the variation in NIR spectra, or the drug concentration may be determined in the powder blend. NIR calibration models have been developed relating spectral changes with drug concentration. The mixing process is evaluated in terms of standard deviation and closeness to an expected drug concentration.1,4 The subtle changes observed in NIR spectra as the composition of powder blends vary have not been a limitation to NIR spectroscopists due to powerful chemometric calibration methods. NIR spectroscopists have developed various approaches for developing calibration blends that include the expected process variation.10
The drug concentration values and their standard deviation have been used to evaluate powder mixing However, a 4% relative standard deviation (RSD) does not mean that a powder mixture has that exact variation. The true process variation is less than the 4% RSD observed. Some of the variation observed will be the result of the unavoidable random error of the analytical method and sampling errors as well. The latter error has been mentioned as a possible cause of unexpected results in a number of pharmaceutical studies, but rarely thoroughly investigated.11 However, it is now possible to discriminate between the process variation proper and the sampling-plus-analytical errors during continuous manufacturing using variographic analysis. This short exposé provides a discussion of recent work where variographic analysis, developed within the Theory of Sampling provides useful information for pharmaceutical manufacturing.4,12-16 We here show how variographic analysis makes it possible to perform real time process monitoring and improve a pharmaceutical process.
Variographic Analysis
The design of a real time monitoring system as a 1-D lot makes it possible to use variographic analysis.17 The term 1-D lot refers to sampling where one dimension dominates in space (and time). The conveyor belt shown in Figure 1 allows for sampling of the powder over the dominant process dimension, as the conveyor belt carries powder to the location where the NIR spectrum is obtained. The interface shown in Figure 1, which was recently used with a continuous manufacturing system, can be viewed as a particular example of a moving 1-D lot.4,13 The advantage of variographic analysis is that it provides both an estimate of the sampling and analytical errors for the process being monitored, and an opportunity to discriminate between these errors and the true process variation.4,13Figure 1 shows a sketch of the interface recently used to acquire NIR spectra to monitor a continuous manufacturing process.4 This is clearly a 1-D lot as the powder is continuously flowing by the NIR window; the dominant dimension is process time. Variographic analysis seems custom made for continuous mixing applications.16 Such analysis has been a valuable contribution from the Theory of Sampling (TOS) to many process industries in the several decades, e.g. in the mining, metallurgy, minerals processing, and cement industries.18-20
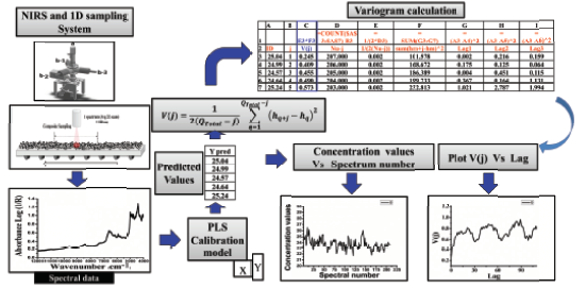 Figure 1. NIR spectra are obtained for a 1-D lot. Powder fl ows through a NIR interface in a continuous manufacturing process or conveyor belt from which NIR spectra are obtained at a specifi c location. Drug concentration values are determined by a validated chemometric calibration model and then used to calculate the variogram function V(j). It is critical always also to present the corresponding plot of drug concentration versus time to be able to distinguish between “high” or “low” sill levels, see text.
Figure 1 shows that NIR spectra are obtained from which drug concentrations are determined by a validated chemometric calibration model. The variogram can then be constructed based on the drug concentrations values. Variographic analysis requires knowing the order in which the spectra were obtained, which is no problem because NIR spectroscopy includes appropriate time tags. The variogram is an excellent complement to conventional plotting of drug concentration values vs time also as shown in Figure 1. Both plots should always be used for monitoring 1-D lots.
The variogram is derived by plotting the sample-pair variances V(j) versus the interval between pairs of samples, defined as the lag(j); V(j) is the average variance between all sample pairs with the same lag, Figure 1. Thus, at lag 1, V(1) is the sum of squares between consecutive values of the drug concentration determined by the NIR method. The variogram is then calculated for lag 2, i.e. as the sum of squares of the differences between every third point, etc. The lag is increased by 1 unit, until half the number of measurements is reached. This plot requires a minimum of 60 analyses, but in automated in-line monitoring a virtually unlimited number of analyses can be performed. Thus, if 1000 measurements are obtained a maximum lag value of 500 (Qtotal/2) is included in the variogram. An example from powder mixing monitoring will shed full light of the powerful variographic analysis and interpretation.
Low values of V(j) indicate a stable level of the analytical values, i.e. high uniformity of the powder blend output, meeting the objectives of the mixing process. But the variance may increase as the lag values increase, indicating that the uniformity of the blend is varying, trending, throughout time. For very many processes, the variance typically increases until a maximum value is observed, called the “sill” as shown in Figure 2.4,13,18 The “sill” will be fully developed after a certain lag, below which lower variances are observed; this lag level is termed “the range”. Variances at lowerthan-range lags represent autocorrelation in the data series, the higher the closer the sample pair distances. Figure 2 shows the “range” the “sill”.
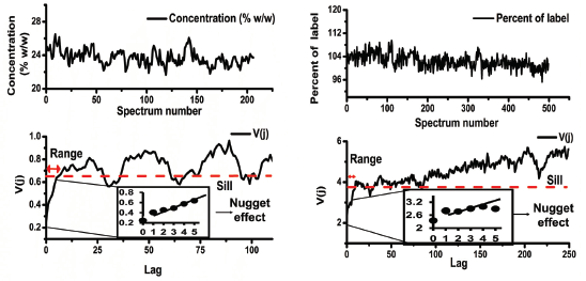 Figure 2. Left. Top - Plot of concentration values vs process time (spectrum acquisition number), and bottom – variogram that reveals cyclic behavior in drug concentration output values, signifying that the mixing process have not been persuasive enough. Right – Top-drug concentration vs spectrum number, bottom – variogram revealing a general trend in the process data.
The variogram also provides critically important information in the form of the “nugget eff ect”. The first five data points from the variogram are extrapolated backward to intercept the y-axis which allows estimation of the “nugget eff ect”. Such a variance determination corresponding to lag=0 is physically impossible, as it is not possible to extract two samples from the exact same location. But there is more information to be had from the nugget eff ect: Even though not physically possible, this back-extrapolation of the variogram trend, actually provides an estimate of the variation corresponding to repeating the full sampling + analysis operation at this location.18 Thus, the “nugget eff ect” furthers an unsuspected bonus – an estimate of the sum-total of the sampling and analytical errors. TOS also identifies this zero-location variance as the minimum practice error (MPE), because it is the ultimately smallest possible sampling plus analysis error that can ever be obtained if/ when all other sensor and other sampling error have been completely eliminated. This cannot be fully achieved even in the most ardent situations, but is a very useful ideal objective to approach as closely as possible in practice.
In a recent study a first sampling scheme consisted of averaging 16 scans with FT-NIR spectroscopy for a powder flowing with an approximate linear velocity of 4.2 mm/s.4 The sample mass that interacted with the NIR radiation was estimated as 37 mg, after considering the density of the powder mixture and the depth of penetration of the NIR radiation. The nugget eff ect ranged from 0.52 -0.92%2 for two continuous manufacturing runs under these conditions. The sill or maximum variance ranged from 0.66 – 1.03%.2 This initial evaluation showed that a large part of the variance was related to sampling and analytical errors. The study then considered averaging of three FT-NIR spectra, each of which consisted of 16 averaged scans, increasing the estimated sampling mass to 111 mg. The nugget eff ect for this approach now ranged from 0.05 – 0.08%,2 while the sill varied from 0.29 – 0.43%.2 Thus, the averaging of the three spectra provided a marked reduction of the sampling and analytical errors.
By specifically disregarding the nugget eff ect (the total measurement system uncertainties should not be included in the understanding of process variations proper), the diff erence between the nugget eff ect and the sill provides an estimate of the variation that is only related to the powder mixture. Thus, variographic analysis may be used to discriminate between the variation related to the mixing process and the variation related to the sampling and analytical errors only. Variographic analysis is the emerging method with which to decompose any process data series into these two sources of error uncertainty. It is very easily implemented as it is based solely on the data from process monitoring.

Figure 2 shows two “increasing variograms”, i.e. where the variance increases with time until the range is reached. The left part of the figure also shows a cyclic variogram. This cyclic behavior has been linked to the performance of screw feeders and mixers in continuous manufacturing.14 However, the variogram could also be a flat variogram (no range) where the variance does not change throughout all lags. This is a reflection of quite similar analytical values along the entire process. In cases where the variogram is “flat” at a low level, all is good both with the process as well as the measurement system. While a flat high-sill variogram indicates that the sampling and analytical errors are of similar magnitude as the process variance, of course totally unacceptable. In this situation, the process cannot even be monitored without first revamping the complete sampling + analysis system; it is critical to be able to identify such cases.
Very many total measurement systems (sampling-plus-analysis) have never been properly characterized by a variographic analysis. Variographic analysis has a very great potential as a new tool to guide process improvement in situations where sampling of a 1-D lot is performed.13
Acknowledgements
This work has been supported in part by the National Science Foundation Engineering Research Center on Structured Organic Particulate Systems through Grant NSF-ECC 0540855, and the Puerto Rico Science Technology and Research Trust.
References
- Corredor C, Lozano R, Bu X, et al. Analytical Method Quality by Design for an On-Line NearInfrared Method to Monitor Blend Potency and Uniformity. J Pharm Innov. 2015;10(1):47-55.
- Martinez L, Peinado A, Liesum L. In-line quantification of two active ingredients in a batch blending process by near-infrared spectroscopy: Influence of physical presentation of the sample. Int J Pharm. 2013;451(1-2):67-75.
- Shi ZQ, McGhehey KC, Leavesley IM, Manley LF. On-line monitoring of blend uniformity in continuous drug product manufacturing process-The impact of powder flow rate and the choice of spectrometer: Dispersive vs. FT. J Pharm Biomed Anal. 2016;118:259-266.
- Vargas JM, Roman-Ospino AD, Sanchez E, Romañach RJ. Evaluation of Analytical and Sampling Errors in the Prediction of the Active Pharmaceutical Ingredient Concentration in Blends From a Continuous Manufacturing Process. J Pharm Innov. 2017;12(2):155–167.
- Igne B, Talwar S, Drennen JK, Anderson CA. Online Monitoring of Pharmaceutical Materials Using Multiple NIR Sensors-Part II: Blend End-point Determination. J Pharm Innov. 2013;8(1):45-55.
- Martinez L, Peinado A, Liesum L, Betz G. Use of near-infrared spectroscopy to quantify drug content on a continuous blending process: Influence of mass flow and rotation speed variations. European Journal of Pharmaceutics and Biopharmaceutics. 2013;84(3):606-615.
- Vanarase AU, Alcalà M, Jerez Rozo JI, Muzzio FJ, Romañach RJ. Real-time monitoring of drug concentration in a continuous powder mixing process using NIR spectroscopy. Chemical Engineering Science. 2010;65(21):5728-5733.
- Osorio JG, Vanarase AU, Romañach RJ, Muzzio FJ. Continuous Powder Mixing. Pharmaceutical Blending and Mixing: John Wiley & Sons, Ltd; 2015:101-127.
- Sekulic SS, Ward HW, Brannegan DR, et al. On-line monitoring of powder blend homogeneity by near-infrared spectroscopy. Anal Chem. 1996;68(3):509-513.
- Romañach R, Román-Ospino A, Alcalà M. A Procedure for Developing Quantitative Near Infrared (NIR) Methods for Pharmaceutical Products. In: Ierapetritou MG, Ramachandran R, eds. Process Simulation and Data Modeling in Solid Oral Drug Development and Manufacture: Springer New York; 2016:133-158.
- Green RL, Thurau G, Pixley NC, Mateos A, Reed RA, Higgins JP. In-Line Monitoring of Moisture Content in Fluid Bed Dryers Using Near-IR Spectroscopy with Consideration of Sampling Effects on Method Accuracy. Anal Chem. 2005;77(14):4515-4522.
- Romañach RJ, Esbensen KH. Theory of Sampling (TOS) - for Development of Spectroscopic Calibration Models American Pharmaceutical Review. 2016;19(6):138-139.
- Esbensen KH, Román-Ospino AD, Sanchez A, Romañach RJ. Adequacy and verifiability of pharmaceutical mixtures and dose units by variographic analysis (Theory of Sampling) – A call for a regulatory paradigm shift. Int J Pharm. 2016;499(1–2):156-174.
- Colon YM, Florian MA, Acevedo D, Mendez R, Romañach RJ. Near Infrared Method Development for a Continuous Manufacturing Blending Process. J Pharm Innov. 2014;9(4):291-301.
- Romañach RJ, Esbensen KH. Sampling in pharmaceutical manufacturing - Many opportunities to improve today’s practice through the Theory of Sampling (TOS). TOS Forum. 2015;4:5-9.
- Romañach RJ. Theory of Sampling - From Missing Link to Key Enabler for Process Analytical Technology (PAT). Paper presented at: Keynote Lecture 8th World Conference on Sampling and Blending; May 9- 11, 2017, 2017; Perth, Australia.
- Danish-Standards-Foundation. DS 3077(2013). Representative Sampling - Horizontal Standard: Danish Standards Foundation; 2013:1- 42.
- Esbensen KH, Julius LP. Representative Sampling, Data Quality, Validation - A Necessary Trinity in Chemometrics. Comprehensive Chemometrics: Chemical and Biochemical Data Analysis, Vols 1-4. 2009:C1-C20.
- Minnitt RCA, Pitard FF. Application of variography to the control of species in material process streams: %Fe in an iron ore product. Journal of the South African Institute of Mining and Metallurgy. 2008;108(2):109-122.
- Minnitt R, Esbensen K. Pierre Gy’s development of the Theory of Sampling: a retrospective summary with a didactic tutorial on quantitative sampling of one-dimensional lots. TOS Forum. 2017;7(1):7 - 19.
Author Biographies
Rodolfo J. Romañach, PhD is Professor of Chemistry and Site Leader for the Engineering Research Center for Structured Organic Particulate Systems at Mayagüez. His research is focused in understanding the sources of error in near infrared spectroscopic methods.
Adriluz Sanchez Paternina is currently a Ph.D. student in the Department of Chemistry at UPR-Mayagüez focused on the implementation of variographic analysis for the understanding of sampling and analytical errors in NIR spectroscopy. She completed her M.S. in Chemistry at UPR-Mayagüez and her B.S. in Chemistry at the Universidad de Cartagena.
Kim H. Esbensen is an internationally recognised expert and consultant in sampling, chemometrics and PAT (Process Analytical Technology). Through an extensive academic career he has conducted R&D across a wide range of application fields, primarily process industries (minerals, bio-fuel, recycling, environmental monitoring). Esbensen has been responsible for a university educational program straddling 30+ years in chemometrics, PAT, TOS, instrumental analysis, Multivariate Image Analysis (MIA), process technology and Philosophy of Science and has subsequently developed a widely recognised continuing education concept today offered via KHE Consulting. His CV lists ~250 publications, ~400 lectures/presentations. He is a recipient of the Pierre Gy Sampling Gold Medal (2013), and the Russian Chemometrics Society Gold Medal (2012). In 2003 he inaugurated the biannual series of World Conferences on Sampling and Blending (WCSB), now in its 8.th edition.