Introduction
Different polymorphic forms of an API can have substantially different physical properties, e.g., solubility, stability, and ease of compaction. Polymorphism is a “different crystalline phases of a compound, arising from the possibility of at least two crystalline arrangements of that compound in solid state” [1, 3], and has been treated at length in the literature [1-3]. In particular, Brittain [3] has devoted an entire volume to polymorphism as it applies to pharmaceuticals, both API and formulations of an API. In course of development, change in polymorphic form may occur as a result of change in synthesis or of crystallization method for API, in stressed-stability of API, or in the processing/stability of formulated API. If a particular property, e.g. solubility, of one polymorphic form is desirable, the ability to isolate, characterize, and quantify it becomes a necessary part of the development process. The present work describes techniques used to determine polymorphic purity of an API in development, and to identify the polymorphic form in formulated drug.
An API entering development had been isolated in two crystalline forms and an amorphous form. The solubility of the API was about 1 μg/mL in water and 40 μg/mL in 10% sodium lauryl sulfate. The initial work with the formulated API employed a solid dispersion of the amorphous form of the drug. However, during the development of a dosage form using amorphous API, a backup formulation was needed. The crystalline forms of the API were then revisited. The solubility of Form 2 was found to be three times greater than that of Form 1. To advance Form 2 development, characterization information on Forms, 1 and 2 and the amorphous form of API was acquired. In addition to differential scanning calorimetry (DSC), Near-infrared (NIR) spectroscopy [4-5] and x-ray powder diffraction (XRPD) [5-6] were investigated for characterization and quantification of crystalline Form 1 in Form 2.
Experimental and Initial Characterization
The API was synthesized and the various forms were isolated by sanofi-aventis R&D. API was formulated into tablets by 2010sanofi-aventis US R&D Pharmaceutical Sciences, Great Valley. Thermal characterization, XRPD, NIR and other experimental work was performed at sanofi-aventis US R&D Great Valley.
The thermal behavior of the API and its polymorphic forms were investigated by DSC. Figure 1 shows overlays of the resultant DSC scans. Thermodynamically, Form 2 is monotropically related to Form 1. Also, the amorphous form of the API converts to Form 2 after the glass transition, subsequently Form 2 in solid state transforms to Form 1. Considering only the DSC thermodynamic data, Form 2 ought to be kinetically stable at ambient conditions. This was confirmed for “dry” API by kinetic modeling of non-ambient XRD data at temperatures where the conversion occurs relatively rapidly (over several hours). However, it was found that other factors could result in transformation of Form 2 into Form 1. To this end, methods were investigated to characterize/determine low levels of Form1 in Form 2.

Figure 1 - Thermal characterization by DSC of amorphous and crystalline API
XRPD patterns were obtained of each crystalline and the amorphous form. Figure 2 displays the overlaid XRPD patterns of the forms of API. The patterns of the two forms are very different, with the Form 2 peak at ca. 8 degrees 2-theta, and the Form 1 peak at ca. 11 degrees 2-theta of adequate intensity and resolution to permit quantitation at fairly low levels when present in the other form.

Figure 2 - The XRPD patterns of Form 1, blue. Form 2, red, and amorphous, black, API
Some earlier investigations had been done on using mid-infrared (mid-IR) spectroscopy to distinguish between Form1 and Form2. Two bands in the mid-IR spectrum were found to differ in splitting patterns for each form. However, to prevent biases in sample preparation from influencing the characterization/determination, NIR spectra of Forms 1 and Form 2 were acquired in reflectance mode, as received, in glass scintillation vials. Each NIR spectrum was acquired as an average of 32 scans. The NIR spectra were treated with second-derivative to enhance differences in the spectra of each form. A pertinent region of the spectrum is displayed in Figure 3.
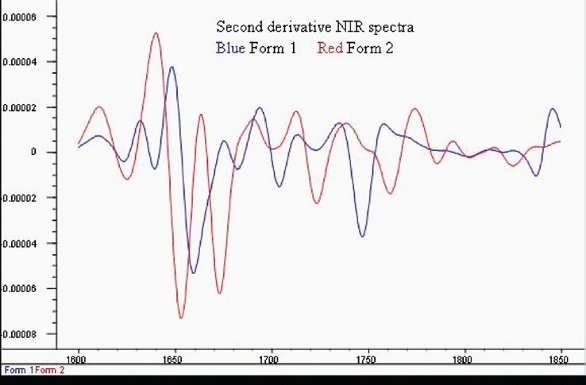
Figure 3 - NIR second derivative spectra of the region showing key spectra differences between Form 1 and Form 2
An important fact is that key differences in the second derivative spectra, band shifts between 1620 to 1880-nm shown in Figure 3, and shifts between 2000 and 2100-nm, correspond to overtone and combination bands of the distinct mid-IR bands of Form 1 and Form 2.
The ability of both XRPD and NIR spectra to distinguish between the Forms of the API was thought to be worthwhile exploring at levels thought to be influential in both API and formulated product. Accurately weighed mixtures of Form 1 in Form 2, ranging from 2 to 10 % weight/weight, were prepared by Pharmaceutical Sciences Department sanofi-aventis US R&D Great Valley. XRPD patterns and NIR spectra were acquired of identical samples, as well as, authentic samples of Forms 1 and 2. The XRPD results will be presented first.
The XRPD patterns are shown in Figure 4. Note the peak near 11° 2-theta.

Figure 4 - XRPD patterns of from 2 to 10% weight/weight of Form 1 in Form 2
That particular peak was mentioned earlier as the key differentiation of the XRPD patterns of the two Forms. A second feature in the patterns, note that between 7° and 8° 2-theta, a peak grows in near 8° as the amount of Form 1 increases. The peak near 8° 2-theta would be significant at >6% weigth/weightForm1, but overlap of Form 2 complicates analysis at lower levels.
NIR spectra were acquired of each standard. An overlay of second derivative spectra in a key analytical region is seen in Figure 5.
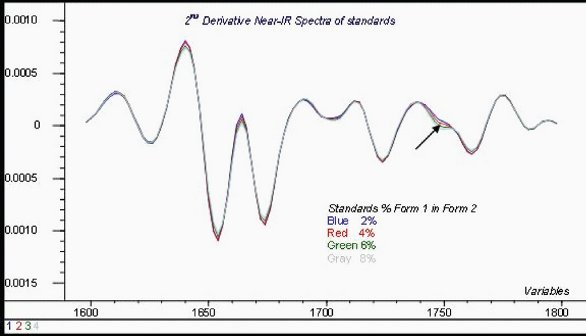
Figure 5 - Second-derivative of NIR spectra standards in key wavelength region
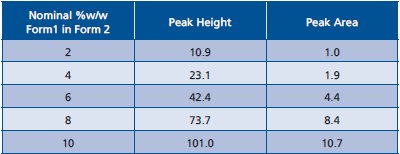
Table 1 - Peak area and Peak height of 11° 2-theta peak in XRPD patterns standards
Data Analysis
The XRPD data were analyzed by linear regression of both peak height and peak area of the 11° 2-theta peak in each pattern versus the % weight by weight Form1.
The experimental data are shown in Table 1. The graph and regression results are shown in Figure 6. The peak height data provide a better fit.
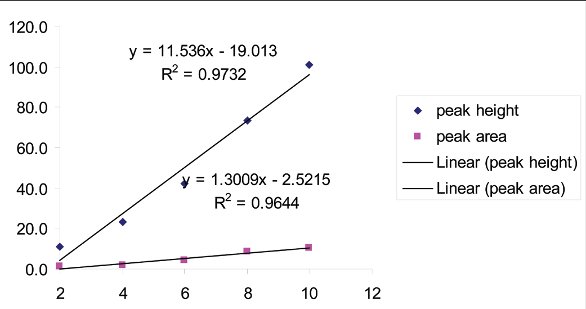
Figure 6 - Regression Data
The XRPD results show a clear linear relationship between nominal Form 2 content in the standards and peak height/area. However, the difficulty of accurate prediction of actual concentration, particularly at low Form 2 content (< 4%), points to the problems with using XRPD for quantitative analysis. These factors have been described in detail in the literature [7]. In the first place, it is very difficult to produce homogenous physical standards containing a very small amount of one solid phase mixed in another. Particle size differences, electrostatic effects, and morphology differences can only be overcome up to a point using standard mixing techniques. In addition, due to the relatively low penetration of the X-ray beam into the sample, only a small amount of material is exposed to the radiation. The need for improved peak resolution may require the use of narrower slits on the source, further limiting the exposure of the sample to the beam. Preferred orientation plays an important role, possibly the main one, in the measured intensity of peaks in the XRD pattern of needle-shaped crystals, such as the ones in this study. Such effects may be mitigated by particle size reduction and by using a rotating capillary [8], but they cannot be eliminated entirely.
Given adequate time and effort, an XRD method with improved accuracy could probably be developed, but the process would be slow and tedious, and may result in a method not ideally suited for QC application. It is important to note that since we were concerned mainly with the quantitation of low amounts of Form 1 in test samples, we have prepared standards reflecting this consideration. In many studies of quantitative phase analysis by XRD, the entire range from 0 to 100% is examined. The linearity of the calibration data is often excellent in such studies, but the error in the prediction at lower phase contents is often underestimated.

Figure 7 - Regression plot. NIR Data fitted by PLS-1 model
Table 2 - Data table, NIR predicted data versus Laboratory values.
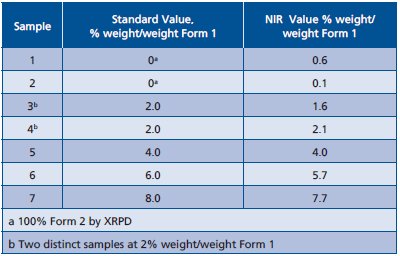
The NIR data was processed using a chemometric program. NIR spectra were exported into program format. The spectra were treated with second derivative and a multiplicative scatter correction. A multiple linear regression, partial least square (PLS), routine was run on 1450 to 2500-nm region of the spectrum. The results are summarized in Figure 7 and Table 2. The standard error of cross validation for the PLS model was 0.3%. An estimate for the NIR limit of detection (LOD) is 0.5%. The LOD is derived from standard error of cross validation and from the mean value of the 0% sample.
Results for Laboratory Samples of API, Tablets
Table 3 - Results on API stability samples
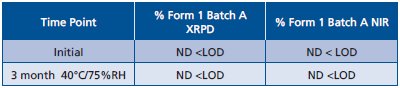
Both XRPD and NIR were applied to API stability samples from a large scale batch. Samples were analyzed at time zero and after storage for 1 month at ICH conditions of 40°C/75%RH. Results of XRPD and NIR are listed in Table 3.
A short stability study had been done prior to the large scale batch. That study focused on two research batches. Results of both XRPD and NIR showed at time zero a trace of Form 1 in one research batch. Subsequent analysis of that research batch after one month at ICH 40°C/75%RH found quantifiable amounts of Form 1. The other research batch did not show any Form 1 after one month at ICH 40°C/75%RH.

Figure 8 - XRPD patterns for tablets

Figure 9 - NIR spectra tablets
The NIR and XRPD tests were extended to obtain at least identification of Form 1 in coated tablets. Concentration of the API in tablets was about 25% by weight. Tablets from an ICH study were examined by XRPD and by NIR. Tablets were intact for NIR tests. At the time the stability study was initiated, the tablets contained no detectable Form 1. At the one month time-point, samples stored at 30°C/65%RH in protective packaging were identical to initial, Form 1 was < LOD for XRPD. For NIR, spectra were consistent with initial samples. However, tablets stored at 40°C/75%RH in protective packaging were found to contain Form 1. The XRPD results are in Figure 8; NIR results are in Figure 9. The XRPD pattern for the tablet stored at 40°C/75%RH displays peaks characteristic of Form 1 near 8° and 11° 2-theta with significant intensity.NIR reflectance spectra in Figure 9 indicate a change in Form. Note that data are qualitative, but are consistent with XRPD in terms of appreciable amounts of Form 1. Significant for the NIR technique was the ability to detect API form change in a coated tablet. In this case, relative amounts of Form1 and Form 2 could be influenced by the penetration depth of NIR beam in reflectance mode. One postulated mechanism for that conversion of forms is moisture diffusion into the tablet through the coating into the interior. Nonetheless, a comparison of dissolution behavior of the ICH stability tablets clearly shows distinct difference in rate of dissolution—in effect, the very real solubility differences between the two forms of the drug that had been discussed earlier on. See graph Figure 10.
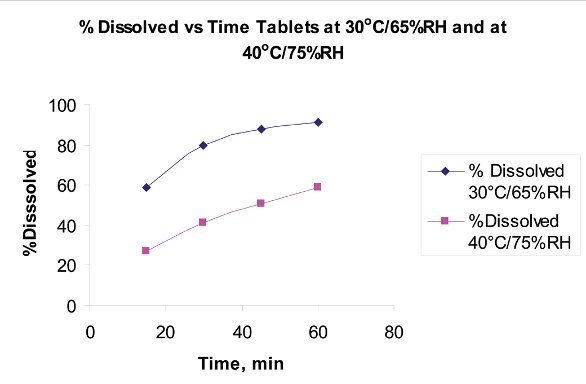
Figure 10 - Dissolution profiles of tablets stored at different ICH conditions
Conclusion
Both XRPD and NIR are able to screen for low levels of Form 1 in Form 2 of the API. The results of cross-comparison on identical sample sets clearly show that levels less than 5% Form 1 in Form 2 can be detected and quantified by both methods. In terms of validation and ease of method application in the QC laboratory, NIR has an advantage over XRPD. Both methods were extended to identification of Form 1 in ICH samples of tablets. XRPD and NIR predictions of Form 1 were verified by dissolution test on tablets.
Both methods have been demonstrated to have potential for further development as quality control methods for form contamination. Both clearly require substantial improvement. A larger set of training standards and a validation set are necessary for the NIR method to rigorously demonstrate validity and robustness. The XRD method needs considerable refinement as has been discussed in the article.
The development data to date suggest that no contamination in the drug substance is acceptable for development of a product with adequate shelf-life for commercial development. The objective of the test method, in that case, would be to support an “absence of” test with as low an LOD as is achievable. It is not yet clear which of the two methods would be best suited for this purpose. However, if the development of more stable formulation and packaging configurations allow a certain level of contamination to be demonstrably acceptable, the requirements for the final method would be quite different. XRD would be an invaluable technique for drug substance and formulation development, but it appears that NIR would have an edge in the latter case, particularly with the opportunity to use it as an at-line, in-process test. APR
References
- McCrone, W.C. in Physics and Chemistry of the Organic Solid State, Vol. 2, (Eds.: D. Fox, M.M. Labes, A. Weissberger), Interscience, New York, 1965, pp. 725-767.
- Bernstein, J., Davey, R.L., and Henck, JO, Concomitant Polymorphism, Angew.Chem.Int. Ed. 1999,38, 3440-3461.
- Polymorphism in Pharmaceutical Solids, Second Edition (Drugs and the Pharmaceutical Sciences) Harry G. Brittain (Editor) Informa HealthCare; 2nd edition (July 27, 2009)
- Otsuka, M., Kato, F. and Matsuda, Y., Determination of indomethacin polymorphic contents by chemometric near-infrared spectroscopy and conventional powder X-ray diffractometry, Analyst, 2001, 126, 1578 – 1582.
- Patel, A.D., Luner, P. E. and Kemper, M. S., Low-level Determination of Polymorph composition in Physical Mixtures by Near-Infrared Reflectance Spectroscopy, J Pharm Sci 2001, 90, 360-370.
- Agatonovic-Kustrin S, Wu V, Rades, T, Saville, D, Tucker, I G, Powder diffractometric assay of two polymorphic forms of ranitidine hydrochloride Int J Pharm 1999, 184, 107.
- Hurst, V.J., Schroeder, P.A., and Styron, R.W. Accurate quantification of quartz and other phases by powder X-ray diffractometry. Analytica Chimica. Acta, 1997, 337, 233-252
- Campbell Roberts, S.N., Williams A.C., Grimsey, I.M., and Booth S.W., Quantitative analysis of mannitol polymorphs. X-ray powder diffractometry—exploring preferred orientation effects J. Pharm. Biomed. Anal., 2002, 28, 1149-1159.