Abstract
There are multiple benefits to implementing process analytical technology (PAT) in active pharmaceutical ingredient (API) development and manufacturing. In the developmental stage, PAT is an ideal tool for in-depth process understanding to aid in the design of a robust process. During commercial API manufacture, the benefits of PAT shift to real time assurance (RTA), which ensures consistent product quality, thus eliminating the need for off-line testing and minimizing out-of-specification batches. The intent of this article is to show how PAT can be used to improve process understanding in the developmental stage as well as a tool for real time assurance in the manufacturing.
Introduction
There has been significant progress in the pharmaceutical industry on how to best capitalize on the benefits of process analytical technology (PAT) since the publication of the FDA guidance: PAT- A Framework for Innovative Pharmaceutical Development, Manufacturing and Quality Assurance [1]. Many successful PAT implementations have been reported for process chemistry [2, 3]. There are still lots of discussions about the role of PAT and how PAT can be best integrated into current practice of pharmaceutical development and manufacturing processes [2]. Based on its scope, PAT applications can be summarized into three categories: real time monitoring (RTM), real time assurance (RTA) and real time release (RTR). RTM is the use of PAT measurement to track attribute and/or parameters to provide a level of confidence of the performance of the chemical process. RTA is to ensure product critical quality attributes (CQAs) are met in real time using PAT, which is a step further than RTM. Real time quality assurance is achieved by monitoring the process feedback to control the process in real-time based on process signature or direct measurement of the attributes. To implement PAT applications for RTM, a certain level of method validation such as selectivity and sensitivity is required. RTR is the usage of PAT to release an intermediate or API for downstream processing without end-product testing. The benefits for RTR are potentially significant [4]. However, the use PAT for API or intermediate RTR is very challenging. First of all, there are considerable technical hurdles to assure all CQAs are met in real time. For example, certain tests such as impurity profile remain a challenge. Secondly, the acceptance of the regulatory bodies for RTR to replace end-product test is uncertain. Finally, RTR might not be financially justified if the production volume is small. PAT instrumentation has evolved from traditional univariate sensors such as temperature, pressure, pH, density and conductivity to encompass advanced techniques such as on-line mid-IR, near-infrared (NIR), Raman, UV-vis, mass spectroscopy and focused beam reflectance measurement (FBRM). In the development area, spectroscopic techniques are capable of monitoring the concentration of reagents, intermediates, and products as well as the physical property of the final product in real time. PAT is especially valuable for rapidly gaining fundamental understanding of the underlying mechanism and kinetics for process conducted at extreme conditions of temperature and pressure. This understanding, in turn, facilitates the design and optimization of economically viable and safe manufacturing. For example, unstable reaction intermediates in complicated multistep chemical reactions can be monitored through in-situ mid-IR spectroscopy, which provides insight into the reaction mechanism [5]. In-situ Raman spectroscopy is an ideal tool to study the polymorphic transformation during crystallization [6]. Mid-IR, near-IR and UV-Vis can be used to determine solvent and solute concentration during chemical reaction, distillation and crystallization. FBRM is a powerful tool that can measure particle size as particle formation during crystallization process [7]. On-line mass spectroscopy can be used to monitor the drying and vacuum distillation in real time without interrupting the process [8]. Within the manufacturing arena, PAT can increase efficiency as well as quality by minimizing process interruption for sampling need and feedback control.
The focus of this article is to show some examples of how PAT can be used to gain process understanding in the API development and real time quality assurance in the manufacturing stage. The first example involves using online UV-Vis spectroscopy and multivariate data analysis to generate a process signature for improved process understanding and RTA of a chemical reaction process. The second example demonstrates the implementation of on-line mass spectroscopy for real time monitoring the solvent composition in the head space to ensure the removal of undesired solvent in a biphasic vacuum distillation process.
Process Signature
The process signature of a chemical reaction, as used in this article, is defined as the characteristic reaction kinetics at the target conditions. In this example, an on-line UV-Vis spectrometer coupled with multivariate data analysis was used to generate process signature for a heterogeneous chemical reaction in real time. The process signature was then used to demonstrate the robustness of the reaction process with regard to the change of scale and equipment. It was also used to provide reaction progression information in real time and for RTA.
This chemical reaction was conducted under reflux condition as a heterogeneous mixture with a sodium bicarbonate slurry at the beginning of the reaction. The reaction product precipitated after it reached its solubility limit. Sodium bicarbonate was added to the reaction to neutralize byproduct hydrochloride to drive the reaction to completion. Reactions were conducted at laboratory scale (50 g), pilot plant scale (100 kg) and manufacturing scale (120 kg) in different reactors. An on-line process UV-Vis analyzer equipped with attenuation total reflectance (ATR) probe and a flash lamp light source was used to collect spectral data of the reaction mixture in-situ. The UV-Vis ATR probe was directly inserted into the reactor in the laboratory. It was interfaced to the process through a recirculation loop system in the pilot plant and manufacturing settings. UV-Vis spectra were collected at two minute interval over the spectral range of 186-720 nm. Off-line HPLC samples were taken during reactions to obtain the reactants and product concentration in the reaction mixture to develop and validate quantitative calibration models built on in-situ UV-Vis spectra.
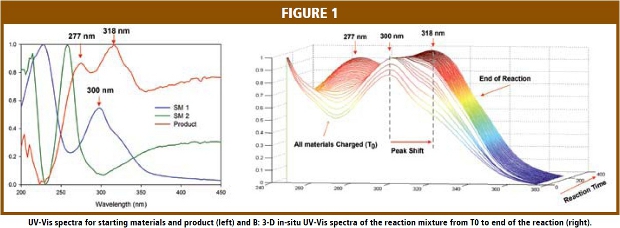
Figure 1A gives the solution UV-Vis spectra of the two starting materials and product in the reaction solvent, industrial methylated spirits (IMS). The spectra in Figure 1A were scaled for plotting purposes. It is evident that each of the three materials has unique UV-Vis spectral features. For example, starting material 1 (SM1) has a peak at 300 nm and starting material 2 (SM2) has peak at 258 nm, while the UV-Vis absorption peaks for the product are at 277 and 318 nm. At the same time, those absorption peaks overlap each other. Figure 1B shows the in-situ UV-Vis spectra of the reaction mixture obtained during a reaction. The shift of the 300 nm peak to 318 nm and the increased intensity of the absorption peak at 277 nm in the in-situ UV-Vis spectra clearly indicate the consumption of starting materials and the formation of the product. The overlapping spectral feature demands the use of multivariate data analysis tools to extract the chemical information from the UV-Vis spectra.
Partial least squares (PLS) calibration models were developed and validated using the off-line HPLC samples and corresponding in-situ UV-Vis spectra of the reaction mixture. The root mean square error of estimation (RMSEE) for the calibration samples is 0.0028, 0.0038 and 0.0045 g/mL while the root mean square error of prediction (RMSEP) is 0.0026, 0.0032 and 0.0027 g/mL for SM1, SM2 and the product, respectively. 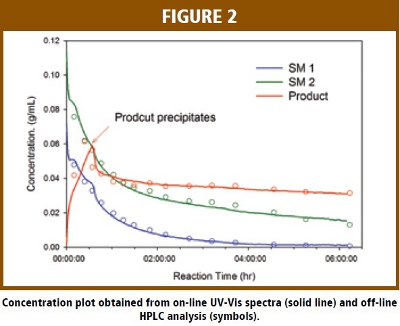 Figure 2 plots the PLS model calculated concentrations versus reaction time for starting materials and the product during a reaction using in-situ UV spectra. The solid lines in Figure 2 are the calculated concentrations while the HPLC values are overlaid on the same plot as symbols. The excellent agreement between the PLS calculated values and off-line HPLC values strongly suggest the concentration for each individual species in this reaction can be accurately determined from the in-situ UV spectral data and the PLS models.
The process signature for this reaction is represented as the concentration of SM1 versus reaction time. 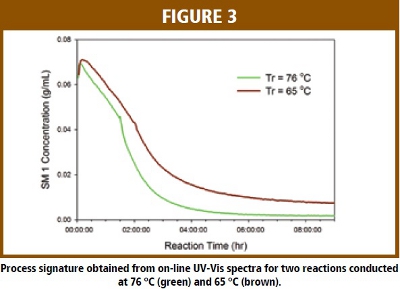 The overlaid process signatures for two reactions that were conducted at different reactor temperatures (Tr) are given in Figure 3. These two reactions were part of the design of experiment (DOE) study to optimize the reaction parameters. The process signature clearly shows the impact of Tr on the progression of the reaction. The reaction conducted at reflux temperature (76 ºC) proceeds much faster than the one run at 65 ºC. In addition, the reaction did not go to completion at lower Tr as the model showing there is a significant amount of un-reacted SM1 in the reaction mixture at the end of reaction. On-line UV-Vis clearly shows the capability of monitoring the progression of the reaction in real time.
 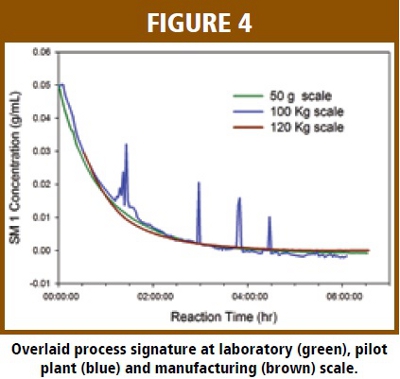 Figure 4 shows overlaid process signatures of the chemical reaction run at the laboratory, pilot plant and manufacturing scales. The spikes on the process signature are due to off-line sampling which stops the sample recirculation. It is evident that the process signatures are almost identical at different scales and in different equipments. This result illustrates that the reaction process is robust to the change of scale and equipment at normal operation ranges. By comparison, the process signature of to the typical reaction, it is possible to verify if the current reaction has progressed as expected or if there is some abnormality in the batch in real time.
Figure 5 superimposes the process signatures of nine batches run in a manufacturing campaign. It is evident that all batches had similar kinetic profiles except batch 4. For this batch, the consumption rate for SM1 was much faster than the other batches as well as a typical batch. It was later found that operator error in charging sodium bicarbonate caused this batch to have an abnormal process signature. For this outlying batch, it is important to note that the in-process monitoring sample did not flag its abnormality since it is an off-line HPLC analysis of SM1 %w/w at the 8th hour. The concentration of SM1 in the off-line sample met the specification (< 0.2 wt%). 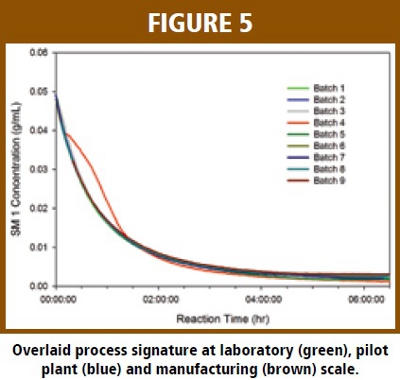 This batch was isolated and dried. Impurity content determination later found that it contained a much high level of a CQA impurity. This result indicates that it was not sufficient to ensure the quality of the product solely relying on the single off-line testing. Instead, the process signature provided a broader picture regarding the reaction in real time and demonstrated the potential capability for RTA and intervention based on the process signature of the consumption of the starting material.
On-line Mass Spectroscopy
Another technique that has been successfully applied for process monitoring is on-line mass spectrometry (MS) [8]. This technology is ideally suited to measure the composition of gas phase samples, so applying the technology for the monitoring a distillation process is a good fit. Other spectroscopic techniques can also be applied to distillation monitoring [3, 9], but MS has many distinctive advantages. Among them are rapid response speed, superior selectivity and sensitivity, ability to handle a wide range of sample pressures and simultaneously monitor a relatively large number of species.
The work outlined in this paper demonstrates that on-line mass spectroscopy can be used for real time monitoring the composition solvents in the head space during a vacuum distillation. This distillation process is a sequential batch distillation which serves the dual purpose of removing residual water from the previous wash step and replacing the initial solvent tert-butyl methyl ether (TBME), with a mixture of TBME and methyl cyclohexane (MCH). The removal of water (<0.1 wt%) is critical because water results in the product oiling out and poor impurity purgeability in the subsequent crystallization step. In addition, high amounts of residual water can cause high process impurity during the crystallization. The failure to remove water during the distillation has been identified as a potential root cause for previously failed batches.
To accurately determine the water content during the distillation has proven to be challenging in this case. Water has very limited solubility in the solvents, which results a biphasic mixture, making representative sampling and accurate off-line analysis difficult. The biphasic solvent system also makes the usage of on-line spectroscopic techniques such as mid-IR, NIR, UV-Vis to directly measure the solvent in reactor or the distillate inapplicable. Therefore, the measurement of head space vapor composition in the vacuum distillation vessel and then correlating to the solvent composition in the liquid phase through vapor-liquid equilibrium (VLE) curves is the preferred approach. 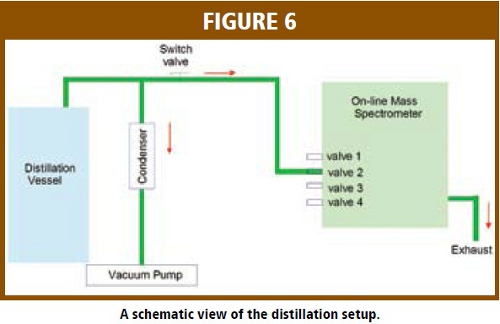 Although other on-line instruments such as mid-IR, NIR and GC are capable of measuring the vapor phase compositions, on-line MS has the advantage of high sensitivity and ease to interface with the vacuum distillation process because of its built-in pumping systems.
A schematic view of the distillation setup is shown in Figure 6. The sampling point for the mass spectrometer was located on the outlet line from the distillation vessel, just upstream of the condenser. A switch valve was used to allow the spectrometer to be connected or disconnected without disturbing the distillation process. The mass/charge values of 18, 73 and 84 amu were used to monitor water, TBME and MCH, respectively. The response from the on-line mass spectrometer is the ion current in mAmpere. The mole fraction for each component in the vapor phase can be calculated using following equation: (Equation 1)
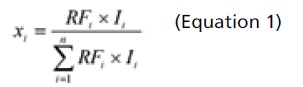
Where xi is the mole faction of solvent i in the vapor phase, RFi is the response factor of solvent i on the mass spectrometer, which mainly depends on the ionization efficiency of the solvent. The RF for water, TBME and MCH is 1.25, 0.50 and 0.53, respectively. Ii is the corresponding mass ion current measured by the mass spectrometer for solvent i. The calculated solvent mole fraction is independent on the distillation vacuum pressure.
Figure 7 shows the mole fraction trends for water, TBME and MCH during a course of vacuum distillation. At the beginning of the distillation step, the vessel started with a solvent of water mixed with TBME. As the distillation proceeded, distillate was collected and an equal amount of MCH was charged into the reactor. The mole fraction of MCH in the vapor phase was observed to gradually increase as the mole fraction and TBME was observed to decrease gradually, with the water vapor concentration increasing with MCH for approximately 4 hours. 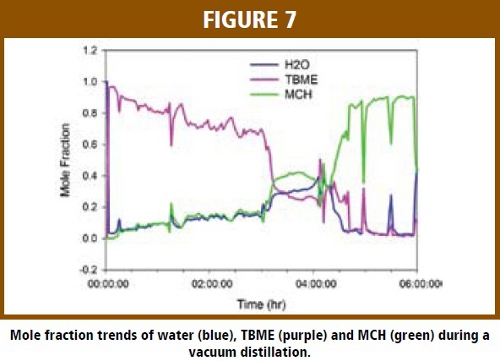 At approximately 4 hr into the process, the mole fraction of water and TBME decrease dramatically to near zero, which indicates the end-point of water removal. The disturbances (spikes) in the plot were the result of breaking the vacuum in the system to charge MCH. The trending of mole fraction in the vapor phase is sufficient to monitor the distillation process. However, the mole fraction of each solvent in the liquid phase can be calculated using the on-line mass spectrometer measured mole fraction in the vapor phase and the VLE equation [8].
It is evident that the on-line mass spectrometer is able to provide the RTM for the distillation for water removal in a biphasic system. Through analysis by mass spectroscopy in the vapor phase, we were able to overcome the sample inhomogeneity issue that caused problems for off-line sampling test and on-line vibrational spectroscopic techniques. By ensuring the removal of water in the distillation process through RTM using on-line mass spectrometer, the subsequent crystallization step not only reduce water induced process impurity but effectively purge out all impurities.
Conclusion
Implementation of PAT significantly improved process understanding in the developmental stages and can be used as a tool for real time assurance in the manufacturing process. The process signature demonstrates the robustness of the reaction process to the change of scale and equipment. It signaled an abnormal batch and can be potentially used for real time intervention for RTA. On-line mass spectrometer successful monitored a biphasic vacuum distillation process and ensured the removal of water in real time to ensure the final product quality. PAT is capable of RTM and RTA in the chemical development stage as well as the manufacturing stage
Acknowledgements
The authors would like to thank Dr. Gerald Terfloth and Dr. Leon Zhou for their invaluable insights into this article. The authors also thank Katherine Bakeev, Edward C. Webb, Hawthorne Graddy, Gary S. Lo and Megan Ackers for their contributions to this work.
References
1. U.S. Food and Drug Administration. PAT – A Framework for Innovative Pharmaceutical Development, Manufacturing, and Quality Assurance. Rockville, MD 2004.
2. Mojica, C. A.; Pierre-Berry, L. S. and Sistare, F. Process Chemistry in the Pharmaceutical. pp 361 – 381 Boca Raton : CRC, 2008.
3. Sistare, F; Pierre-Berry, L. S. and Mojica, C. A. Process Analytical Technology: An Investment in Process Knowledge. Organic Process Research & Development, 2005, 9, pp. 332-336.
4. Szechinski, W. PAT Applications in Active Pharamceutical Ingredient (API) manufacturing and the Advancement to Realtime Release. Process Analytical Technology, 2005, 2(6), pp. 20-22.
5. Trevisan, M. G.; Garcia, C. M.; Schuchardt, U. and Poppi. R. J. Evolving factor analysis-based method for correcting monitoring delay in different batch runs for use with PLS: Online monitoring of a transesterification reaction by ATR-FTIR. Talanta, 2008, 77(4), pp. 971-976.
6. Chen, J.; Patience, D.; Falco, N. J. and Pachera, R. Using In Situ Raman for Improved Process Understanding In Development of a Crystallization Process. American Pharmaceutical Review, 2009, 12(3), pp. 60-65.
7. Kougoulosa, E.; Jonesa, A. G.; Jennings, K. H. and Wood- Kaczmar, M. W. Use of focused beam reflectance measurement (FBRM) and process video imaging (PVI) in a modified mixed suspension mixed product removal (MSMPR) cooling crystallizer. Journal of Crystal Growth, 2005, 273(3-4), pp. 529-534.
8. Gervasio, G. J.; Chen, J.; Falco, N. J.; Sisk, S. J.; and Slapikas, A. Real Time Monitoring of Solvent Composition during Batch Distillations Using On-line Mass Spectrometry 55th Annual ISA Analysis Division Symposium, April, 2010, New Orleans, LA.
9. Bakeev, K. A.; Chen, J.; Gervasio, G. J. and Lo, G. S. Process analytical technology (PAT): use from development through implementation in the pharmaceutical industry. Proceedings of Centennial annual meeting of the American Institute of Chemical Engineers (AiChE). Philadelphia, PA. 2008, pp. 16-21.
Jun Chen, Ph.D., is an Investigator in the Chemical Development Analytical Sciences Department at GlaxoSmithKline. He has been involved in process understanding and control for API development and manufacturing using both process analytical technology and separation science. His educational background is vibrational spectroscopy, Chemometrics and numeric computation. His scientific interests include analytical method development and validation, process analytical technology for process understanding and control of unit operations, trouble shooting and problem solving.
Gregory Gervasio is a graduate of New Jersey Institute of Technology with a BS and MS from the Newark College of Engineering, Chemical Engineering department. His interest in PAT was developed through 15 years experience as a process engineer in both the research laboratory and manufacturing environment. During this time he developed his capabilities as a process control Engineer. In 1990 he took the next step and transferred to a process analytical position in Monsanto developing on-line PAT applications for manufacturing. There he implemented a wide range of on-line applications for manufacturing including; Raman, IR, NIR, UV, X-ray florescence, microwave spectroscopy, turbidity, refractive Index, density, pH and titrations. He is currently employed in the Chemical Development PAT group at GlaxoSmithKline where he added on-line mass spectroscopy to his portfolio.
Jim Rydzak is a Manager of the Process Analytical and Chemometrics group working on API development at GlaxoSmithKline, near Philadelphia, where he has worked for the past 10 years, a key person in starting the PAT group at GSK. Prior to working at GSK, he worked at Colgate-Palmolive for 16 years, first as a molecular spectroscopists, then started a Process Analytical Group in 1989 and later was a group leader and Analytical & Testing lab supervisor. Jim’s background in FT-IR, Raman and NIR spectroscopy led him into the field of Process Analytical. During his time at Colgate, he has been a member of the Directors of Industrial Research Process Analytical round table. More recently Jim was one of the founding members of the ASTM E55 committee on the Manufacture of Pharmaceutical Products. Jim got his B.S. in Chemistry in 1976 from Mount Union College in Alliance, Ohio and his M.S. in Analytical Chemistry working for Peter Griffiths at Ohio University in 1978. Jim has taught short courses in molecular spectroscopy with for the Center for Professional Advancement for eight years in Amsterdam and New Jersey in the 90’s. Jim has also teamed with Chris Hassell to run the Process Analytical Chemistry: Out of the Lab and into the Pipes course on PAT at the Federation of Applied Chemistry and Spectroscopy Societies (FACSS) conference for several years. Jim has been activate on the governing board and many offices in FACSS since 1996. He is also active in the Coblentz society and EAS.
Alireza Kord, Ph.D., heads the Analytical Sciences Department in Chemical Development at GlaxoSmithKline, King of Prussia, PA. He has close to twenty years of experience in the pharmaceutical industry and assumed his current position in 2003. His educational background and scientific interest is in the field of separation sciences including HPLC, CE, GC, etc.