Department of Chemical and Biochemical Engineering
Introduction
Pharmaceutical tablets are the most widely used dosage forms of oral drug delivery,1 accounting for nearly 80% of all dosage forms administered.2 Ideally, a “good” tablet should have good physical and chemical stability, high purity, an acceptable dissolution profile and good manufacturability. There are known knowledge gaps in the current tablet manufacturing processes, particularly regarding the relationship between material properties of ingredients, processing conditions, and resulting product attributes. A better understanding of tablet microstructure is essential in bridging this gap to enable the design of tablets with ideal properties for every formulation. Understanding the microstructure of a tablet requires knowing the spatial distribution of the different ingredients and void space, which is usually referred to as “chemical imaging”.
There are several techniques that can take high resolution pictures of tablet ingredient distribution but cannot go beyond an exposed surface layer. This limitation, coupled with the need to treat/prep samples before an analysis can make the overall process laborious and time consuming and produce results that might not be representative of the whole tablet. Spectroscopic imaging techniques have the ability to overcome some of the aforementioned issues. NIR Imaging has been particularly useful for extracting material distribution information.3-5 More recently,Raman Imaging, with its superior chemical specificity, and being less affected by the physical characteristics of samples, has been steadily gaining popularity. This article focuses on the use of Raman Imaging for obtaining 3D structural information of tablets with examples from two case studies.
Equipment and Method
A commercially available Raman imaging system was used for the studies described in this article. This device can achieve a spatial resolution (XY plane) of 10 X 10 micron with a depth scan (Z step) as low as 1 micron at every XY point. One of the prime highlights of this instrument is that it incorporates an automated grinder, which can shave layers off of a tablet during a run, thereby enabling the user to scan multiple layers and construct a 3D map of the sample structure. To perform the analysis, the tablet is mounted on a moving stage, and then shaved to a desired depth. The tablet is then moved in front of a camera screen, where it is scanned at the desired resolution. A Raman spectrum is obtained at each position and then analyzed using a Classical Least Squares (CLS) approach, where the spectrum is used to estimate the concentration of the different ingredients at each position. This is done by comparing the measured spectrum to the spectra of the pure ingredients, which have been “rescaled” to account for differences in density between the reference ingredients and the tablet. In the simplest and most common type of analysis, each pixel in the scanned image is assigned to the ingredient that dominates the pixel. Each ingredient is assigned a different color, generating an image that represents the spatial distribution of ingredients. This process is carried out for multiple layers in a tablet. Multicolor maps, with each color representing a particular ingredient, can be generated to show the general distribution for each layer or for the tablet as a whole (see Figure 1).
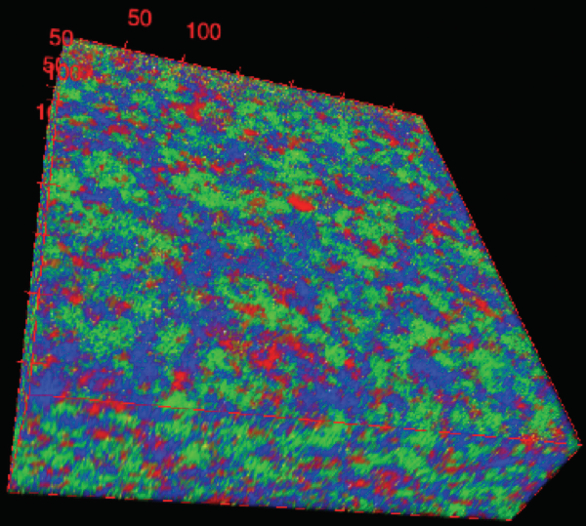 Figure 1. 3D image showing clustering of API (red) in a four ingredient formulation tablet.
Subsequent image analysis, coupled with statistical methods, can be used to extract structural information. For example, the size distribution of domains of an individual ingredient can be characterized. Current intervals of particle size distribution can be easily depicted, such as, less than 50 microns, between 50-250 microns, greater than 250 microns, etc. (see Figure 2).
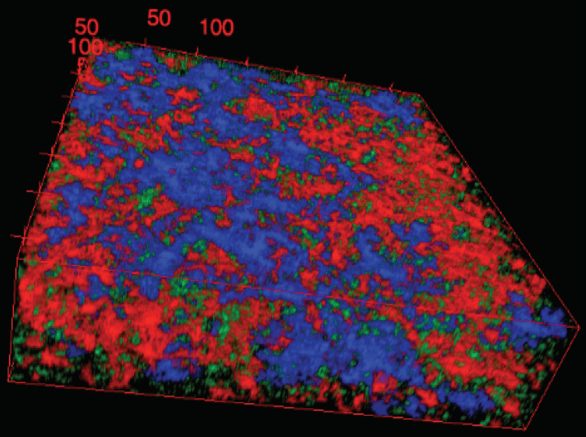 Figure 2. 3D image showing the distribution of API in a tablet: green - particles50 microns.
Specific Case Studies
To illustrate the use of this technique, two case studies are described wherein tablets are manufactured using two different routes – Direct Compaction and Wet Granulation:
Direct Compaction: This method is the simplest manufacturing route wherein the dry raw materials are blended and fed directly into the tablet press. The cohesiveness of the Active Pharmaceutical Ingredient (API) and its percentage in a formulation, among other factors, can cause API lumping or agglomeration, which may lead to the production of tablets that are sub potent or super potent. Super potent tablets can have adverse effects on a patient’s health, particularly when the drug has a narrow therapeutic index. To evaluate the degree of agglomeration, the mPAT 3D Raman Imaging system was used to visualize the spatial distribution of the API within these tablets. The images obtained showed the localized clusters of API in red (see Figure 1) for one such super potent tablet. These clusters can be categorized based on their size to estimate a rough particle size distribution (see Figure 2).
Wet Granulation: This is a relatively well established tablet manufacturing route but involves additional processing steps before tableting. The dry powders may be pre blended after which they are mixed with a liquid binder in a granulator. In this case study, powders were blended prior to the granulation step using two different methods: (a) batch mixing in a bin, and (b) delumping by co-feeding ingredients to a Comil, followed by continuous blending. Despite the fact that wet granulation accommodates material variability better than direct compression, heterogeneity within tablets is still observed. Additionally, depending on if the dry powders are pre blended in a batch blender or a continuous blender, the degree of heterogenetiy can vary. Tablets produced from powders blended in these two manners were evaluated using the Raman imaging device and showed a stark difference in API distribution (see Figure 3.)
 Figure 3. 3D images of part of a tablet produced where the raw materials were pre blended in a (a) continuous blender, (b) batch blender
Conclusions
The direct compaction case example demonstrated the effect of an inherent API property on its distribution within a tablet. This knowledge could now be used to correlate observable differences in this specific tablet’s dissolution profile or hardness with that for a “normal” tablet. Similarly, the visual illustration of the 3D spatial distribution of the ingredients within a tablet gives a valuable insight into the effects of different blending techniques in a manner previously perceived as challenging while providing an additional perspective on understanding the nuances of the two processes. Looking forward, there are many possibilities for improving our understanding of product and process design, whether to understand effects of materials and process variables on product structure, or to examine how product structure impacts product performance. Many approaches are easily identified: correlating material attributes and process variables to a tablet’s structure and its performance, understanding the effect of varying excipients of API characteristics, examining the impact of granule size distribution on product performance, studying the distribution of the polymorphic forms within a sample, and many other applications.
References
- USP 39-NF 34: Pharmaceutical dosage forms 2016.
- Jivraj M, Martini LG, Thomson CM: An overview of the different excipients useful for the direct compression of tablets. Pharm Sci Technol Today 2000, 3(2):58–63.
- Khorasani M, Amigo JM, Sonnergaard J, Olsen P, Bertelsen P, Rantanen J: Visualization and prediction of porosity in roller compacted ribbons with near-infrared chemical imaging (NIR-CI). J Pharm Biomed Anal 2015, 109:11-7.
- Khorasani M, Amigo JM, Sun CC, Bertelsen P, Rantanen J: Near-infrared chemical imaging (NIR-CI) as a process monitoring solution for a production line of roll compaction and tableting. Eur J Pharm Biopharm 2015, 93:293-302.
- Zhou L, Xu M, Wu Z, Shi X, Qiao Y: PAT: From Western solid dosage forms to Chinese materia medica preparations using NIR-CI. Drug Test Anal 2016, 8(1):71-85.