Abstract
In a typical pharmaceutical solution, water is 103 – 106 more concentrated than the API, which is fully surrounded by water molecules. This provides an opportunity to use spectroscopic signals from water to assess the quality of pharmaceutical solutions. In this article, examples of using the water proton NMR signal for chemical analysis are presented. Water proton NMR can be conducted noninvasively (without opening the vial) using inexpensive benchtop time-domain NMR spectrometers. The measurement is very simple and fast. This feature makes it possible to collect quantitative data on every vial of a drug product in its entire lifecycle, from point-of-release to point-of-care.
Introduction
Drug products are mixtures of chemicals packaged inside sealed containers (vials, bottles, pre-filled syringes, etc.). Quality control of drug products rests on chemical analysis. Chemical analyses for drug products in general are invasive in that they require unsealing the container and transferring its content to some instrument for analysis. This creates a problem; the very act of analysis tampers with the drug product, rendering it unsuitable for release. The current solution to this problem is sampling plus visual inspection. In each batch, invasive quantitative analyses are performed on a small number of units (sampling) while noninvasive visual inspection is performed on all units. Based on the results from sampling and visual inspection, a decision is made as to whether the un-sampled units in the batch are releasable. This practice creates a data gap in drug products: there are no quantitative data on the released units.
Quality control based on sampling and visual inspection has two inherent limitations. Sampling might miss rare but serious defects while visual inspection cannot detect defects invisible to the human eye. The requirement of optical transparency imposes further constraint on visual inspection. The consequence is that defective drug products might reach the patient and cause harm. The likelihood for this unfortunate scenario is heightened for biologics for two reasons. First, the complexity of biomanufacturing means errors are more likely. For example, a manufacturing error led to the recall of 33 batches of insulin Novomix 30® by the European Medicines Agency in October 2013.1 The error caused the insulin concentration in some cartridges either too high or too low by up to 50%, which could lead to hypoglycemia or hyperglycemia. Indeed, shortly before the recall, in September 2013, there was a report of a patient who collapsed at home in a hypoglycemic state after taking Novomix 30®.2 Only 0.14% of the cartridges were affected, which is perhaps why the defective units escaped pre-release sampling, which typically involves 10-20 units per batch for biologics.3
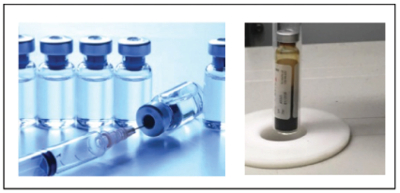 Figure 1. Invasive (left) vs. noninvasive (right) analysis. Invasive analysis requires taking the drug solution outside the vial for data collection while non-invasive analysis can collect data with the drug solution sitting inside the sealed container. While invasive analysis is performed on only a few randomly selected vials in a batch at the point-of-release (sampling), noninvasive analysis can be performed on every vial in a batch at both point-of-release and point-of-care.
Second, the fragility of biologics (proteins, cells, etc.) means they are more susceptible to mis-handling in the distribution chain, especially when formulated as solutions. Physical stresses, such as temperature excursion, freeze/thaw, agitation and sunlight, are hard to avoid completely and might damage the drug product. For example, after a spike of pure red cell aplasia cases in Thailand in patients taking Eprex®, a study found that 27% of prefilled syringes of Eprex® distributed by local retail pharmacies had protein aggregate levels above release specification, which was attributed to violations of the cold storage chain.4 Violations of storage conditions for biologics is neither rare nor restricted to retail pharmacies. Case in point, a report in 2012 by the Inspector General Office of the US Department of Health and Human Services concluded that vaccines for children “stored by 76 percent of 45 providers we reviewed were exposed to inappropriate temperatures” and “none of the 45 providers we reviewed met the vaccine management requirements in all 10 categories”.5 This is a worrisome finding for those concerned with the safety of vaccines and other biologics.
Cases like Novomix 30® and Eprex® expose the limitations of the current practice of drug quality control. The root cause of the problem is our inability to inspect every vial in a batch in a noninvasive and quantitative fashion. Quantitative inspection of every vial at the point-of-release can spot rare defects while quantitative inspection at the point-of-care can detect damages incurred after product release.
Quantitative inspection of every vial requires suitable analytical technologies, which, aside from being noninvasive and quantitative, should be fast, simple and economical. In this article, we discuss a technology with such potential, water proton NMR.
Borrowing from Medical Diagnosis
While noninvasive data collection is lacking in pharmaceutical analysis, it is an integral part of medical diagnosis. Various imaging modalities utilize either electromagnetic waves (e.g., X-rays, CT and MRI) or sound waves (ultrasound) to probe a patient’s body without cutting and piercing. In this regard, pharmaceutical analysis can borrow from medical diagnosis. For the quality control of injectables, MRI offers an attractive example to emulate. The signal source in MRI is water, which is present at very high concentration in injectables. The electromagnetic wave used in MRI lies in the radiofrequency range, which can easily penetrate through the drug container (even when the container is not optically transparent) but will not damage the drug molecule due to its low energy.
Below, we offer several examples from our own work where solutes, mostly proteins and peptides, in aqueous solutions are monitored through the 1 H2 O NMR signal. In MRI, the main concern is spatial information and therefore it requires a 3D magnetic field gradient, which makes the instrument very expensive, complex and bulky. In pharmaceutical analysis, the main concern is chemical information and therefore requires only regular NMR spectrometers with constant field. In fact, for practical applications, benchtop NMR spectrometers suffice in most cases.
Examples of Using 1 H2 O NMR to Monitor Solutes in Aqueous Environment
Figure 2 shows the 1 H NMR spectra of an aqueous solution of bovine serum albumin (BSA, 66 kDa). The intensity of NMR signals from a molecule (more precisely, from the nuclei in that molecule) is proportional to the concentration of the molecule. In this solution, water (55 M) is 2.5 × 10⁵ more concentrated than BSA (2.2 × 10⁻⁴ M). Without water suppression, the only visible signal is the 1 H2 O signal. With water suppression, the protein 1 H signals become visible, but still weaker than the 1 H2 O signal (complete water suppression is hard to achieve) and very complex. This situation is rather typical for biologic solutions in that the protein signals are 104 – 106 times weaker than the 1 H2 O signal and vastly more complex.
 Figure 2. 1H NMR spectra of an aqueous solution of bovine serum albumin (15 mg/mL) in PBS (pH 7.4) without (left) and with (right) water suppression. The spectra were acquired using a 9.4 Tesla (400 MHz for 1H) NMR spectrometer at room temperature.
It is rather difficult to conduct quantitative analysis on a sealed vial of protein solution through the protein 1 H signals due to their low intensity and high complexity even using high-field NMR spectrometers. However, the 1 H2 O signal can be easily detected and characterized using low-field benchtop NMR spectrometers within 1-2 minutes. In essence, water is used as an NMR “dye” to probe the solute. But, unlike fluorescent dyes, which collect local information about the solute, water, being the solvent, collects global average information about the solute.
Of the various aspects of the 1 H2 O signal, we found that the transverse relaxation rate, R2 ( 1 H2 O), is most sensitive to solute chemistry. Figure 3 provides an example of using R2 ( 1 H2 O) to monitor protein concentration and aggregation. In the absence of aggregation, R2 ( 1 H2 O) grows linearly with protein concentration. In the presence of heat-induced aggregation, R2 ( 1 H2 O) displays non-linear growth with protein concentration. At a given protein concentration, aggregation caused a jump of R2 ( 1 H2 O), the magnitude of which depends on protein concentration and the extent of aggregation. The results shown in Figure 3 indicate that R2 ( 1 H2 O) has the potential to detect concentration error (e.g., Novomix 30®) or protein aggregation (e.g., Eprex®) in biologics.
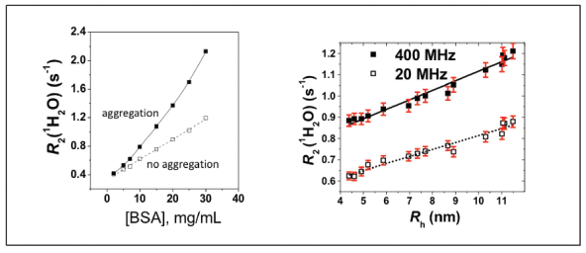 Figure 3. (left) R2(1H2O) vs. BSA concentration with and without heat-induced aggregation. (right) R2(1H2O) vs. Rh, the average hydrodynamic radii of BSA aggregates. Rh was determined by dynamic light scattering.
Typical high-field super-conducting NMR spectrometers have sample tube diameters ≤ 0.5 cm and therefore cannot accommodate most drug vials. Besides, high-field superconducting NMR spectrometers are bulky, costly and require significant expertise to operate and maintain. For water NMR to be applicable to drug product inspection, lowfield permanent magnet NMR spectrometers with a wide bore have to be used. Fortunately, R2 ( 1 H2 O) can be easily measured using such NMR spectrometers and many benchtop NMR spectrometers can accommodate vials with diameters of 5 cm or larger.
The right panel of Figure 3 compares R2 ( 1 H2 O) collected using a super-conducting spectrometer (400 MHz) and R2 ( 1 H2 O) collected using a benchtop spectrometer (20 MHz) against aggregate size. R2 ( 1 H2 O) data at 20 MHz have approximately the same sensitivity (linear slope) as R2 ( 1 H2 O) data at 400 MHz. For drug product analysis, once such a calibration curve is established for a given product, R2 ( 1 H2 O) could be used to determine the average size of protein aggregates in a vial noninvasively.
In addition to protein aggregation, we have shown that R2 ( 1 H2 O) can detect surfactant micellization. In that case, the water proton signal even detected a second micellization step that escaped detection if monitored by the surfactant proton signal.6
Part of the sensitivity of R2 ( 1 H2 O) comes from water-protein proton exchange,6 which will be affected when protein concentration changes or when proteins aggregate. This aspect is illustrated in Figure 4 using two model peptides. The amino acid sequences of the two oligopeptides, K11 and E11, are respectively acetyl-KW(KA)3 KWK-amide and acetyl-EW(EA)3 EWE-amide. They both have alternating charged-neutral sequence pattern and their molecular weights are almost identical (1,413 Da for K11 and 1,419 Da for E11). However, K11 has six amino groups in its six Lys (K) side chains while E11 has six carboxylic groups in its six Glu (E) side chains. At pH 7.4, the amino group of the Lys side chain is protonated (-NH3+, pKa = 10.8) and thereby has exchangeable protons while the carboxylic group of the Glu side chain is deprotonated (-COO−, pKa = 4.1) and thereby has no exchangeable protons. Consequently, K11 has more exchangeable protons than E11 per molecule. At identical peptide concentration, R2 ( 1 H2 O) of the K11 solution is much higher than R2 ( 1 H2 O) of the E11 solution. The effectiveness of a solute in relaxing 1 H2 O can be gauged by the slope of the R2 ( 1 H2 O) vs. C(solute) plot, which is 0.087 s-1 (mg/mL)- 1 for K11 and 0.027 s-1 (mg/mL)-1 for E11. This suggests that due to the presence of more exchangeable protons in K11, it is much more efficient in relaxing water than E11.
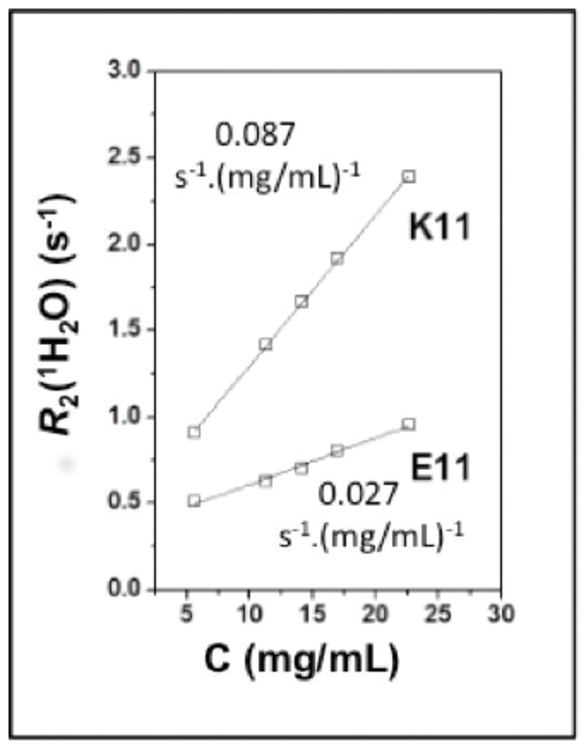 Figure 4. R2(1H2O) vs. concentration of two oligopeptides K11 and E11 in PBS buffer (pH 7.4). R2(1H2O) were measured using a 9.4 Tesla (400 MHz for 1H) NMR spectrometer at room temperature.
Characterizing biomaterials is another possibility offered by 1 H2 O NMR. The advantage of using water to probe biomaterials is that although the dynamics of the 1 H2 O signal is sensitive to material assembly, its intensity remains very high because water is still very mobile in such materials (this feature makes MRI possible). In contrast, the constituent molecules (peptides, proteins, polysaccharides, etc.) of biomaterials are to a great extent immobilized and therefore their NMR signals become very weak. Previously, we have shown that R2 ( 1 H2 O) can be used to assess biomaterial stiffness8 and detect the clustering of paramagnetic metal chelates anchored inside biomaterials.9
More recently, we explored using 1 H2 O NMR to monitor biomaterial assembly in real time. We selected the gelation of K11 and E11 peptides as the model system to demonstrate feasibility. Figure 5 shows the gelation process monitored by both the transverse relaxation time of water protons, T2 ( 1 H2 O), and the proton signal intensity of peptide gelators, I( 1 H-gelator). It can be seen that T2 ( 1 H2 O) and I(1 H-gelator) display very similar time course, suggesting that the 1 H2 O NMR signal can be used to monitor material assembly in real time, provided the process is not too fast (minutes or longer). As shown in Figure 5, as gelation proceeds, the gelator signal intensity gradually diminishes, and hence it takes longer and longer time to acquire the gelator signal. In contrast, the 1 H2 O retains its intensity during the gelation process and T2 ( 1 H2 O) can be rapidly measured throughout.
 Figure 5. Gelation of K11/E11 mixture monitored by the transverse relaxation time of 1H2O, T2(1H2O) (= 1/R2(1H2O), black dots), and the 1H signal intensity of peptide gelators, I(1H-gelator) (red dots). To facilitate comparison, the starting values of T2(1H2O) and I(1Hgelator) are normalized to 1. The concentration of both K11 and E11 is 4 mM. Data were collected using a 9.4 Tesla (400 MHz for 1H) NMR spectrometer.
Conclusion
Studies have shown that it is possible to use the water proton NMR signal to monitor solutes in aqueous solutions and materials through the transverse relaxation rate R2 ( 1 H2 O). This feature makes it possible to conduct noninvasive quantitative inspection of complex drug products using 1 H2 O NMR. In essence, R2 ( 1 H2 O) serves as a composite index for drug products, analogous to the stock index in economy. The drug maker needs to specify the acceptable range of R2 ( 1 H2 O) for a product, which can be used to judge every vial of that product, from point-of-release to point-of-care. The hope is to improve drug safety and reduce healthcare cost by rooting out defective drug products.
Acknowledgement: The work described in this article has been supported by the FDA through MCERSI and the Maryland State Government through MII.
References
- European Medicines Agency (2013) Batches of the insulin medicine NovoMix 30 FlexPen and Penfill to be recalled. http://www.ema.europa.eu/ema/index.jsp?curl=pages/news_ and_events/news/2013/10/news_detail_001933.jsp&mid=WC0b01ac058004d5c1
- FDA (2013) MAUDE Adverse Event Report on 09/27/2013. http://www.accessdata.fda.gov/ scripts/cdrh/cfdocs/cfmaude/detail.cfm?mdrfoi__id=3621493
- Mathonet, S. et al., PDA J. Pharmaceut. Sci. Technol. 70, 392-408 (2016)
- Fotiou, F. et al., Clin. Ther. 31, 336-346 (2009)
- Office of the Inspector General. Department of Health and Human Services. Vaccines for Children Program: Vulnerabilities in Vaccine Management. June 2012. Available from: http://oig.hhs.gov/oei/reports/oei-04-10-00430.pdf
- Feng, Y., Taraban, M.B., Yu, Y.B. Chem. Comm. 51, 6804-6807 (2015)
- Taraban, M.B. et al., J. Pharm. Sci., 104, 4132-4141 (2015)
- Feng, Y., Taraban, M.B., Yu, Y.B. Chem. Comm. 50, 12120-12122 (2014)
- Weerasekare, G.M. et al., Biopolymers (Pept. Sci.) 96, 734-743 (2011)
Author Biographies
Yihua Bruce Yu, PhD, is professor of pharmaceutical sciences at the University of Maryland School of Pharmacy and the director of its Bioand Nano-Technology Center. He has conducted research on protein biophysics, biomaterials and imaging agents. His current research is on analytical technologies for complex drugs, including biologics and nanomedicnes.
Yue Feng, PhD, was a postdocotoral fellow at the University of Maryland School of Pharmacy. He is currently NMR spectroscopist, working (under contract) at Pfizer, Groton, CT. His research interests are complex biofluids analysis, NMR based metabolomics and application of in vivo Magnetic Resonance Spectroscopy (MRS).
Marc Taraban, PhD, is assistant professor (research) in the Department of Pharmaceutical Sciences at the University of Maryland School of Pharmacy. He was actively involved in research in the areas of structural biology, biophysics of enzymatic reactions and structure-properties relationships in soft matter biomaterials. Currently, he is exploring dynamic NMR applications to study biologics and nanoparticle products.