Introduction
Academic research groups celebrate the departure of students that move to industry or other research groups. The success of the research group depends on managing student turnover as graduates move on to positively impact other laboratories. Turnover, is essential at the academic level, contrary to industry where the departure of an experienced scientist is a significant loss and where personnel changes can jeopardize operations. However, at academic, government, and industrial labs there is a need to create expertise in near infrared (NIR) spectroscopy and chemometrics, which are important elements of Process Analytical Technology (PAT).
This article describes an experiment performed in the training of new undergraduate and graduate students who start their research in this research lab. The same exercise could be performed in an industrial setting for personnel that move to a unit dedicated to PAT. The exercise is easy to conduct and does not require toxic or expensive components. The principal requirement is the availability of a Fourier Transform near infrared spectrometer. This article is a complement to a previously published exercise described in this journal, which explained the changes in spectral baseline observed in near infrared spectral applications.1 This article also facilitates the training of students and scientists new to NIR spectroscopy.
Description
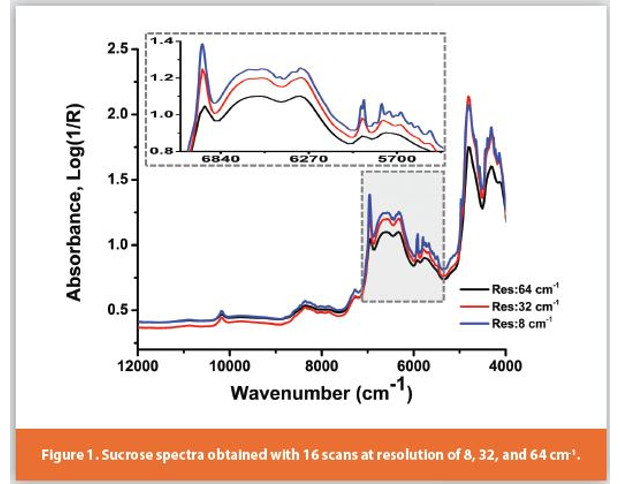
This training requires the use of sucrose. A simple envelope of crystalline sucrose obtained from a coffee shop is sufficient. The first part of the experiment consists in obtaining spectra while varying the resolution. Figure 1 shows the diffuse reflectance spectra obtained using a fiber optic probe accessory, where a total of 16 scans were averaged at resolutions of 8, 32, and 64 cm-1. The acquisition of these spectra requires that a background spectrum be obtained for each of the different resolutions. These diffuse reflectance NIR spectra may be obtained with a fiber optic probe or with an integrating sphere.
Subscribe to our e-Newsletters
Stay up to date with the latest news, articles, and events. Plus, get special offers
from American Pharmaceutical Review – all delivered right to your inbox! Sign up now!
The sucrose should be placed to obtain a sample thickness of at least 10 mm. This thickness is recommended since the depth of penetration of NIR radiation may be as high as 5 mm. Thus, having a 10 mm thick sample assures that any material below the sucrose will not have an effect on the NIR spectrum.
Observation of NIR spectra
NIR spectra mainly consist of C-H, N-H, and O-H overtones and combination bands. “Vibrational spectroscopy made complicated is NIR made possible” as indicated by Miller in one of the most comprehensive chapters on NIR spectroscopy.2 NIR spectroscopy would not exist if all molecules strictly followed the harmonic oscillator model taught in physical chemistry courses. The harmonic oscillator model calculates equidistant energy levels with transitions between neighboring energy levels (transitions from the ground to the first excited level) and provides a good estimate of fundamental vibrational bands observed in mid-infrared spectroscopy. However, the overtones observed in NIR spectroscopy are explained by transitions from the ground state to a second or third excited state.3
The NIR spectrum may also show a single band from the combination of two or more vibrations. There are multiple vibrational modes associated with the functional groups which correspond to single fundamental vibrational frequencies. As an example, the six fundamental vibrational bands observed for chloroform in the mid-infrared spectrum give rise to over 30 vibrational modes observed in the NIR spectrum.2 These multiple vibrational modes lead to significant overlapping in NIR spectroscopy, making it extremely challenging to assign the bands observed to functional groups.
The extremely complex NIR spectra are difficult to interpret, but can be used to identify the raw materials received in a pharmaceutical plant. The identification of incoming raw materials with NIR spectroscopy is now a well-established application.4 The incoming materials may be identified in terms of their chemical composition, crystallinity, and according to variations in moisture content or particle size. Crystalline sucrose could be easily discerned from amorphous sucrose which would not present the sharp band observed at 6960 cm-1 and shown in Figure 1.5 The 6960 cm-1 band is associated with the crystallinity of sucrose and is lost when melting occurs and the crystal structure is lost.5,6 The difference in the spectra of the crystalline and amorphous forms is an example of the ability of NIR spectroscopy to provide valuable information on the physical properties of materials.
NIR spectroscopy requires developing the ability to observe subtle differences in NIR spectra. These subtle differences depend on the chemical composition and physical properties of the materials analyzed, and also the spectral resolution used to measure the NIR spectrum. Figure 1 shows that at a spectral resolution of 8 cm-1 two bands are observed at 5932 and 5913 cm-1. However, when the resolution is decreased to 32 cm-1 only a single band is observed at 5924 cm-1. Multiple bands are observed around 5700 cm-1 at 8 cm-1 resolution but these are not observed as the resolution decreases to 32 and 64 cm-1. At a resolution of 8 cm-1, the sharp band at 6960 cm-1 has a stronger intensity than the neighboring wide bands that range from 6880 – 5970 cm-1. The difference in the intensity of these bands is much less at a resolution of 32 cm-1. Finally, at a resolution of 64 cm-1, the 6960 cm-1 band becomes weaker than the neighboring wide bands. Some articles state that NIR spectroscopy consists of wide overlapping bands. However, Figure 1 shows that the NIR spectrum may also consist of a number of narrower bands, which often require a higher resolution.
Figure 2 (bottom) shows the spectral noise observed for a spectrum consisting of a single scan and a second spectrum consisting of 16 averaged scans at a resolution of 8 cm-1, in a spectral region which did not include absorbance bands from the sucrose. The detector noise decreases approximately by the square root of the number of scans averaged leading to the lower noise observed with 16 scans. This is known as the multiplex or Fellgett advantage.7 Figure 2 (top) also shows the same spectral region obtained with a single scan at a lower resolution of 64 cm-1. The spectra are shown in the same scale for comparison. The advantage of using a lower resolution is the lower spectral noise and the faster spectral acquisition. A resolution of 32 or 64 cm-1 might be suitable for a number of applications.8 In some applications the higher resolution could facilitate the development of a partial least squares (PLS) regression calibration model, as it becomes easier to differentiate between the components of a mixture. However, the higher resolution will increase the time needed to obtain the NIR spectra and the noise observed. These are important tradeoffs that all PAT scientists need to consider.
The sucrose spectra also provide an excellent opportunity to discuss the effect of hydrogen bonding on NIR spectra. The sharpness of the O-H first overtone observed at 6960 cm-1 band is indicative of a free O-H.6 Below the 6960 cm-1, a wide band is observed which is indicative of hydrogen bonding. The wide band possibly occurs because of the multitude of slightly different hydrogen bonded states in the molecules. Thus, the NIR spectrum is clearly showing the complexity of the sucrose molecule, which includes significant hydrogen bonding but also a free O-H.

Hydrogen bonding also affects the intensity of the bands observed in NIR spectra. The intensity of the NIR and also mid-infrared spectral bands is directly proportional to the change in dipole moment observed during a vibrational transition.2 In mid-infrared spectra, hydrogen bonding increases the intensity of the fundamental donorhydrogen stretching bands observed.9 However, hydrogen bonding also makes the hydrogen atom more bulky. The donor hydrogen is not as free to vibrate due to hydrogen bonding, and its anharmonicity is lower. This anharmonicity is the reason for the bands observed in NIR spectroscopy.
The intensity of O-H bands in the NIR spectra is more complicated than in midinfrared spectra complex since it depends on both the anharmonicity of the vibration and the change in dipole moment. This “complication” could be the reason why NIR spectra have been valuable in discerning between polymorphs of drug candidates,10 and in studying the variation in the performance of active pharmaceutical ingredients received for pharmaceutical manufacturing.11
Conclusion and Acknowledgments
This article provides an introduction to the importance of resolution in NIR spectra, through an experiment that may be easily performed in laboratories that have an FTNIR spectrometer. This simple experiment is focused on developing new practitioners of NIR spectroscopy and increasing expertise in the field. The author thanks graduate student Adriluz Sanchez for preparation of figures.
References
- Romañach, R. J.; Hernández Torres, E.; Roman Ospino, A.; Pastrana, I.; Semidei, F., NIR and Raman Spectroscopic Measurements to Train the Next Generation of PAT Scientists. American Pharmaceutical Review 2014, 17 (6), 82-87.
- Miller, C. E., Chemical Principles of Near-Infrared Technology. In Near-Infrared Technology in the Agricultural and Food Industry, second ed.; American Association of Cereal Chemists: St. Paul, 2001; pp 19-37.
- Siesler, H. W., Basic Principles of Near-Infrared Spectroscopy. In Handbook of Near-Infrared Analysis, Third Edition, Ciurczak, E. W.; Burns, D. A., Eds. CRC Press: 2007; pp 7-19.
- Blanco, M.; Romero, M. A., Near-infrared libraries in the pharmaceutical industry: a solution for identity confirmation. Analyst 2001, 126 (12), 2212-2217.
- Romañach, R.; Román-Ospino, A.; Alcalà, M., A Procedure for Developing Quantitative Near Infrared (NIR) Methods for Pharmaceutical Products. In Process Simulation and Data Modeling in Solid Oral Drug Development and Manufacture, Ierapetritou, M. G.; Ramachandran, R., Eds. Springer New York: 2016; pp 133-158.
- Davies, A. M. C.; Miller, C. E., Tentative Assignment of the 1440-nm Absorption Band in the Near-Infrared Spectrum of Crystalline Sucrose. Appl. Spectrosc. 1988, 42 (4), 703-704.
- Griffiths, P. R.; de Haseth, J. A., Fourier Transform Infrared Spectrometry. Second ed.; 2007; p 560.
- Colón, Y. M.; Vargas, J.; Sánchez, E.; Navarro, G.; Romañach, R. J., Assessment of Robustness for a Near-Infrared Concentration Model for Real-Time Release Testing in a Continuous Manufacturing Process. J Pharm Innov 2017, 12 (1), 14-25.
- Mayo, D. W.; Miller, F. A.; Hannah, R. W., Course Notes on the Interpretation of Infrared and Raman Spectra. John Wiley & Sons, Inc.: Hoboken, NJ, 2004; p 567.
- Barnes, S. E.; Thurston, T.; Coleman, J. A.; Diederich, A.; Ertl, D.; Rydzak, J.; Ng, P.; Bakeev, K.; Bhanushali, D., NIR diff use refl ectance for on-scale monitoring of the polymorphic form transformation of pazopanib hydrochloride (GW786034); model development and method transfer. Analytical Methods 2010, 2 (12), 1890-1899.
- Dziki, W.; Bauer, J. F.; Szpylman, J. J.; Quick, J. E.; Nichols, B. C., The use of near-infrared spectroscopy to monitor the mobility of water within the sarafloxacin crystal lattice. J. Pharm. Biomed. Anal. 2000, 22 (5), 829-848.