Small Molecule Analytical Chemistry Department
Small Molecule Pharmaceutical Sciences Department
Abstract
This paper describes a Transmission Raman Spectroscopy (TRS) method for the content uniformity analysis of a solid oral dosage form of an early phase development compound. A partial least squares (PLS) model was built to quantitate the API content in tablets. The model used six latent variables and, using a venetian blinds cross validation, showed comparable root mean square errors for calibration and cross validation (RMSEC = 0.31, RMSECV = 0.42). The tablets analyzed were from a formulation design of experiment (DOE) study exploring excipient content, API content, and granule solid fraction. The linearity of expected versus measured results showed good correlation between the two (r2 = 0.997). This method was compared to an HPLC method for both accuracy and precision. TRS results generally agreed well with HPLC results, especially when matrix effect was not an issue. Both methods had comparable precision. TRS method was affected by compaction force during dry granulation and was shown to produce consistently higher results with higher compaction forces due to matrix effect.
Introduction
Raman spectroscopy has long been demonstrated to be a valuable method for pharmaceutical analysis on dosage forms such as tablets, powders and liquids.1-5 In the pharmaceutical industry, backscattering Raman has been used to probe reactions, bulk materials, and drug products with the drawback of penetration depth.6 For drug products, this limitation has been shown to heavily bias coatings, capsule shells, and other surface features.7 Advancements in methodologies and instrumentation have overcome this limitation to enable easier penetration of light through solid materials and allow the quantitative bulk analysis of intact solid dosage forms, making transmission Raman a more readily adopted tool for manufacturing and development use.8-11 The most notable applications of transmission Raman are for the quantitation of active pharmaceutical ingredients in dosage forms12-15 and determination of crystalline and polymorphic contents in pharmaceutical formulations.16-18
Quantitation of active pharmaceutical ingredients in dosage forms, including the confirmation of uniformity of dosage units, is a critical aspect of pharmaceutical analysis to ensure the quality of drug products. This is traditionally performed by HPLC given its wide accessibility and proven reliability. TRS has been gaining momentum over the last decade or so in replacing HPLC for this analysis.3,8 Compared to HPLC, TRS is well recognized for consuming no organic solvents and therefore generating no hazardous waste. A significant advantage of TRS over HPLC is that the non-destructive TRS scans samples in their original form and generates data for greater product understanding. For example, Sparén et al investigated the matrix effects (particle sizes of drug substance and filler, granule solid fraction) on the transmission Raman responses for a tablet formulation,4 and found that the matrix factors can affect the Raman spectra and the quantitation of the drug content. Impact of material properties such as particle size was also reported by others for TRS analysis.19,20 These studies showed the potential of TRS in helping understand product characteristics and support drug product development in applications beyond the content analysis.
Subscribe to our e-Newsletters
Stay up to date with the latest news, articles, and events. Plus, get special offers
from American Pharmaceutical Review – all delivered right to your inbox! Sign up now!
The current study applied transmission Raman spectroscopy for content uniformity testing of tablets containing a wide range of excipient levels and manufactured with granules at different solid fractions. The tablets were from a design of experiment (DOE) study to support formulation development of an early phase development program. The content uniformity analysis was performed by both TRS and HPLC, with HPLC results as a reference to those by TRS. TRS results revealed the impact of granule solid fraction on the predicted drug content level, and suggested its applicability during early development phase.
Materials and Methods
Preparation of Tablets
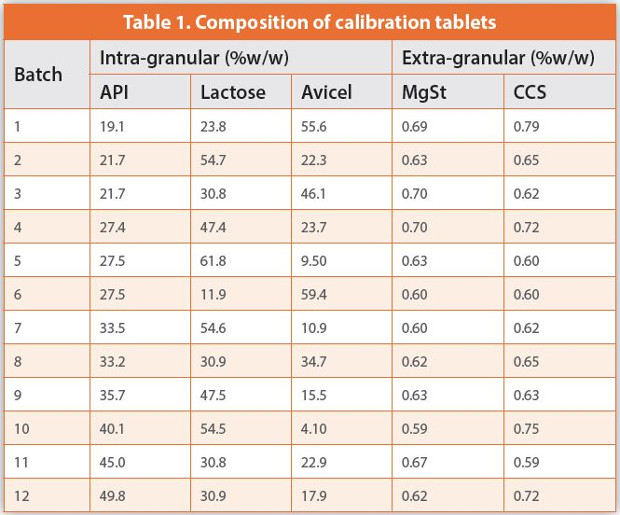
Twelve batches of calibration tablets (Table 1) were made by blending the intra-granular materials (API, lactose and Avicel) using a shaker mixer and then compressing the blend into a slug. The slugs were ground with a mortar and pestle, mixed with the extra-granular materials and then manually pressed into tablets using oval shaped tooling and a benchtop press. For the experiment design of the calibration set, levels of the intra-granular materials were varied while maintaining the level of the extra-granular components, magnesium stearate (MgSt) and croscarmellose sodium (CCS), at a relatively constant level as shown in the table. All tablets were at the total weight of 500mg and pressed to achieve the same final tablet density.
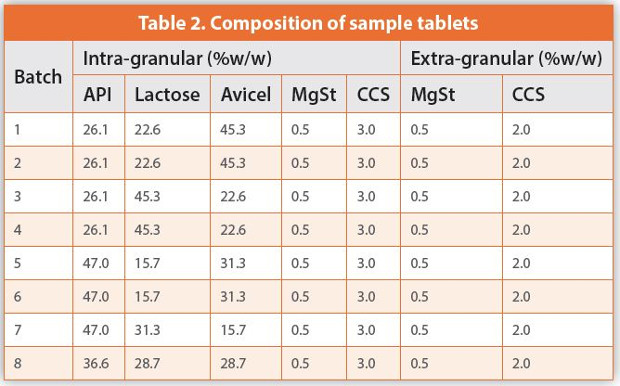
Sample tablets were produced for the formulation DOE study with the compositions shown in Table 2. The study was designed to vary API content, level of excipients, and granule solid fraction. Batches 1-4 were manufactured by roller compaction of the intra-granular materials. The granule was then mixed with the extra-granular materials. Tablets were then compressed using an automatic rotary tablet press. Batches 1 and 2 were from the same pre-blend, with the granules compacted at different forces of 2 kN/cm and 6 kN/cm, respectively, at a roller gap width of 2 mm. The same holds for batches 3 and 4. The remaining batches were manufactured in an identical fashion to the calibration batches, namely, using slugging to surrogate dry granulation. Different levels of slugging force were applied to reach the target solid fraction. The slugging was performed using a square-shaped tooling with dimension of 35 x 13 mm (length x width). The slugs were ground with pestle and mortar, sieved through a 20 mesh screen, blended with extra-granular excipients and then manually pressed to tablets. The target weight was 500 mg.
Transmission Raman Spectroscopy (TRS)
Raman data were collected using an incident beam emitted at 830nm and a spot size of 4mm. Each scan used a laser power of 0.6W and a collection duration of 0.1s. For each measurement, 20 scans were collected and all spectra were summed to get one composite spectrum. Five spectra were taken for each tablet to ensure repeatability of the instrument. A total of 120 spectra were used for the calibration batches.
Data analyses were performed using Solo software. Spectra were input directly into Solo. Raw spectra were processed by applying a second derivative, standard normal variate scaling, and mean centering. A multivariate analysis was applied to quantitate the level of API in the tablets, drawing from a three variable Y block. Six latent variables were selected to encompass the varied excipient and compression levels.
HPLC Method
After Raman analysis, each tablet was marked and individually run by HPLC. The HPLC method used a Cadenza C18 column (3.0x150mm, 3.0μm), 12.5mM potassium phosphate in water (pH 2.3) as mobile phase A and acetonitrile as mobile phase B. Other method parameters included flowrate of 1.0mL/min, detection wavelength of 254nm, column temperature of 30°C, and 5μL injection volume by an auto sampler. The method gradient profile was shown in Table 3.
Results and Discussions
Raw spectra of the major components (the API, Avicel and Lactose) in the formulation were shown in Figure 1(a). Avicel spectrum had a large baseline change, adding a significant challenge to model building as peaks were distorted when the spectra were normalized. Lactose spectrum showed many peaks of various intensity, some of which overlap with peaks for the API. These issues made it challenging to select the appropriate spectral regions and spectral processing method for accurate API quantitation.
To overcome these issues, all sample spectra were averaged to obtain a mean spectrum that allows the selection of spectral regions specific to API while minimizing the likely interference from the major excipients. As shown in Figure 1(b), the major peak contributions were primarily associated with the API content. The peaks between 1400 cm-1 and 1700 cm-1 showed the best correlation for the API. Even though peaks below 1400 cm-1 began to give varied results due to the baseline elevation from the Avicel, it was still necessary to consider this region to enhance the reliability of the model. Therefore, the best model was found to used spectral regions 983-1294 cm-1, 1376-1395 cm-1, and 1478-1573 cm-1 as highlighted in Figure 1(b).

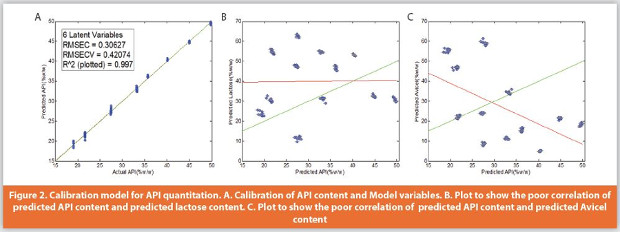
The model for API quantitation showed good linearity across the entire calibration range (r2 = 0.997, Figure 2). Calibration was verified using a venetian blind method, testing a total of 20 latent variables with a maximum of 60 non-consecutive spectra removed for any given iteration. This cross validation was very positive as the root mean square error of the calibration, and the root mean square error of the cross validation were very comparable (RMSEC = 0.31, RMSECV = 0.42). The predictions for API content did not show correlation with either lactose or Avicel content, confirming that the model was specific for API alone.
Table 4 is a compiled list of all results as %label claim (%LC) by both TRS and HPLC analyses. The results agreed reasonably well between the two methods, and showed similar precision. Also included in Table 4 are the granule solid fractions of the batches, which were calculated as the apparent ribbon/slug density divided by the preblend true density. Batches made with the same intra-granular materials appeared to have higher TRS results when granules were roller compacted at higher forces and possessed the higher solid fraction. There was no similar observation for HPLC results. These results signified the effect of the tablet matrix on the TRS quantitation of the API. Since higher compaction force was not considered for the calibration tablets and therefore not built into the calibration model, the prediction was worse for those batches with higher solid fraction.
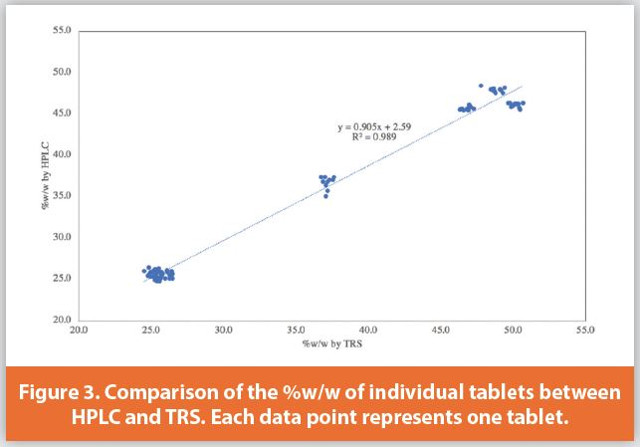
For individual tablets within each batch, there was a positive correlation for the API content between the HPLC and TRS results (Figure 3). A t-test was further performed for the results of individual tablets (Figure 4). As seen from Table 4 and Figure 4, there was a very large difference in the results by the two methods for Batch 7, which might skew the comparison. So, the t-test was performed both with and without Batch 7. A p value of 0.054 was obtained without Batch 7 (vs. <0.0001 with the batch), confirming no statistically significant difference in the results by TRS and HPLC. Further work needs to be conducted to understand what contributed to the large difference in Batch 7 results.

In addition, the instrument reproducibility was assessed by replicate spectral collection for each tablet. For all 8 batches, the largest %RSD of the %LC based on replicate spectral collection (n=5) was 0.44%, and the minimum %RSD was 0.06%. The average %RSD value across all batches was 0.22%, showing that the variability contributed by the instrument was well below the variability expected for content uniformity and supporting the validity of the model for quantitation of the API content.
Conclusions
A transmission Raman spectroscopy method was developed to quantitate the API content in tablets that were highly varied in excipient level, API content and compaction force. The results demonstrated the acceptable reproducibility and precision of the method, as confirmed by the HPLC results of the same tablets, and further proved that transmission Raman could be a valuable tool for accurate content uniformity analysis.
The results of the current study also revealed the impact of parameters such as roller compaction force on TRS signal and quantitation results. This matrix effect has been reported by other researchers.4,19 It is possible to develop calibration models that can further explore this effect and expand the application of TRS beyond the content analysis for solid dosage development.
References
- Vankeirsbilck T, Vercauteren A, Baeyens W, et al. Applications of Raman spectroscopy in pharmaceutical analysis. Trac-Trends Anal Chem. 2002; 21(12): 869–877.
- Esmonde-White K.A., Cuellar M., Uerpmann C., et al. Raman spectroscopy as a process analytical technology for pharmaceutical manufacturing and bioprocessing. Anal Bioanal Chem 2017; 409(3):637-649
- Matousek P, Buckley K. Recent advances in the application of transmission Raman spectroscopy to pharmaceutical analysis. J Pharm Biomed Anal. 2011; 55(4): 645-652
- Sparén, A., Hartman, M., Fransson, M., Johansson, J., & Svensson, O. 2015. Matrix Effects in Quantitative Assessment of Pharmaceutical Tablets Using Transmission Raman and Near- Infrared (NIR) Spectroscopy. Applied Spectroscopy. 2015; 69(5): 580–589.
- Lim Y, Han J, Woo Y, Kim J, Kang M. Rapid quantitation of atorvastatin in process pharmaceutical powder sample using raman spectroscopy and evaluation of parameters related to accuracy of analysis. Spectrochim Acta A Mol Biomol Spectrosc. 2018; 200:26-32
- Johansson J, Pettersson S, Folestad S. Characterization of different laser irradiation methods for quantitative Raman tablet assessment. J Pharm Biomed Analysis. 2005; 39(3-4): 510-516
- Matousek P, Everall N, Littlejohn S, Nordon A, Bloomfield M. Dependence of Signal on Depth in Transmission Raman Spectroscopy. Appl. Spectrosc. 2011;65(7): 724-733
- Griffen JA, Owen AW, Andrews D, Matousek P. Recent Advances in Pharmaceutical Analysis Using Transmission Raman Spectroscopy. Spectroscopy. 2017;32(4):37-43
- Kim B, Woo Y. Coating process optimization through in-line monitoring for coating weight gain using Raman spectroscopy and design of experiments, J Pharm Biomed Analysis. 2018; 154:278-284
- Harting J, Kleinebudde P. Development of an in-line Raman spectroscopic method for continuous API quantification during twin-screw wet granulation, Euro J Pharm Biopharm. 2018; 125: 169-181
- Barimani S, Kleinebudde P. Monitoring of tablet coating processes with colored coatings, Talanta. 2018; 178: 686-697
- Matousek P, Parker AW, Bulk Raman Analysis of Pharmaceutical Tablets, Appl. Spectrosc. 2006; 60(12): 1353-1357
- Hargreaves M, Macleod N, Smith M, Andrews D, Hammond S, Matousek P. Characterisation of transmission Raman spectroscopy for rapid quantitative analysis of intact multicomponent pharmaceutical capsules. J Pharm Biomed Anal. 2011; 54(3): 463-468
- Griffen J, Owen A, Matousek P. Comprehensive quantification of tablets with multiple active pharmaceutical ingredients using transmission Raman spectroscopy-A proof of concept study. J Pharm Biomed Anal. 2015; 115:277-282
- Li Y, Igne B, Drennen J 3rd, Anderson C. Method development and validation for pharmaceutical tablets analysis using transmission Raman spectroscopy. Int J Parrm. 2016; 498(1-2): 318-325
- Kumar A, Lubach JW, Griffen J, et al. Fast non-destructive detection of low level crystalline forms in amorphous spray dried dispersion using transmission raman spectroscopy and comparison to solid-state NMR spectroscopy. Am Pharmaceutical Rev. 2016; 19(1)
- Feng H, Bondi RW Jr, Anderson CA, Drennen JK 3rd, Igne B. Investigation of the Sensitivity of Transmission Raman Spectroscopy for Polymorph Detection in Pharmaceutical Tablets. Appl Spectrosc. 2017; 71(8): 1856-1867
- Netchacovitch, L, Dumont E, Cailletaud J. Development of an analytical method for crystalline content determination in amorphous solid dispersions produced by hot-melt extrusion using transmission Raman spectroscopy: A feasibility study. Int J Pharm. 2017; 530(1-2):249-255
- Townshend N, Nordon A, David L, Andrews J, Dallin P. Effect of Particle Properties of Powders on the Generation and Transmission of Raman Scattering. Anal. Chem. 2012; 84(11): 4665-4670
- Gomez D, Coello J, Maspoch, S. The influence of particle size on the intensity and reproducibility of Raman spectra of compacted samples. Vibrational Spectroscopy. 2019; 100: 48-56
Author Biographies
Jeffrey Davis acquired his B.S. degree in Chemistry from UC Santa Cruz in 2009. He has been working in the analytical sciences since then and recently joined the Small Molecule Analytical Chemistry department in Genentech in late 2017.
Jane Li obtained her Ph.D. in Analytical Chemistry from Iowa State University under the direction of the late Dr. James Fritz, and was a research investigator at GlaxoSmithKline before joining Genentech. She is currently a Senior Scientist in the Small Molecule Analytical Chemistry department of Genentech, with extensive experience in the analytical research and development for small molecule drug development.
Wei Zhang received his B.S. degree in chemistry in 2011 from Peking University in China and his Ph.D. in Pharmaceutical Sciences in 2016 from the University of Wisconsin-Madison. His thesis study focused on the material dependence of surface diffusion of amorphous organic solids. After getting his doctorate, Wei started as a formulation scientist in Small molecule pharmaceutical sciences department of Genentech. His current research focuses on small molecule drug formulation development.
Stefanie Gee is currently a Scientific Researcher in the Small Molecule Analytical Chemistry department of Genentech. She obtained her B.S. degree in Chemistry and Biochemistry from California Polytechnic State University, San Luis Obispo, CA and has been with Genentech since 2007 working in the analytical research and development area.
Larry Wigman is an Analytical Chemist by training with his doctorate from Duke University under the direction of the late Charles Lochmuller. He has held various positions in Pharmaceutical Development including: Senior Research Scientist at Pfizer, Manager at Mylan, Associate Director at Sanofi, Principal Consultant at Regulitics LLC, Principal Scientific Manager at Genentech; and, most recently Head of Analytical Sciences at Arena Pharmaceuticals. Larry joined the growing Tech Ops Group at Arena Pharmaceuticals to guide the analytical develop of the exciting portfolio.