Abstract
In vitro dissolution profile is an important requirement for extended release solid dosage forms. Compared to immediate release dissolution, more direct analyst intervention is necessary because of multiple sampling and sample preparation. Each of these steps can be very time consuming, and in many cases can result in laboratory errors. This is especially true when working on extended release tablets, which have more than four time-points, up to 24 hours. In-situ Fiber Optics UV Dissolution methods overcome this labor intensive sampling and the technology has been recognized as a useful alternative to conventional dissolution tests, as either a research tool for optimizing new formulations or as a quality-control test for routine monitoring of production batch quality. This article discusses results of an evaluation of this technology on the analysis of Compound A 24-hour extended release tablets. Method validation parameters including specificity, linearity, in-matrix accuracy/recovery, method precision, intermediate precision, robustness, and solution stability are addressed.
Keywords
Dissolution, in-situ Fiber Optic UV
Introduction
In vitro dissolution profile is an important requirement for both immediate-release and extended-release solid oral dosage forms. Dissolution testing is not only a quality attribute to ensure high quality of the product at the release and during storage, but is also a critical tool for formulation development and selection, and bioequivalence studies. In comparison with the immediate-release dosage form studies, the dissolution analysis for extended-release dosage forms involves multiple measurements at several intervals over relatively long periods. Each of these steps can be very time consuming and add wide variability to the results; thus, making it difficult to identify the trends and effects of formulation changes. In order to face the challenge of enhancing drug quality with greater efficiency, obtaining accurate and rapid dissolution results from the already complex and time-consuming testing is greatly desired.
The in-situ fiber optics dissolution methodology has been considerably recognized in the past decade for its characteristics of requiring low labor intensity, reducing the data turn-around time, and accelerating formulation development [1-3]. Its usage markedly increased with the production of the detecting systems, probe types, [4] and sampling approach [5]. Many publications have presented technical evaluations on the advantages and disadvantages of fiber optics instruments [6-8], as well as providing chemometric approaches to the solution of excipients interference in in vitro fiber optics dissolution testing [9]. Others have discussed the applications on the dissolution determination of immediate-release formulations [10,11]. In regard to implementing a method as a quality-control method, the fiber optics method has gained significance from a novel technology into a validated procedure in compliance perspective [12-14]. It was pointed out by the USP [15] that an alternative method may be used if it provided advantages in terms of accuracy, sensitivity, precision, selectivity, or adaptability to automation, provided that the alternative procedure or method can be validated. A literature search revealed no complete report on the fiber optics method validation for analyzing 24-hour extended release formulations. In order to develop an acceptable alternate method, one of the challenges we had to overcome was the lack of clear guidance on the assessment of the validity of methodology. Another was to design a validation approach that could meet compliance requirements and evaluate technical characteristics without bias.
This article discusses the validation results on a fiber optics dissolution method for a 24 hour extended-release 180-mg tablet formulation of Compound A. There were 4 time points targeted in the in vitro dissolution profile for this product: 2-hr, 8-hr, 14-hr, and, at 24-hr with a minimum of 80% dissolved. The parameters evaluated included specificity, linearity, accuracy/recovery/precision, repeatability, intermediate precision, solution stability, and robustness in accordance with the FDA guidance [16] and the Dissolution Method Development and Validation of USP General Chapters [17]. The validation range covered the entire release range, and the criterion was set based upon the USP acceptance criteria for dissolution testing.
Experimental
Sample, Solvents and Reagents
Compound A reference substance used as a working reference standard was qualified using the USP method against a USP reference standard.
Compound A working standard solution was prepared at a concentration of 0.18 mg/mL in water using the reference substance.
Water used in this study was obtained using a water purification system.
The medium used was 1000 mL of 0.9% (w/v) sodium chloride in water, and was vacuum degassed before use.
Compound A Tablets were an extended-release formulation with strength of 180 mg Compound A per tablet. One batch of tablets from the manufacture scale was used in the validation.
Sample Solutions
- Linearity solutions
A series of six linearity solutions were prepared by appropriately diluting the Compound A standard stock solution of 1.8 mg/mL with water. The target concentration levels were 5, 25, 50, 75, 10% and 125% of the label claim, corresponding to 9, 45, 90, 135, 180 and 225 μg/mL, respectively.
- Specificity solution
Solutions of placebo consisted of all the excipients excluding drug, and had a concentration equivalent to the placebo amount in one tablet.
- Accuracy/Recovery
The spiked solutions were prepared at three levels in the presence of excipients, i.e., 5%, 100% and 125%. Each level was prepared triplicate.
Apparatus and Equipment

Figure 1 - Fiber Optics System Diagram
The instrument used in this study was a multi-channel, fiber optic-based UV spectrometer system. Figure 1 presents the system diagram for the fiber optics configuration [18]. A set of six arch probes were illuminated with UV light through optical fibers; the light passed through sample solutions and into the vessel through optical fibers to the CCD Spectrometer (205 – 410 nm), where the absorbance was measured. A path length of 10 mm was used for the sample analysis. The UV wavelength was selected at 257 nm and the baseline correction on a single wavelength was set at 300 nm. The blank intensity spectra were acquired for both standard solutions and dissolution media. The optimum exposure time was set using the automatic option while probes were fully immersed in the dissolution media in the dissolution vessels. A number of 4 scans were acquired for each reading for signal averaging. All dissolution tests were performed using a USP type 2 apparatus equipped with paddles set at 50 rpm and media thermostated at 37.0 ± 0.5 °C.
Procedure
Prior to all experiments, the fiber optics system and the dissolution apparatus were qualified and calibrated according to the approved procedures.
- System suitability
System suitability was assessed at the beginning of each experiment by calibrating probe responses. The standard solution was measured in duplicate. The response factor, i.e. absorbance verse the concentration, of the standard was determined, and the ratio was at least 1 ± 0.05.
- Specificity and interference
Specificity was examined by analyzing the solutions of placebo. The experiment was performed at 37 °C in dissolution vessels and with 50 rpm rotational speed. The percent interference for each channel was calculated against 100% standard solution by the formula proposed by USP General Chapter<1092>. A total of 5 readings every 30 seconds for 3 minutes were collected.
- Linearity
The linearity range of all six channels was tested on a series of six dilutions of Compound A spanning from 5% to 125% of the label claim. The solutions were transferred in solution tanks, and the absorbance of each solution was measured by all six channels simultaneously. Five readings were collected every 30 seconds for 3 minutes.
- Accuracy/Recovery/Precision
Table 1 - The experiment designed for accuracy/recovery study

The accuracy/recovery/precision study was conducted in USP Apparatus 2 at 50 rpm and in dissolution media at 37 °C. In the experiment, the sample solutions prepared in subsection 2.2.3 were transferred in the dissolution vessels and kept at 37 °C in dissolution baths. For each trial, the probes were randomly arranged in the dissolution vessels as shown in Table 1, and the solutions were measured by collecting one reading every 30 seconds interval for 3 minutes. The absorbance of each solution was measured by fiber optics system, and the % recovery was calculated. This design resulted in triplicate determinations by each probe as an independent channel for each set of spiking solutions of three levels. The %RSD of the recoveries at each level was evaluated together with the repeatability and intermediate precision results to assess the overall precision of the method.
- Repeatability and intermediate precision
The precision of the method was determined by measuring the repeatability and the intermediate precision. The repeatability was assessed by performing two separate dissolution tests (n=6) on the same batch by one analyst on two different days. The intermediate precision was assessed by performing two independent dissolution tests (n=6 for each) on the same batch by different analysts on two different days. Sampling time points were acquired from each vessel for 6 readings (four scans per reading) until 5 minutes; then 94 readings every 15 minutes up to 24 hours. The absolute mean values of the % dissolved between the two setups at each target time point were compared.
- Solution stability
The standard solution stability was assessed by measuring the absorbance of the Compound A solution kept at ambient condition for 7 days.
The sample solution stability was determined by measuring the 100% level spiking solution in the dissolution media kept at 37 °C and with rotational speed of 50 rpm for 48 hours.
- Robustness
The robustness study on the dissolution procedure involved the deliberate changes of three specific parameters for this type of fiber optics system, including media temperature, rational speed, and UV wavelength. A dissolution experiment of six dosage units was performed at the nominal method condition and at each of the desired parameter. Since the UV absorbance was collected from 200 to 400 nm, the recalculations of the absorbance at UV 255 nm, and 259 nm, respectively, were used for the assessment.
Results and Discussion
Specificity
Table 2 - % Interference of the excipients
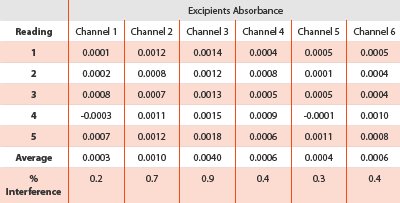
In this study, specificity was examined by analyzing placebo interference at the measured wavelength. The individual measurements for each channel from each vessel were presented in Table 2. The percent interference ranged from 0.2% to 0.9% which was calculated against the 100% level standard solution as described in USP General Guidance. An acceptance criterion of not exceeding 2% was normally adopted. For this study, the interference was due to the false increase in the absorption measured by the excipients; the undissolved particulates that were present in the measurement path length, absorbed or scattered the UV light. This suggested that utilization of the placebo version of the finished dosage forms might be a solution to the interference from the in situ determination. Because it can minimize the effect of placebo blend dumping.
Comparison UV spectra for the active ingredient and placebo are provided in Figure 2. The excipients exhibited high UV interference at 215 nm, but minimal interference at the selected wavelength of 257 nm.
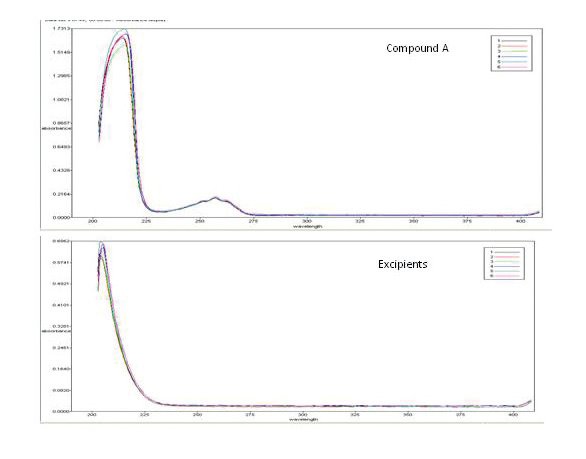
Figure 2 - UV spectra of Compound A and the excipients for all six probes
Linearity
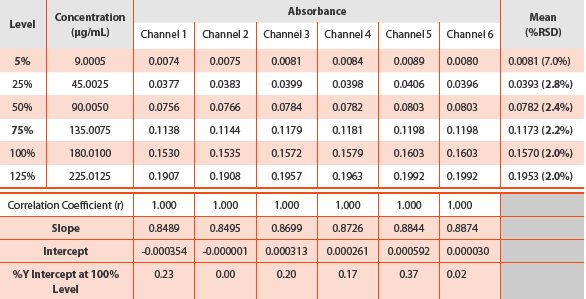
Linearity was assessed for all six channels. The absorbance and regression results obtained from each channel are given in Table 3. The excellent linearity of r ≥ 1.000 exhibited at all channels and the y-intercept is not significantly different from zero.
Table 3 - Linearity results
Accuracy/Recovery/Precision
Table 4 - Accuracy and recovery results
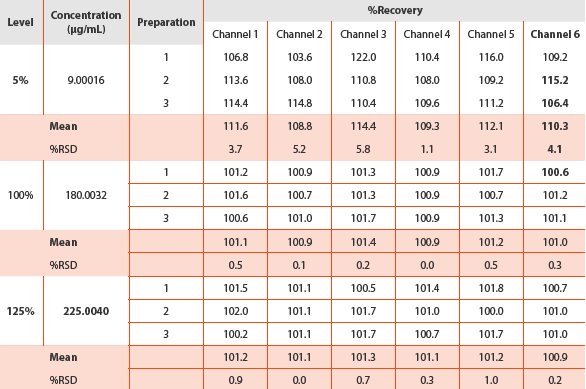
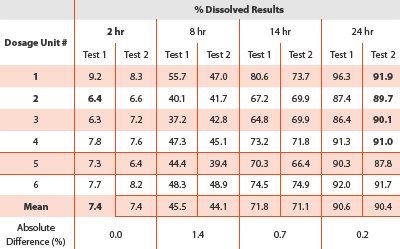
Table 5 - Method precision results of two setups by one analyst
The accuracy of the dissolution test was verified by recovery experiments which were calculated as the percentage of the drug recovered from the formulation matrix. The percent recoveries obtained (Table 4) were considered acceptable. The recovery at 5% level for the six channels ranged from 108.8% to 112.1% with the RSD of 1.1% to 5.8%. As expected, the results generated at the low level for the earlier time points were the most significant because they had the highest potential for variation by excipient interference. In contrast, the recoveries obtained at both 100% and 125% levels approached 100%. The recoveries at 100% level for the six channels ranged from 100.9% to 101.2% with RSD less than 0.5%; the recoveries at 125% level for the six channels were tight which ranged from 100.9 to 101.3% and RSD less than 1.0%. The dissolution method was therefore demonstrated to be accurate.
Repeatability
Repeatability was performed by one analyst on two different days. The absolute difference between the means of the percent dissolved was all below 1.4 % for all the target time points, despite the tablet-to-tablet variations. The assessment of the method precision (Table 5) indicated that it was acceptable.
Intermediate Precision
Table 6 - Intermediate precision results of two setups by two analysts

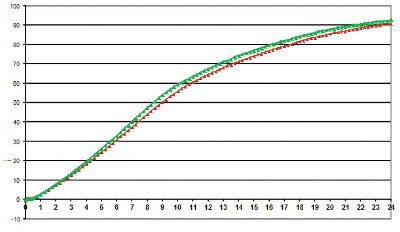
Figure 3 - Comparable release profiles generated by different analysts on different days
The intermediate precision was evaluated by comparing the dissolution profiles obtained by two analysts, and performed on separate days. The acceptance criterion from the USP General Chapter <1092> [17] was cited to interpret the results; the difference in the mean value between the dissolution results must not exceed an absolute 10% at time points with less than 85% dissolved and must not exceed 5% for time points above 85%. As shown in Table 6, without even taking into account the tablet-to-tablet variation, the release at the early time points of all results, including those levels below 85%, were below the allowable limit. Additionally, Figure 3 represents the more detailed data points from the experiment, and led to identical profiles from day-to-day and analyst-to-analyst.
Robustness
Table 7 - Robustness results
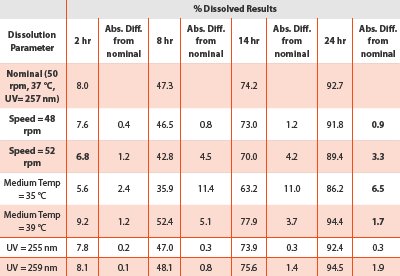
The results in Table 7 demonstrated that the changes in the wavelength and paddle speed did not impact significantly on the release rate. Despite the tablet-to-tablet variation, the absolute difference between the means at all target time points met the USP criterion of being less than ± 5% for the end time point with the release of Q =85%. However, the impact of changes in the media temperature was noticeable on the drug release rate.
Standard and Sample Solution Stability
Table 8 - Standard solution stability at ambient condition
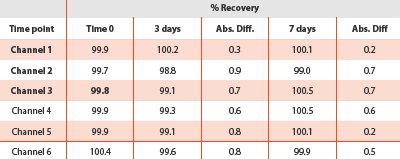
The standard solution stability was evaluated under ambient laboratory conditions and was stable for 7 days. The absolute difference of the percent recovery was calculated against the initial at each time point. The results tabulated in Table 8 range from 0.2% to 0.9%.
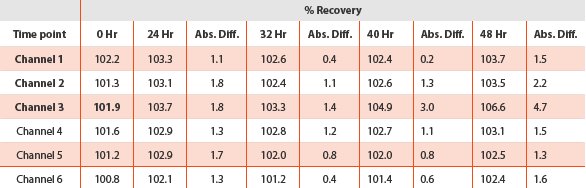
The sample solution stability was investigated on the 100% level spiking solutions in dissolution vessels at 37 °C, with all six probes immersed in the solutions and paddle speed of 50 rpm. One reading (4 scans every reading) was collected every 4 hours up to 48 hours. By comparing with the initial value, the absolute difference of the recovery from each channel was less than 2% at 24 hours, and less than 5% at 48 hours.
Table 9 - Sample solution stability at 37 °C and with paddle speed of 50 rpm
Conclusion
A study was conducted to evaluate in-situ fiber optics dissolution method for an extended-release formulation. The method validation results demonstrated that the fiber optics dissolution method can successfully be validated from the compliance standard point. The method is simple and convenient for generating precise, accurate, reproducible and robust dissolution for extended-release formulation containing a single active ingredient. The validation, which was assessed according to the current requirement, was acceptable for the intended application, and the design of the method minimized the potential variations that may compromise quality.
Acknowledgement
The authors would like to thank Dr. David Rogers for his valuable comments on this article. They also thank Ms. Maria Zymka and Ms. Suneeta Banala for their precious help on the validation.
References
- Josefson, M., Johansson, E., Torstensson, A., Optical Fiber Spectrometry in Turbid Solutions by Multivariate Calibration Applied to Tablet Dissolution Testing. Anal. Chem., 60 (1988) 2666-2671.
- Brown, C.W., Lin, J., Interfacing a Fiber-Optic Probe to a Diode Array UV-Visible Spectrometer for Drug Dissolution Tests. Appl. Spectrosc., 47 (1993) 415-618.
- Cho, J.H., Gemperline, P.J., Salt, A., Walker, D.S., UV-Visible Spectral Dissolution Monitoring by in Situ Fiber-Optic Probes. Anal. Chem., 67 (1995) 2858-2863.
- Lu, X., Lozano, R., Shah, P., In-Situ Dissolution Testing Using Different UV Fiber Optic Probes and Instruments. Dissolution Technologies, 10 (2003) Issue 4 6-15.
- Schatz, C., Ulmschneider, M., Altermatt, R., Marrer, S., Reader’s response: Hollow Shaft Sampling with Fiber Optics. Dissolution Technologies, 7 (2000) Issue 2 6-13.
- Schatz, C., Ulmschneider, M., Altermatt, R., Marrer, S., Evaluation of the Rainbow Dynamic Dissolution MonitorTM Semi-automatic Fiber Optic Dissolution Tester. Dissolution Technologies, 8 (2000) Issue 2 6-11.
- Liu, L., Fitzgerald, G., Embry, M., Cantu, R., Pack, B., Technical Evaluation of a Fiber-Optic Probe Dissolution System. Dissolution Technologies, 15 (2008) Issue 1 10-20.
- Inman, G.W., Wethington, E., Baughman, K., Horton, M., System Optimization for In Situ Fiber-Optic Dissolution Testing. Pharm. Tech., Oct (2001) 92-100.
- Wiberg, K.H., Hultin, U.K., Multivariate Chemometric Approach to Fiber-Optic Dissolution Testing. Anal. Chem., 78 (2006) 2076-5085.
- Toher, C.J., Nielsen, P.E., Foreman, A.S., Avdeef, A., In Situ Fiber Optic Dissolution Monitoring of a Vitamin B12 Solid Dosage Formulation. Dissolution Technologies, 10 (2003) Issue 4 20-25.
- Nir, I., Johnson, B.D., Johansson, J., Schatz, C., Application of Fiber-Optic Dissolution Testing for Actual Products. Pharm. Tech., May (2001) 33-40.
- Gray, V.A., Dissolution Testing Using Fiber Optics – A Regulatory Perspective. J. American Pharm. Review, 6 (2003) 26-30.
- Fortunato, D., A Compliance Perspective on Dissolution Method Validation for Immediate-Release Solid Oral Dosage Forms on Automated Instrumentation. Pharm. Tech., Sep 2006.
- Mirza, T., Liu, Q., Vivilecchia, R., Joshi, Y., Comprehensive Validation Scheme for In Situ Fiber Optics Dissolution Method for Pharmaceutical Drug Product Testing. J. Pharm. Sci., 98 (2009) No.3 1086-1094.
- The United States Pharmacopoeia (USP) General Notices. 2011. Testing Practices and Procedures. Section 6.30. USP33 - NF28. Rockville, MD. USA: U.S. Pharmacopeial Convention Inc.
- US FDA Guidance for Industry, Analytical Procedure and Methods Validation, draft guidance (August 2000).
- USP General Chapters on the Dissolution Procedure: Development and Validation <1092>, and Validation of Compendial Procedures <1225>, USP 33 - NF 28. Rockville, MD. USA: U.S. Pharmacopeial Convention Inc.
- Opt-Diss and OD Lite User’s Manual, revision 1.25.
Author Biographies
Linzhe Liu is an analytical scientist with over 13 years of experience working in the pharmaceutical industries. Ms. Liu holds a Senior Scientist position in Global R&D Operations at McNeil Consumer Healthcare, PA and is involved in analytical method development and validation, new technology applications, and technical troubleshooting. After earning a B.Sc. degree in Pharmaceutical Chemistry from Beijing University in Beijing, China, she received her Masters in Pharmaceutical Sciences from the Catholic University of Leuven in Leuven, Belgium. Prior to joining McNeil, she worked in Analytical R&D of Eli Lilly and Company, and the Pharmaceutical Division of Bioanlaytical Systems Inc.

Dr. Tony Osei is an R&D manager at McNeil Consumer Healthcare, Fort Washington PA. He received his B.Sc. in Chemistry from Kwame Nkrumah University of Science & Technology in Ghana and a PhD in Analytical Chemistry from University of Kansas. After a postdoctoral appointment in the Pharmaceutical Chemistry Dept at the same University, he joined Oread Labs in Lawrence, Kansas. For the past 16 years, Tony has been involved in analytical chemistry and formulation research at McNeil Consumer Healthcare.
Dr. Jerry Hsu is a Principal Scientist at McNeil Consumer Healthcare, Fort Washington PA. He received his B.Sc. in Chemistry from National Taiwan University in Taiwan and his PhD in Physical Chemistry from Rutgers University. Prior to joining McNeil, He has held various positions in Analytical Development at Schering-Plough and Research and Development at Wyeth Consumer Healthcare supporting NME development and drug products development.
This article was printed in the March 2011 issue of American Pharmaceutical Review - Volume 14, Issue 2. Copyright rests with the publisher. For more information about American Pharmaceutical Review and to read similar articles, visit www.americanpharmaceuticalreview.com and subscribe for free.