Nuclear Magnetic Resonance (NMR) spectroscopy is a mature and versatile technology with a vast and rich history.1-6 It offers nondestructive quantitative access to structural and dynamic information at the atomic level, and is a common analytical technology encountered in industry.7-15 Quantitative NMR (qNMR),16-18 which is the use of NMR for the identification and quantification of a target compound, is of particular importance within the pharmaceutical industry,19-22 where it is mostly used in support of small molecule applications where tracking impurities and maintaining mass balance plays a central role. With significant advances in modern NMR instrumentation and software, the successful and routine implementation of qNMR in less traditional settings has become more common. One such setting involves applying qNMR to small molecule process impurities (SMPI) during the development and validation of the biopharmaceutical manufacturing process.23 Such analytics are typically performed in complex matrices comprised of protein, excipients, surfactants, buffer components, and salts and have historically resided within the domains of technologies based on mass spectrometry and chromatography. However, the flexibility and speed offered by NMR for the development and execution of such analyses has proven to challenge conventional wisdom with respect to selecting the appropriate analytical strategy for a given task.
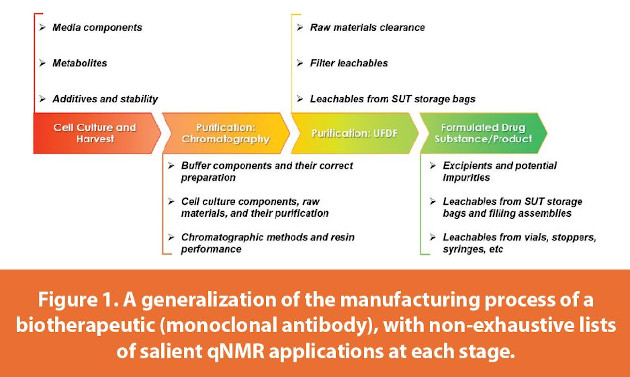
From an analytical standpoint, the manufacturing process of protein-based biotherapeutics may be thought of as consisting of four major stages (Figure 1), each with its own set of unique questions to answer and challenges to overcome. The first is cell culture and harvest, where the concentrations of media components, metabolites, and additives may need to be known during seed train media design or in the analysis of harvested cell culture fluid. Next, there are a series of chromatographic purification steps - which may be customized for a biotherapeutic if needed - with each chromatography pool representing a different analytical matrix of buffer and dilute protein. Here it is often of interest to see how each purification step performs with respect to clearance of certain target compounds, to see if a resin is suitable for reuse, or to assess whether buffers have been prepared improperly. Subsequently, the final chromatography pool is processed via ultrafiltration/diafiltration (UFDF) to form a UFDF pool. This is a highly pure solution consisting of concentrated protein (≤~250 mg/mL) in its diafiltration (DF) buffer, and is a particularly salient place to verify whether process components have been reduced to target levels and whether any unanticipated process impurities/leachables have been introduced (vide infra), particularly in the case of monoclonal antibodies (mAbs). Finally, drug substance (DS) and drug product (DP) involve matrices consisting of concentrated proteins in their respective full formulations. These contain components of the DF buffer along with excipients such as sugars, surfactants, and radical scavengers (i.e. amino acids). Of relevance here are any impurities/leachables introduced from the process of conditioning the UFDF pool, from storage in single-use technology (SUT) items, and/or from vials/stoppers/syringes. Rather than developing individual analytical protocols for measuring individual compounds in each matrix (as is common practice), the testing may be streamlined into a generic agglomeration of qNMR applications, treating many analytical scenarios on near-equal footing in terms of resources and workflow needed to execute a given study.
Hydrogen is ubiquitously found in virtually all organic compounds. Its natural isotopic abundance is > 99.9% in the form of protium, which is also conveniently NMR-active and is usually referred to simply as a proton with symbol 1H. Since the majority of organic molecules have at least a single non-labile proton, 1H-NMR thus serves the role as a generic detector of organic matter due to its ability to function as a universal proton detector. This is in contrast to other analytical detection schemes which may be based on a molecule’s ionization efficiency, separability, or chromophoric sensitivity – all of which may differ from one organic analyte to another.
All magnetically distinct sets of protons give rise to NMR signals which take the form of various peak patterns, dispersed across a spectrum (Figure 2). A peak’s location corresponds to that nucleus’ magnetic response to controlled perturbation with radiofrequency (RF) pulses against a static background magnetic field provided by a superconducting NMR magnet. This response is directly related to the exact chemical environment for a given proton within the context of the structure of the overall molecule. Moreover, the integrated area of each NMR signal is stoichiometrically proportional to the number of equivalent nuclei in the entire sample that contribute to that particular signal. This is the fundamental principle that renders NMR quantitative. Two additional unique advantages are as follows. First, the quantitative nature of NMR signals is not influenced by the identity of the compound from which they originate (i.e. “a mole of protons is a mole of protons”a); thus, there are no differential response factors that may confound analysis. Second, a given compound may result in an NMR spectrum comprised of multiple sets of peaks, any of which may be deemed as a suitable quantitative probe for a given analysis and as dictated by its circumstances. Concomitantly, most qNMR work can be reduced to simple variations of spiking studies where an analytical standard is added into an appropriate matrix to determine the identity of all resolvable signals for a given target compound within that matrix. This is particularly convenient because any clear signal from a target analyte may be used as a quantitative probe, even if all other signals from that analyte are overlapped/obscured by other larger signals.

Modern qNMR operations concerned with trace process impurities should be performed on high-field instrumentation (≥ 400 MHz) equipped with cryogenically-cooled probes on spectrometers with stable hardware with high dynamic range capability. The homogeneity of the static magnetic field prior to each spectral acquisition is crucial, as well. This not only maintains high resolution and sensitivity, but also enhances the ability to adequately suppress solvent signal (i.e. water). This is crucial as the effective magnitude of the water signal is multiple orders of magnitude larger than any signal from the next most concentrated component in any solution. If not adequately suppressed, the entire spectrum may be dominated by this single signal, interfering with further analysis.
One of the hallmark challenges of analyzing SMPI in bioprocess samples is the presence of protein, oftentimes in high concentration. While traditional methods to remove protein – such as centrifugal filtration and precipitation with organic solvent – may be used to overcome this challenge, these all amount to additional sample manipulation and represent additional potential sources of analytical error. This challenge may readily and elegantly be overcome with NMR by employing CPMG trains24-26 during experimental execution. Such RF pulse sequence elements serve to filter out signals based on differential molecular weights of all solution components, as shown in Figure 3. Actual NMR signal acquisition occurs only after virtually all of the signals from high molecular weight species (i.e ~145 kDa mAbs) have decayed below detection. When coupled with robust water suppression, the resulting spectra appear as high-quality small molecule spectra that are amenable to quantitative analysis with minimal-to-no interference from protein signal. It is prudent to use direct analytical standards spiked directly into an external sample of an appropriate analytical matrix. Relative to the traditional method of using indirect internal standards, there is (1) a significant reduction in the total acquisition time per spectrumb, and (2) maintenance of a so-called “apples-to-apples” approach for quantitatively comparing any analyte across multiple samples for a given analytical matrix.
With the analytical artillery established above, many problems with small molecule process impurities that have traditionally been perceived as challenging and/or laborious become rendered routine. This includes but is not limited to raw material purity analysis and clearance during the purification process, the performance of chromatographic resins and column configurations, and the analysis of the introduction and/or removal of leachables at various stages of the manufacturing process. Such methods may find use both in R&D as well as during formal process validation. Facilities equipped for qNMR applications can readily achieve quantification limits as low as 0.5 μg/mL in approximately 15 minutes of scan time per spectrum in favorable cases, with lower limits attainable with longer scan times.
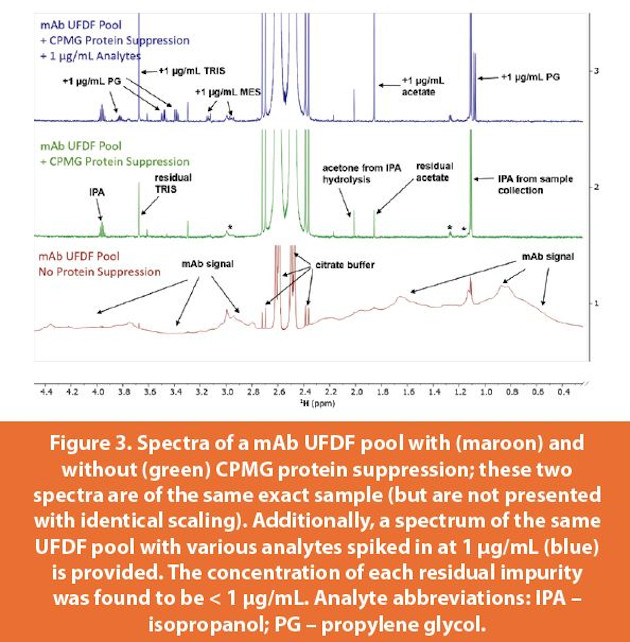
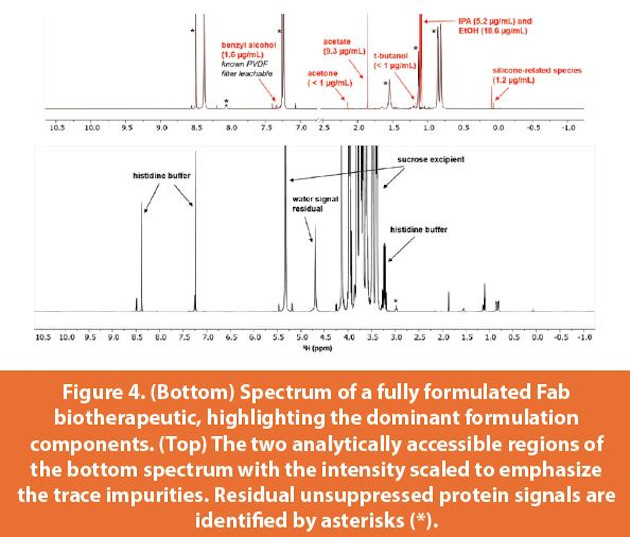
The UFDF stage is a remarkably convenient point in the manufacturing process to conduct impurities testing by NMR. The non-protein components in this matrix are the buffering agents, typically no more than two. After proper suppression of the water and protein signals, spectra are produced which are not overcrowded with signals, maximizing the likelihood of successfully detecting and quantifying any potential impurities without interference from other components. This is in contrast to trace impurities testing by NMR performed in formulated solutions such as DS and DP, where spectral crowding from high concentration excipient signals renders certain spectral regions analytically inaccessible. Even so, testing in DS/DP for downstream impurities is indispensable, though challenging. Figures 3 and 4 show the detection, identification, and quantification of multiple process impurities detected in both a mAb UFDF pool and within a fully formulated Fab during process development. In the latter, the sugar signals dominate an important region of the spectrum, rendering that region inaccessible without invoking emerging qNMR approaches such as CRAFT.27-28 Still, successful partial screening for impurities in formulated matrices is possible with NMR, as seen in Figure 4.
There are other advantages to performing impurities testing at the highly pure UFDF stage. Any signals detected in the NMR spectrum that do not correspond to either buffer or residual unsuppressed protein signal must be impurities, without the need to resort to comparison with a representative control sample which may not be readily available. However, if the upstream contributing source of a particular set of impurities is to be identified (i.e. viral filters), then a control sample representing the same exact analytical matrix prior to exposure through the relevant process step is required. Additionally, the absence of the signals of any upstream raw material analytes in the UFDF pool implies that they were adequately cleared throughout the purification process. Indeed, it is currently common practice in the industry to test for upstream impurities directly in DS via other analytical methods. However, developing and optimizing individual methods using such technologies to ensure the clearance of every concerning upstream analyte in each product’s formulated matrix is at best an unreasonably demanding task to achieve in practice. By conducting such testing in the UFDF pool by NMR, the overall workflow is streamlined and there is less downstream demand for resources since the space of upstream analytical targets that need to be tested downstream in the more complex formulated DS matrix is significantly minimized.
Subscribe to our e-Newsletters
Stay up to date with the latest news, articles, and events. Plus, get special offers
from American Pharmaceutical Review – all delivered right to your inbox! Sign up now!
An active area of concern with particularly stringent challenges and demands across many industries involves the investigation and characterization of extractables and leachables (E&L).22,29-32 Any material that comes into contact with a biotherapeutic during manufacturing (tubing, filters, vials/stoppers/syringes, etc.) may be a potential source of leachables. Of recent and immediate concern are the ever more popular SUT items, which are routinely replacing their stainless-steel counterparts due to high cleaning costs and other resource-conserving incentives. Some examples of how SUT items are utilized in the manufacturing process include storage bags for transferring in-process samples between sites and for bulk stability studies, and multistage filling assemblies used during the production of DP. Typically, leachable species are expected to be ones that are also observed in extractions performed under various exaggerated conditions (acidic, basic, and organic) to represent real-world worst-case scenarios. This expectation is not necessarily satisfied in practice as extractables summary reports provided by vendors are often not fully representative of what is seen during actual testing and do not always match the results obtained from in-house extraction efforts. Ensuring that total leachable levels are low and that the totality of detectable but unidentified leachable species is at an absolute minimum is of utmost priority with respect to product quality and patient safety. While such analytical investigations are commonly performed with GC-MS and LC-MS, NMR allows for a holistic and sensitive assessment of leachables without the need for target-specific optimization, thus presenting a convenient and agile analytical path for an extensive evaluation of process impurities.
When an appropriate pre-process control sample is present, detection of trace leachables added by a process are readily detected by the presence of any new signals in the 1H-NMR spectra of the samples being tested relative to the control sample spectrum. If such a control sample is not readily available, the analytical matrix prepared separately without the protein may usually act as a suitable alternative. While the identities of some detected leachables may be known a priori or identified by spiking appropriately selected analytes, it is very difficult to assign the exact chemical identities to all detected signals attributed to leachables. In such circumstances, semi-quantitative protocols involving appropriate surrogate standards and based on toxicologically worst-case assumptions may be considered.26 Although such approaches tend to overestimate the actual total concentration of unidentified leachables by design, they enable the use of NMR as an effective leachables screening tool in conjunction with an appropriate analytical surrogate standard. Any measured totalities exceeding an established clearance threshold indicate a need for further characterization of the findings and a potential investigation to remedy the process. While NMR can, in principle, provide the identities of all detected species through the use of more sophisticated multidimensional spectroscopic methods for structure elucidation,33 this is often not achievable in practice in such circumstances since (1) the target analytes are present in trace quantities, and (2) not all signals from a target analyte may be resolvable from other signals present in a spectrum. This underscores the importance of combining NMR data with orthogonal methods, where an accurate or even tentative identification of leachable species is more readily achieved. Given that no single analytical technology and its methods are optimal for every leachables investigation, the most complete leachables profile for a given process may be attained by combining NMR data with GC-MS, and LC-MS, thus covering a significantly more comprehensive sampling of the analytical space of non-volatile, semi-volatile, and volatile impurities.
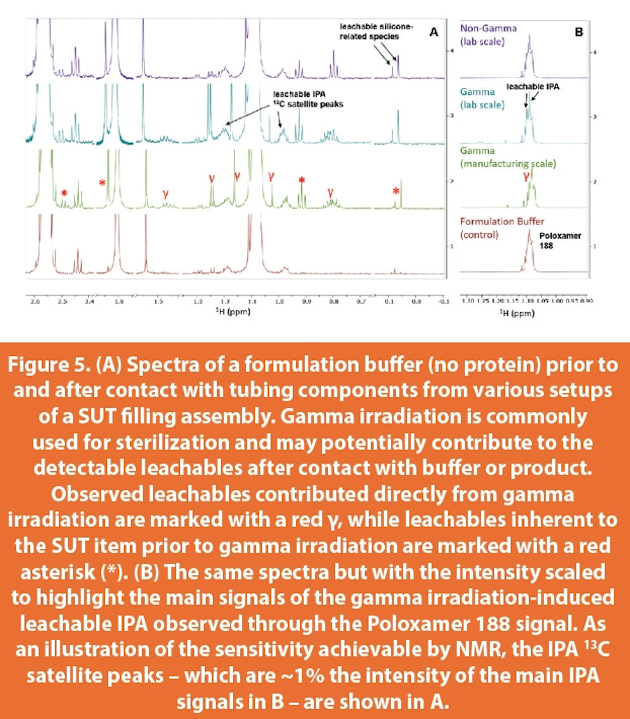
Figure 5 depicts spectra of the diluent (formulation buffer) of an antibody therapeutic before and after contact with a SUT in the form of a gamma irradiated filling assembly (GIFA). The diluent was passed through such assemblies both at the lab (milliliter) and manufacturing (liter) scales, and the resulting spectra are compared with those of the diluent passed through non-gamma irradiated assemblies (nGIFA). Although some leachables are introduced from the latter, significantly more leachables species were observed to be introduced from the former, which were semi-quantitated to be above an acceptable threshold. Simple visual inspection of the spectra confirms the same leachables species from the GIFA are introduced into the diluent regardless of the scale of the operation. Moreover, these leachables were observed to persist at unacceptable levels even after extensive flushing with diluent at the manufacturing scale. This is in contrast to the lower levels of leachables introduced by the nGIFA, which may be shown to clear below acceptable thresholds after an additional round of diluent is passed through. The general use of NMR to quickly screen and evaluate these samples has facilitated the ability to make scientifically-sound business decisions to ensure product quality and patient safety.
Within the scope of this publication, we have demonstrated the power and versatility of qNMR in the assessment of SMPI in the development of manufacturing processes of biotherapeutics. The examples provided are by no means exhaustive and the methodology can be tailored and applied to many perceived analytical challenges encountered in bioprocessing. We have found this to be the most efficient and robust approach to accomplish these goals time and time again.
aKnowledge of structural information is needed to make an accurate species-to-species peak area comparison.
bUsing direct external standards circumvents the usual need to wait ~5×T1 when using 90° pulses, thus reducing experimental acquisition times as compared with methods that rely on using indirect internal standards.
Acknowledgments
The authors would like to thank Shelley Elvington for critical reading of the manuscript and feedback. The authors would also like to acknowledge Noah Wake for helping collect some of the NMR spectra presented here, as well as Malinda Cheung, Jessica Yang, and Jeremey Yokogawa for their contributions to the investigation of the gammairradiated single use technology.
References
- Rabi, I. I.; Zacharias, J. R.; Millman, S.; Kusch, P., A New Method of Measuring Nuclear Magnetic Moment. Phys Rev 1938, 53 (4), 318-318.
- Bloch, F.; Hansen, W. W.; Packard, M., Nuclear Induction. Phys Rev 1946, 69 (3-4), 127-127.
- Purcell, E. M.; Torrey, H. C.; Pound, R. V., Resonance Absorption by Nuclear Magnetic Moments in a Solid. Phys Rev 1946, 69 (1-2), 37-38.
- Hahn, E. L., Spin Echoes. Phys Rev 1950, 80 (4), 580-594.
- Ernst, R. R.; Anderson, W. A., Application of Fourier Transform Spectroscopy to Magnetic Resonance. Review of Scientific Instruments 1966, 37 (1), 93-102.
- Ramsey, N. F., Early History of Magnetic Resonance. Physics in Perspective 1999, 1 (2), 123-135.
- Kao, Y. H.; Bender, J.; Hagewiesche, A.; Wong, P.; Huang, Y. F.; Vanderlaan, M., Characterization of filter extractables by proton NMR spectroscopy: Studies on intact filters with process buffers. Pda J Pharm Sci Tech 2001, 55 (5), 268-277.
- Lin, M.; Shapiro, M. J.; Wareing, J. R., Diffusion-Edited NMR−Affinity NMR for Direct Observation of Molecular Interactions. Journal of the American Chemical Society 1997, 119 (22), 5249-5250.
- Vogt, F. G., Evolution of solid-state NMR in pharmaceutical analysis. Future Medicinal Chemistry 2010, 2 (6), 915-921.
- Edwards, J. C., A Review of Applications of NMR Spectroscopy in the Petroleum Industry. Nadkarni, R., Ed. ASTM International: West Conshohocken, PA, 2011; pp 423-472.
- Taraban, M. B.; Truong, H. C.; Feng, Y.; Jouravleva, E. V.; Anisimov, M. A.; Yu, Y. B., Water Proton NMR for In Situ Detection of Insulin Aggregates. J Pharm Sci-Us 2015, 104 (12), 4132-4141.
- Yu, Y. B.; Taraban, M. B.; Wang, W.; Briggs, K. T., Improving Biopharmaceutical Safety through Verification-Based Quality Control. Trends Biotechnol 2017, 35 (12), 1140-1155.
- Taraban, M. B.; Briggs, K. T.; Merkel, P.; Yu, Y. B., Flow Water Proton NMR: In-Line Process Analytical Technology for Continuous Biomanufacturing. Anal Chem 2019, 91 (21), 13538-13546.
- Coupland, J., Determination of Solid Fat Content by Nuclear Magnetic Resonance. Current Protocols in Food Analytical Chemistry 2001, 00 (1), D3.1.1-D3.1.8.
- Schumacher, S.; Rothenhäusler, B.; Willmann, A.; Thun, J.; Moog, R.; Kuentz, M., Time domain NMR as a new process monitoring method for characterization of pharmaceutical hydrates. J Pharmaceut Biomed 2017, 137.
- Bharti, S. K.; Roy, R., Quantitative 1H NMR spectroscopy. TrAC Trends in Analytical Chemistry 2012, 35, 5-26.
- Simmler, C.; Napolitano, J. G.; McAlpine, J. B.; Chen, S.-N.; Pauli, G. F., Universal quantitative NMR analysis of complex natural samples. Current Opinion in Biotechnology 2014, 25, 51-59.
- Malz, F.; Jancke, H., Validation of quantitative NMR. J Pharmaceut Biomed 2005, 38 (5), 813-823.
- Holzgrabe, U.; Deubner, R.; Schollmayer, C.; Waibel, B., Quantitative NMR spectroscopy—Applications in drug analysis. J Pharmaceut Biomed 2005, 38 (5), 806-812.
- Diehl, B.; Malz, F.; Holzgrabe, U., Quantitative NMR spectroscopy in the quality evaluation of active pharmaceutical ingredients and excipients. Spectroscopy Europe 2007, 19, 15-19.
- Holzgrabe, U., Quantitative NMR spectroscopy in pharmaceutical applications. Prog Nucl Magn Reson Spectrosc 2010, 57 (2), 229-40.
- Magarian, N.; Lee, K.; Nagpal, K.; Skidmore, K.; Mahajan, E., Clearance of extractables and leachables from single-use technologies via ultrafiltration/diafiltration operations. Biotechnology progress 2016, 32.
- Shukla, A. A.; Hubbard, B.; Tressel, T.; Guhan, S.; Low, D., Downstream processing of monoclonal antibodies—Application of platform approaches. Journal of Chromatography B 2007, 848 (1), 28-39.
- Carr, H. Y.; Purcell, E. M., Effects of Diffusion on Free Precession in Nuclear Magnetic Resonance Experiments. Phys Rev 1954, 94 (3), 630-638.
- Meiboom, S.; Gill, D., Modified Spin-Echo Method for Measuring Nuclear Relaxation Times. The Review of Scientific Instruments 1958, 29 (8), 688-691.
- Skidmore, K.; Hewitt, D.; Kao, Y. H., Quantitation and characterization of process impurities and extractables in protein-containing solutions using proton NMR as a general tool. Biotechnol Prog 2012, 28 (6), 1526-33.
- Krishnamurthy, K., CRAFT (complete reduction to amplitude frequency table)--robust and time-efficient Bayesian approach for quantitative mixture analysis by NMR. Magn Reson Chem 2013, 51 (12), 821-9.
- Scott, A. B.; Tim, A. S.; David, J. R.; Krish, K., Quantitative NMR Analysis of Complex Mixtures Using CRAFT (Complete Reduction to Amplitude Frequency Table) Method. Current Metabolomics 2015, 3 (1), 21-31.
- Wakankar, A. A.; Wang, Y. J.; Canova‐Davis, E.; Ma, S.; Schmalzing, D.; Grieco, J.; Milby, T.; Reynolds, T.; Mazzarella, K.; Hoff, E.; Gomez, S.; Martin‐Moe, S., On Developing a Process for Conducting Extractable–Leachable Assessment of Components Used for Storage of Biopharmaceuticals. J Pharm Sci-Us 2010, 99 (5), 2209-2218.
- Huang, M.; Horwitz, T. S.; Zweiben, C.; Singh, S. K., Impact of extractables/leachables from filters on stability of protein formulations. J Pharm Sci-Us 2011, 100 (11), 4617-4630.
- Ding, W., Risk-Based Scientific Approach for Determination of Extractables/Leachables from Biomanufacturing of Antibody–Drug Conjugates (ADCs). In Antibody-Drug Conjugates, Ducry, L., Ed. Humana Press: Totowa, NJ, 2013; pp 303-311.
- Jahn, M., Leachables and Extractables: From Regulatory Expectations to Laboratory Assessment. In Challenges in Protein Product Development, Warne, N. W.; Mahler, H.-C., Eds. Springer International Publishing: Cham, 2018; pp 337-351.
- Morris, G. A., Modern Nmr Techniques for Structure Elucidation. Magnetic Resonance in Chemistry 1986, 24 (5), 371-403.
Author Biographies
Gennady Khirich is a Scientist working in the small molecule process impurities group within Analytical Operations at Genentech, where he has been doing NMR since 2016. He specializes in rapid development and execution of qNMR techniques in complex matrices both for R&D and process validation purposes. Currently, he has been exploring the use of 2D NMR methods at natural 13C abundance along with various chemometric techniques for detection of changes in higher order structure in antibody therapeutics, as well as to establish analytical similarity for comparability studies. Prior to joining Genentech, he has completed a B.S. in physics at the City College of New York, followed by completion of his Ph.D. in biophysical chemistry at Yale University, with an emphasis on using NMR relaxation methods to study functional conformational dynamics in enzymes.
Ken Skidmore is a Senior Scientist in the Analytical Operations department at Genentech. Initially hired as an NMR spectroscopist with a focus on qNMR, he now leads a group responsible for assessing impurities during biologics drug development. His group uses a variety of techniques (NMR, GC-MS, LC-MS, ICP-MS) to investigate extractables, leachables, clearance of process components, raw material composition, and stock solution stability. In addition, he helps author leachables documentation for BLA filings and manages outsourced work with contract laboratories.