Steven J. Lynn, MS - Executive Vice President - Pharmaceuticals, Regulatory Compliance Associates Inc.
Introduction
The intent of this article is to stimulate more conversation and catalyze more improvement across our industry relating to the repeat problems we have seen for literally decades.
During research for the article the author discovered the top 10 FDA Form 483 observations have mostly remained unchanged over the last 23 years. However, they likely have been the same going back further in time, but FDA 483 trend presentations could only be found going back to 2000.
The main questions to consider when reading this article are:
- Why are the top 10 FDA Form 483 issues mostly the same the past twenty-three years? What is/are the cause(s)?
- How can we, as an industry (regulators and regulated), solve these systemic repeat observations?
Methods
The data and thoughts detailed in this article were derived from the following four areas:
1. Data utilized and presented during the Parenteral Drug Association’s 2022 Annual meeting. The data was obtained from RCA’s partner, Redica Systems, and was mined for the top 483 observations between 2018 to 2021.
- Information was compiled by utilizing Redica’s Annual Trend Report with the following search criteria: Year range = 2018 to 2022 + Human Drugs/GMP + Form 483 + All Firms Globally
2. Research, data compilation and analysis on 483 trend presentations given by the FDA going back to 2000.
- Information was compiled based on internet searches for prior FDA presentations on FDA Form 483 observational trends (aka Top 10 observations within the specific year).
3. A highly informal, anonymous survey of 30 industry professionals. The individuals selected were known to the author and had to fit the following criteria:
- They were ex-FDA employees who worked in the pharmaceutical CGMP program within the Center for Drug Evaluation and Research (CDER) and/or the Office of Regulatory Affairs (ORA - FDA’s inspectorate). They had to have worked for more than two pharmaceutical companies (after FDA) and have over 20 years of professional experience, OR
- They are current industry quality and/or operational professionals who have worked for more than two pharmaceutical companies and have over 20 years of professional experience.
4. The author’s tacit knowledge gained from working as an executive at the FDA and an executive at both generic and brand pharmaceutical firms, as well as a consultant to dozens of firms.
Discussion
What and Why
Please do not get caught up in the numbers. They are important, but the important take away from this article is our collective industry continues to be cited by the FDA for the same observations year over year. The same 10 observations pop up again and again going back to at least 1999, over 23 years. In those 23 years we’ve seen a rapid increase in knowledge; better equipment; systems; processes; therapies; and technologies to name a few. It’s definitely been a volatile, uncertain, complex and ambiguous (VUCA) world we’ve been living in and will continue to be. With all the rapid advancements in processes, products and services how are we still seeing the same CGMP observations in our facilities year over year? What can we do as an industry to change these repeat observations?
Background
FDA’s 2006 Guidance for Industry, Quality Systems Approach to Pharmaceutical CGMP Regulations" details a six-system inspection model. The six systems (1. The Quality System; 2. Production System; 3. Packaging and Labeling System; 4. Laboratory Controls System; 5. Facilities and Equipment System; and 6. Materials System) are all interconnected. In fact, FDA states in the guidance: “the quality system provides the foundation for the manufacturing systems that are linked and function within it. The quality system model described in this guidance does not consider the fi ve manufacturing systems as discrete entities, but instead integrates them into appropriate sections of the model.” The data presented below will be divided into the six systems for ease of presentation.
Data Analysis
During the 2022 PDA Annual Meeting the author gave a presentation entitled “Analyzing Global FDA 483 Observational Trends 2018-2021. In the presentation top observations within each of the six systems were detailed. Table 1 below details the total 483 observations by category/system from 2018-2021. The data was derived from a search of Redica Systems data.
The data shows the Production System accounting for the largest percentage of total observations (27.4%) during the reporting period. However, the Quality System and Laboratory System are close runners up at 26.2% and 19.4%, respectively.
Table 2 depicts the top observational issues (i.e., what were the top observations within the diff erent systems) across all systems for the same time period.
The table lists the System (i.e., one of the six systems) then the secondary category of each observation and then the tertiary category (if available). For example, the top issue lies in the quality system, with the secondary category of in adequate deviations and tertiary breakdown to inadequate investigations.
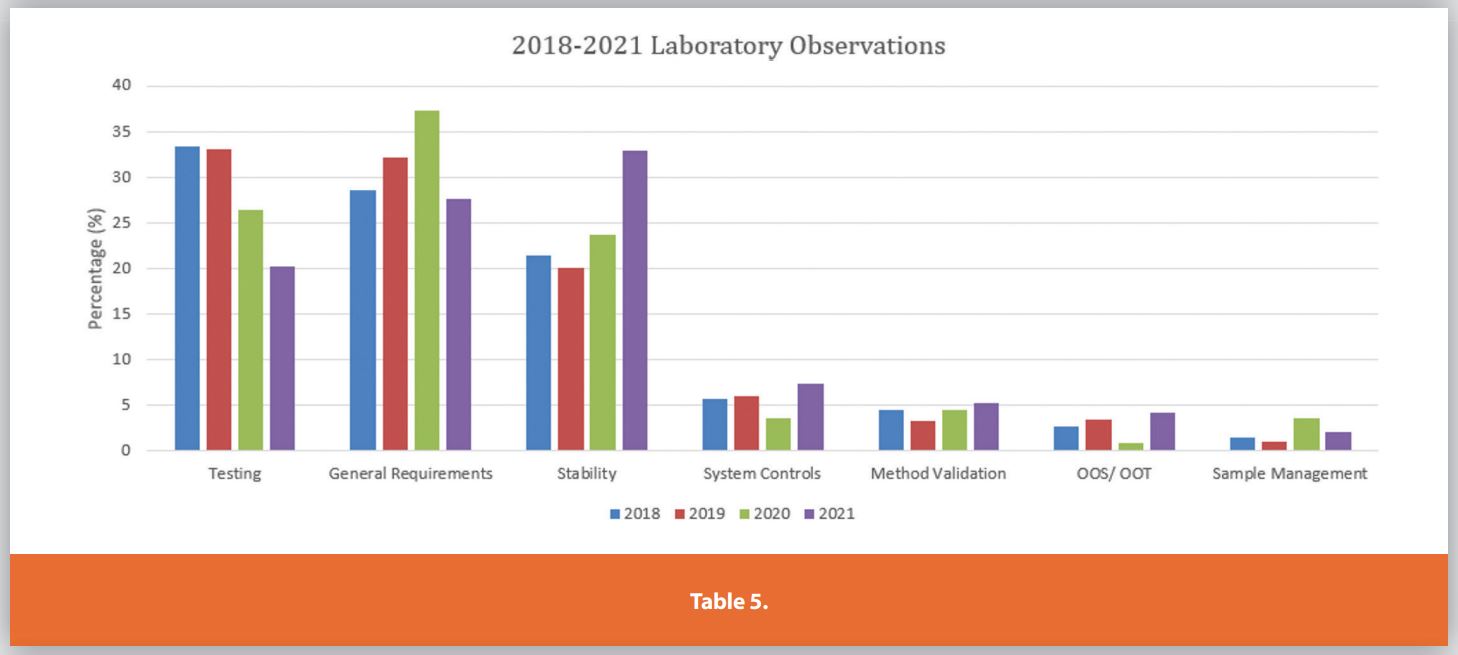
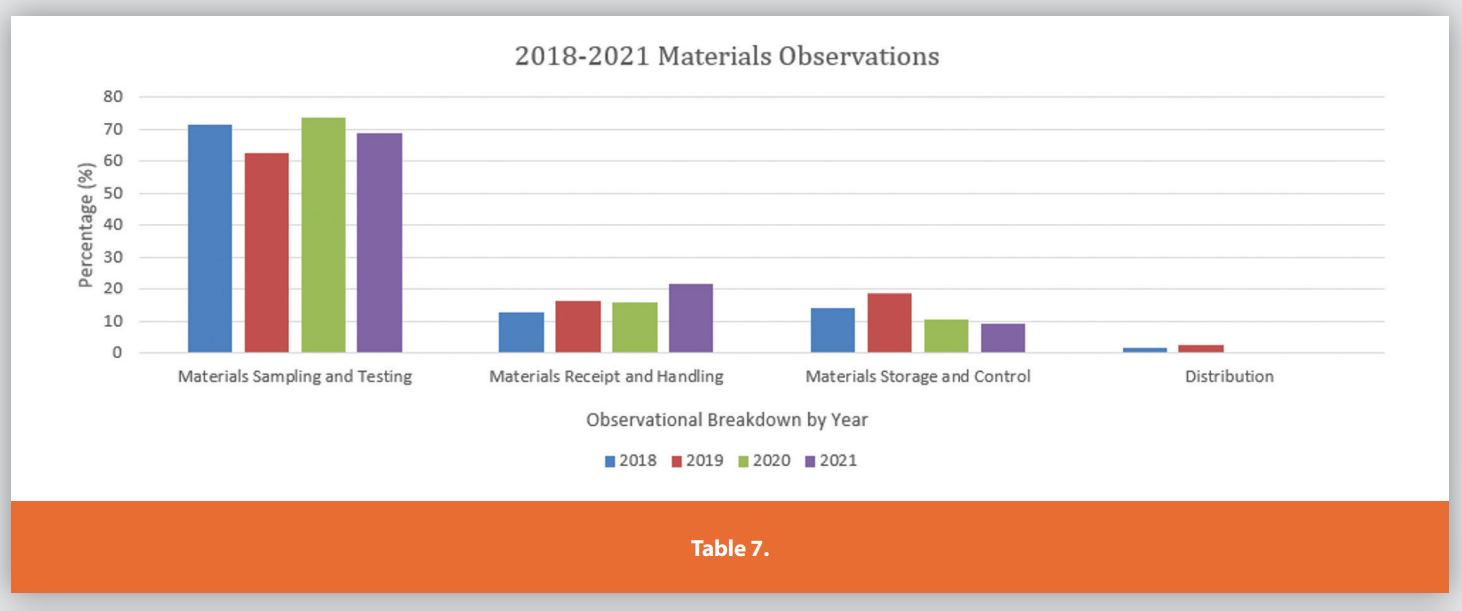
Each of the Six Systems are further detailed in Tables 3-9.
These graphs only depict the past four years. During the research for the article internet searches for FDA presentations on the Top 10 483’s per annum were compiled and analyzed. The data showed the same top 483 observations remain mostly unchanged over the past 23 years.
For example, in 1999 an FDA official from the San Juan District Office gave a presentation entitled “Current 483 Issues”.3 Within the presentation the official noted the top 483 observations were laboratory controls, investigations, stability issues, calibration issues, environmental controls, records, procedural deficiencies, equipment and NDA Field Alert Reporting. Fast forward close to 23 years later and the observations have largely remained the same, as depicted in the PDA presentation.
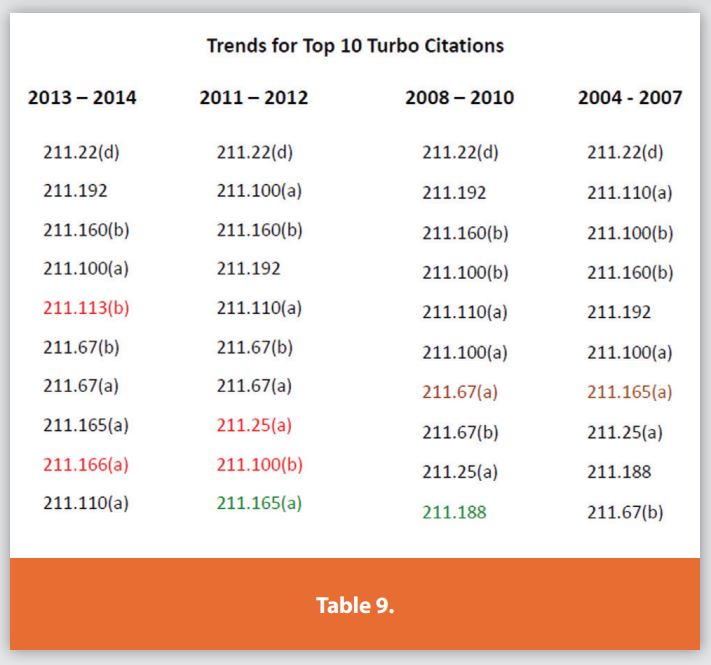
Another FDA officer gave a presentation in 2015 detailing, among other things, the top observations from 2004 to 2014 (Table 9) mostly remain the same.
Table 10 below displays the top common observations over the past 23 years. The rankings (i.e., 1 to 10) are not important year over year because, while the top 10 observations may change from one ranking to another, these common observations routinely remain in the top 10.
Potential Causes and Call to Action
In April 2014 Harvard Business Review (HBR) published an article entitled Creating a Culture of Quality. In the article the authors detailed the results of their study which included 60 multinational corporations, an extensive review of research and a survey of more than 850 employees. The study garnered a great deal of attention in our industry upon publishing. Subject matter experts prominently displayed some of the key study quotes such as “A company with a highly developed culture of quality spends, on average, $350 million less annually fixing mistakes than a company with a poorly developed one.”


In addition to this captivating statistic the HBR authors outlined four (4) essentials that drive quality in organizations: 1. Leadership Emphasis – Managers are told that quality is a leadership priority and walk the talk.; 2. Message Credibility – Messaging is delivered by respected sources, are appealing to associates and easy to understand. 3. Peer Involvement – peers routinely raise quality as a team topic of discussion and hold each other accountable (i.e., a speak up and accountable culture); and 4. Employee Ownership – Associates understand how quality fi ts with the job and are empowered to make quality decisions (ex: anybody can raise a deviation) and are comfortable (non-punitive) raising issues. Do you think you are following these at your organization? What about the industry as a whole?
Informal Survey
To try and make sense of this problem, a very informal and anonymous survey was sent to thirty different colleagues. The colleagues were known to the author and were a mix of ex-FDA’ers and industry. They also had to have worked at no less than two different pharmaceutical/ biotech companies (not including FDA) and have no less than 20 years of experience in quality, compliance and/or inspections or audits,
The survey posed the same two questions noted at the beginning of this article, specifically:
- Why are the top 10 FDA Form 483 issues mostly the same for the past twenty-three years? What is/are the cause(s)?
- How can we, as an industry (regulators and regulated), solve these systemic repeat observations?
The results were telling and seem to point to a deeper systemic issue, both at the line level of the fi rm, within the quality units, laboratories, operations and most importantly in the C-Suite. A sampling of the results are listed in the table below. You be the judge.
Conclusion
I do not profess to have the answer(s) to this problem. During my 25+ year career I’ve seen a lot of very good CGMPs and a lot of not-so-good CGMPs. To be honest, I do not think one person, one fi rm, one trade organization, or one consultancy has the solution. It could be argued that the solution lies in our collective knowledge and experience.
I’ll leave you with one additional parting thought: In May 2007, FDA/ CDER Center Director, at the time, Dr. Janet Woodcock posted an update and message on the Agency’s Pharmaceutical Quality for the 21st Century,6 which kicked off in 2002. In Dr. Woodcock’s opening message, she astutely pointed out “As you know, FDA cannot meet the goals of the Initiative alone. The success of the Initiative has been predicated on active participation and input from experts in industry, academia, government, and consumer groups…. The journey has just begun. There is still much to learn and innovations to incorporate into all our processes. We, in the agency, will continue to emphasize the importance of the Initiative and look forward to many more improvements in our regulatory processes for ensuring product quality.” This initiative started 20 years ago. The Top 10 483 observations have not changed in this same timeframe. Have we stagnated, improved or fell behind? This is something for the regulator and regulated to ponder and address – together.
References
- Guidance for Industry (fda.gov) QS Guidance
- FDA QS Guidance, pg. 7
- Current 483 Issues Diana Amador, Director, Science Branch San Juan District Offi ce 1999
- Microbiological Inspections, Regulatory Investigator Update, Sharon Thoma, ORA National Expert Pharmaceutical Inspections, 2014 9th Annual Global Conference on Pharmaceutical Microbiology
- Srinivasan, Ashwin and Kurey, Bryan, Creating a Culture of Quality, Harvard Business Review, April 2014
- Pharmaceutical Quality for the 21st Century A Risk-Based Approach Progress Report | FDA
Subscribe to our e-Newsletters
Stay up to date with the latest news, articles, and events. Plus, get special
offers from American Pharmaceutical Review – all delivered right to your inbox!
Sign up now!