Abstract
Co-crystallization is commonly applied in the formulation of pharmaceutical products. Coformer screening, process monitoring, and product analysis before, during, and after the production of cocrystals however is not straightforward. This article aims at shedding light at the analytical capabilities offered by optical spectroscopic techniques with a focus on absorption and scattering methods across a wide spectral range.
Background
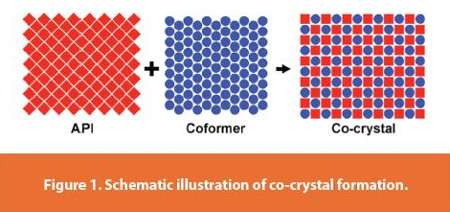
Co-crystals are crystalline solids composed of two or more different compounds. If at least one of the constituents is an active pharmaceutical ingredient (API) and the others (often referred to as coformers) are nontoxic, the material can be considered as a pharmaceutical co-crystal. Co-crystals are interesting as they exhibit a different structure to the starting materials, as indicated in Figure 1. As a consequence, the material properties are different as well. For instance, incorporating a hardly water-soluble API in a suitable co-crystal may result in a pharmaceutical product with a high water-solubility and bioavailability. An overview of the production of pharmaceutical co-crystals, can be found in reference one for instance.
Developing and producing co-crystalline pharmaceuticals poses a number of challenges in terms of analytics at different stages. During the development, suitable coformers need to be identified in order to provide the desired properties when combined with the API in a co-crystal. For this purpose, rapid screening of potential starting and product materials is an important task. Ideally, the analytical method should not only be able to provide qualitative and quantitative information about the individual materials, but also be capable of distinguishing between different crystal configurations. At the production stage, a method is required to monitor the processes. It should allow the in situ application and offer real-time measurement capability. In other words, data needs to be acquired and evaluated within a short period of time, so that the production process can be monitored and controlled if necessary. Eventually, analyzing the final product is of paramount importance in order to ensure a high quality when brought to the market. Regarding the analysis of products, e.g. tablets, the analytical method needs to be able to identify the presence of contaminants and quantify the amount of API.
Methods
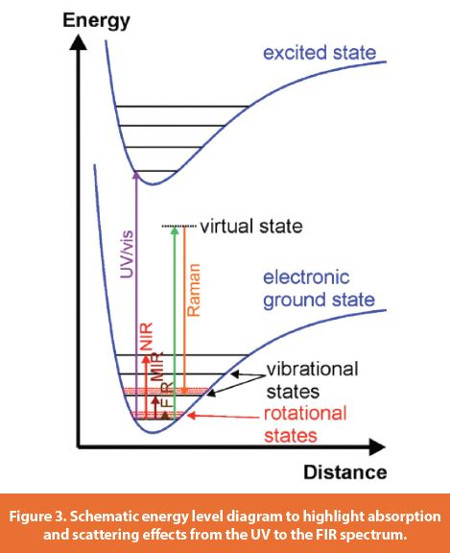
Optical spectroscopy utilizing absorption and/or scattering effects provides a highly useful toolbox for analyzing pharmaceutical cocrystals. In the following, we consider the optical spectrum to range from about 200 nm to 1 mm as indicated in Figure 2. This means we cover the range from the ultraviolet through the visible to the near, mid-, and far-infrared spectrum. Concerning absorption, the UV and visible part of the spectrum is characteristic of the electronic transitions, while the vibrational and rotations signatures and their overtone and combinations bands can be found from the near to the far infrared. Raman scattering is also approaching the vibrational and rotational modes. The differences between absorption and Raman scattering are illustrated schematically in the simplistic energy level diagram displayed in Figure 3 and a detailed account can be found in the common textbooks, for example in reference two.
The spectra to be obtained from complicated pharmaceutical systems can be rather complex containing a multitude of partly overlapping peaks. Therefore, the data evaluation can be difficult. In such a situation, the use of chemometric methods is most promising.3 The list of chemometric tools includes principal component analysis (PCA), which is well established to classify samples, and for a quantitative analysis partial least-squares regression (PLSR) techniques, support vector machines (SVM), and artificial neural networks (ANN). Usually, these statistics-based methods require significant amounts of data to develop, train, and calibrate suitable models. On the other hand, they are robust and provide reliable results from the correlations they identify.
Applications to Co-Crystals
There are a number of studies reporting applications of optical spectroscopy to pharmaceutical co-crystals. Most of them are concerned with Raman and absorption spectroscopy in the near-to-far infrared, whereas UV/vis spectroscopy was rarely used. Therefore, the following overview will focus on Raman, NIR, MIR, and FIR spectroscopy.
Subscribe to our e-Newsletters
Stay up to date with the latest news, articles, and events. Plus, get special offers
from American Pharmaceutical Review – all delivered right to your inbox! Sign up now!
As laid out above, initial screening, process monitoring, and product analysis are the main tasks. For the screening step, several comparative studies were performed. Alleso et al.4 compared NIR and Raman spectroscopy utilizing indomethacin as a model API and saccharin (SAC) and L-aspartic acid (AAC) as coformer candidates. The data were evaluated by PCA in both cases. From their results they concluded that the low selectivity of NIR compromised the screening efficiency whenever polymorphic APIs were considered. Extended training data sets with reference samples may help to minimize the risk of false positives here. On the other hand, Raman spectroscopy was found to have a better selectivity and good interpretational abilities and therefore allowed a more direct assessment of co-crystal formation during the test experiments.4 Another comparative screening study was reported by Rodrigues et al.5 looking at MIR, NIR, and Raman spectroscopy. They found that all three techniques are capable of detecting co-crystal formation when PCA is used to evaluate the data.
The MIR method delivered the most information, but it must be noted that the spectral range in the Raman measurements was rather limited. Raman and MIR are usually similar in performance as they both probe the spectral range of normal vibrational modes and therefore provide complimentary information due to the different selection rules for absorption and scattering processes.6 The NIR performance was again limited due to the reduced selectivity and specificity.
Inline process monitoring of co-crystallization processes was performed using Raman spectroscopy. Soares and Carneiro7 demonstrated this using the synthesis of carbamazepine-nicotinamide co-crystals in an aqueous medium. In addition, they used the Raman approach to analyze their final product. Interestingly, in both applications, i.e. process monitoring and product analysis, different data evaluation tools were employed. In the former, multivariate curve resolution – alternating least squares (MCR-ALS) was used, while in the latter a PLSR method was chosen. Lee et al.8 combined NIR and Raman spectroscopy for monitoring the co-crystallization of indomethacin saccharin in an antisolvent process. In their application, the NIR method allowed to predict the chemical composition of the solution and Raman spectroscopy facilitated the identification of the solid-phase materials.
While optical spectroscopic screening and process monitoring can be considered emerging fields, product analysis applications are wide spread and represent mature approaches. In recent years, transmission Raman methods and spectroscopy in the terahertz (THz)/FIR region have become increasingly popular. An overview of transmission Raman spectroscopy was recently presented in this journal,9 and the cited literature therein. With a special focus on co-crystals, Burley et al.10 demonstrated that the technique allows the fast and automated classification of realistic co-crystal tablet formulations for product quality control purposes. They determined drug loading and whether two APIs are included as a co-crystal or as separate components in their model tablets. Charron et al.11 showed that THz spectroscopic imaging is a promising technique for distinguishing pharmaceuticals of similar molecular composition but differing crystal structures. They visualized the distribution of caffeine-oxalic acid co-crystals in non-uniform tablets.
Of course, there are many further studies, in which optical spectroscopy was applied to pharmaceutical co-crystals, but the above selection gives an overview and an idea where these methods can be used. In particular, the combination of experimental methods and the choice of appropriate data analysis tools can provide a multitude of information and hence make a significant contribution to improve pharmaceutical production at any stage.
Acknowledgment
The author gratefully acknowledges financial support from the German Research Foundation (Deutsche Forschungsgemeinschaft, DFG) through grant KI1396/4-1.
References
- M. Karimi-Jafari, L. Padrela, G.M. Walker, D.M. Croker, Creating Cocrystals: A Review of Pharmaceutical Cocrystal Preparation Routes and Applications, Crystal Growth & Design 18 (2018) 6370-6387.
- H. Haken, H.C. Wolf, Molecular Physics and Elements of Quantum Chemistry (Springer, Heidelberg, 1995).
- J.F. Hair Jr., W.C. Black, B.J. Babin, R.E. Anderson, Multivariate Data Analysis (Pearson Educational Limited, Essex, 2014).
- M. Alleso, S. Velaga, A. Alhalaweh et al., Near-Infrared Spectroscopy for Cocrystal Screening. A Comparative Study with Raman Spectroscopy, Analytical Chemistry 80 (2008) 7755-7764.
- M. Rodrigues, J. Lopes, M. Sarraguca, Vibrational Spectroscopy for Cocrystals Screening. A Comparative Study, Molecules 23 (2018) 3263.
- J. Kiefer, Recent Advances in the Characterization of Gaseous and Liquid Fuels by Vibrational Spectroscopy, Energies 8 (2015) 3165-3197.
- F.L.F. Soares, R.L. Carneiro, In-Line Monitoring of Cocrystallization Process and Quantification of Carbamazepine-Nicotinamide Cocrystal Using Raman Spectroscopy and Chemometric Tools, Spectrochimica Acta A 180 (2017) 1-8.
- M.J. Lee, N.H. Chun, M.J. Kim et al., In Situ Monitoring of Antisolvent Cocrystallization by Combining near-Infrared and Raman Spectroscopies, Crystal Growth and Design 15 (2015) 4385-4393.
- J. Kiefer, Transmission Raman spectroscopy for pharmaceutical analysis, American Pharmaceutical Review 22 (2019) 18-21.
- J.C. Burley, A. Alkhalil, M. Bloomfield, P. Matousek, Transmission Raman Spectroscopy for Quality Control in Model Cocrystal Tablets, Analyst 137 (2012) 3052-3057.
- D.M. Charron, K. Ajito, J.Y. Kim, Y. Ueno, Chemical Mapping of Pharmaceutical Cocrystals Using Terahertz Spectroscopic Imaging, Analytical Chemistry 85 (2013) 1980-1984.
Author Biography
Prof. Dr. Johannes Kiefer is Chair Professor and Head of the division Technische Thermodynamik at the University of Bremen, Germany. His research interests are the areas of developing and applying spectroscopic techniques for the characterization of advanced materials and processes.