Abstract
The use of Raman spectroscopy in cell culture bioprocesses can provide in-situ analysis of critical process parameters when partnered with chemometric modeling. Traditionally, each parameter to be analyzed is individually modeled, with each model being calibrated to specific regions of the Raman spectra. SIMCA [Umetrics; Malmo, Sweden] is a software commonly used in biomanufacturing for calibrating and deploying chemometric Raman models. The chemometric model building process is time consuming and follows the same steps. There are no time savings techniques to deploy when more process parameters are modeled. Also, the model accuracy is dependent on the modeler’s technical abilities. Thereby, time must be allotted for training and model review. Finally, when applying traditional spectral filters during pre-processing, process specific components may sometimes impede chemometric modeling due to fluorescence interference. Utilizing spectral filters in series can alleviate fluorescence interference, augment spectral features and reduce spectral noise, though filter selection screening can be very laborious.
Featured Product tag to place with featured articles.To overcome these challenges, Python scripting was utilized to automate model building in SIMCA. The Python console available in SIMCA versions 14 and after, allows users to create custom scripts to automate standard work. In this paper, traditional User-defined chemometric modeling results and resourcing will be compared to the time it takes to create equivalently performing models using novel Python scripting. Utilizing this script in the SIMCA Python console saves time and standardizes the model building process.
Introduction
Production of therapeutic proteins from modified Chinese Hamster Ovary (CHO) cells requires real-time monitoring and control of cell culture processes to ensure optimal cell growth and product concentrations.1-3 Raman spectroscopy is a process analytical technology (PAT) tool that has been used successfully for in situ bioprocess monitoring by gathering spectral data real-time from bioreactor cultures.4 Raman spectroscopy provides an alternative to manual sampling and offline analysis by providing real-time, model-based predictions of critical parameters. This is made possible by calibrating data-driven multivariate models that correlate Raman spectra to the values of critical cell culture performance parameters.5,6 This paper will compare traditional User-defined Raman chemometric model development with SIMCA against automated Raman chemometric model development resulting from Python scripts.
Materials and Methods
Cell Culture Setup
Amgen proprietary cell line and media were used in this study. The cells were cultured in a fed-batch process. The spectral data measurements were acquired with a cart-mounted multi-channel analyzer spectrometer equipped with Class IIIb 785 nm diode laser and a Kaiser [Kaiser Optical Systems; Ann Arbor, Michigan, United States] Bio-Optics stainless steel non-sapphire windowed immersion optics (220 mm length). A Nova BioProfile Flex analyzer with osmometer and cell counting modules were used to measure offline cell culture samples.
Raman Calibration and Settings
The calibration and verification activities of the Raman instrument were performed with a Raman Calibration Accessory (HCA) and the iC Raman software version 4.1.917. The HCA tungsten-halogen reference standard lamp was used for intensity calibrations and verifications, and 70% IPA for laser wavelength calibration and system verification. The default Raman software version 4.1.917 spectral data acquisition settings of 10 second exposure times and 75 scan accumulations were used for all spectral data collection measurements. Raw spectral fi les (.spc format) were retrieved, matched with off -line reference values, and exported as a spectral database compatible with SIMCA MVDA software.
Traditional User Defined Chemometric Model Development
The model development process was performed for each cell culture parameter individually with SIMCA software version 15. The dataset was imported, prefiltered to minimize noise, and irrelevant spectral regions and outliers removed. This process of calibrating a Raman predictive model with available SIMCA MVDA algorithms identifies principal components (PC) that explain the systematic variation and covariance in the dataset.
The spectral dataset generated was used to build multiple iterations of the Partial Least Square (PLS) models for each cell culture parameter, and mathematical spectral fi lters were used to transform the spectral dataset before PLS modeling. Various preprocessing treatments were applied to the raw spectral data to amplify the chemical vibrational information contained within the spectra. Partial Least Square statistical results and analysis methods available in the SIMCA software were applied to remove spectral outliners in the dataset.
Subscribe to our e-Newsletters
Stay up to date with the latest news, articles, and events. Plus, get special offers
from American Pharmaceutical Review – all delivered right to your inbox! Sign up now!
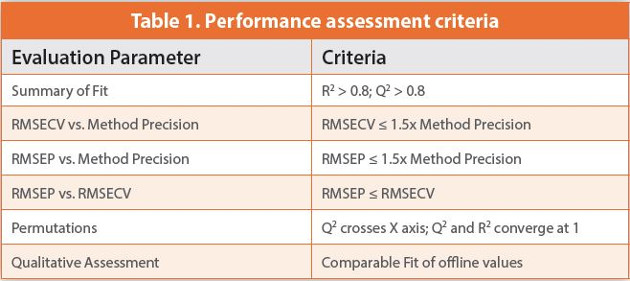
The optimal number of components or latent variables required to describe the percent of variation explained by each model was determined with the PLS modeling software (SIMCA) based on the summary of fit statistics: R2 and Q2. The R2 correlation coefficient is a measure of fi t that describes the percent of variation of observations in the calibration dataset explained by the PLS model. The Q2 value is a measure of predictive power that describes the percent of variation of the observations in the calibration dataset that are predicted by the models in cross-validation. The performance assessment of the Raman PLS models is first evaluated in SIMCA against assessment criteria Table1.
Model performance can be ascertained by evaluating the residual difference between the off -line reference method value and the online Raman predicted value acquired approximately at the same time. Cross validation is performed by removing a small subset of the data (prediction set) and then predicted the subset in the model.
Automated Chemometric Model Development
Python code was created to build chemometric models following the same methodology as the traditional user-defined chemometric model development and therefore the result of the Python Chemometric Model has comparable performance variables as shown in Tables 2 and 3. Although the methodology is the same, the rules applied via the Python scripts may differ from what a user would apply when taking process knowledge and modeling experience into consideration. This will result in slight differences in the final models. In general, model building can be divided into these four categories: 1) create the project, 2) create filtered dataset, PCA pre-screening, create model workset, 3) create model for designated variable, and finally 4) optimize the model.
Results and Discussion
The results of traditional user-defined modeling of Parameter A and Parameter B which utilized the methodology outlined in Section 2 is summarized in Table 1.
The Python Automated Modeling was built to allow for various preprocessing chained filters to be assessed at once. For this comparison, the equivalent user-defined dataset with the same pre-processing filters was selected for further processing, again utilizing Parameter A and Parameter B as the example variables, to ensure an unbiased comparison between the two methods.
In general, the resulting user-constructed and Python-derived models were similar in terms of performance statistics and pass criteria established in Table 1. It could be argued that the user SIMCA models were marginally better if only looking at the model assessment criteria. The main difference between the traditional user-defined models and the Python-derived models was in the number and how the outliers were removed as it is difficult to build in certain process knowledge into the Python script. However, it is important to point out that the user SIMCA model building takes 10X longer than the automated Python SIMCA model building. Additionally, the Python SIMCA model building provides insight into other filter chains. Each filter chain sequence, if pursued by the user in the traditional user-defined method, would incur another 10X time factor, with no cumulative time savings for each new filter chain sequence investigated. The Python scripts not only standardize the building process, it enables scientists lacking extensive chemometric experience to create impactful SIMCA models that are still practically significant. The result being a time savings that allows for faster model deployments by more users.
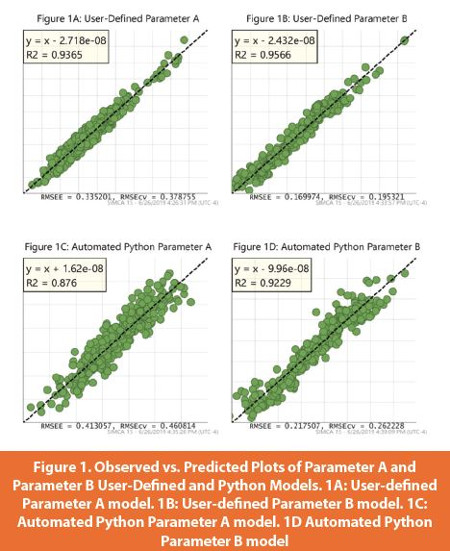
Several SIMCA operations allow for model assessment. Below, Observed versus Predicted Plots display the observed versus predicted values of the selected Y-variable. With a good model all the points will fall close to the regression line. The RMSEE (Root Mean Square Error of Estimation) in the footer indicates the fi t of the observations to the model, the RMSEcv is an analogous measure but estimated using the cross-validation procedure, and the R2 of the regression line indicates the Goodness of Fit.

Another SIMCA assessment tool is the Permutation. The Permutations Plot helps to assess the risk that the current PLS or PLS-DA model is spurious, i.e., the model just fits the training set well but does not predict Y well for new observations. The idea of this validation is to compare the goodness of fi t (R2 and Q2) of the original model with the goodness of fi t of several models based on data where the order of the Y-observations has been randomly permuted, while the X-matrix has been kept intact.
Figure 2 shows, for a selected Y-variable, on the vertical axis the values of R2 and Q2 for the original model (far to the right) and of the Y-permuted models further to the left. The horizontal axis shows the correlation between the permuted Y-vectors and the original Y-vector for the selected Y. The original Y has the correlation 1.0 with itself, defining the high point on the horizontal axis.
The plots strongly indicate that the original model is valid, with the criteria for validity being:
- All blue Q2-values to the left are lower than the original points to the right.
Or
- The blue regression line of the Q2-points intersects the vertical axis (on the left) at, or below zero.
Note that the R2-values always show some degree of optimism. However, when all green R2-values to the left are lower than the original point to the right, this is also an indication for the validity of the original model.
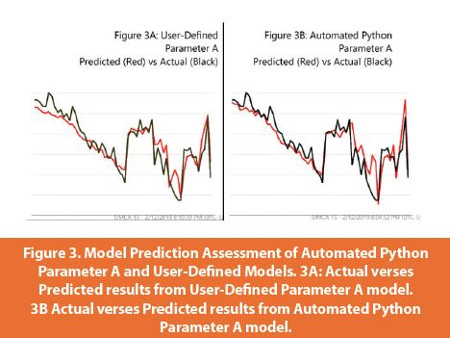
Data points not included in the modeling dataset can be imported as a prediction set. Those spectra were then predicted by the model, which is shown below. The black line are the actual offline Parameter A values, and the red line are the Parameter A values predicted by the model. Here it is easy to see the similarity between User-defined and Automated Python model performance.
It is important to reiterate that standardization of modeling and time savings were the key performance indicators sought after when creating Python scripts to automate the Chemometric Model Development in SIMCA.
Conclusions
By adopting and applying best practices, Python scripts can be used to standardize the SIMCA modeling process and remove user (i.e., modeler) variability. In addition to a 10X time savings for modeling, less time will be needed on training personnel on SIMCA operations and use. This time savings, that allows for faster model deployment, by more users, is an enabler to expanding Raman model deployment for multiple processes at multiple Amgen sites.
It is a precursor to a sustainable global monitoring and control strategy based on PAT-enable instruments.
References
- J. Y. Kim, Y.-G. Kim, and G. M. Lee, “CHO cells in biotechnology for production of recombinant proteins: current state and further potential,” Applied Microbiology and Biotechnology, vol. 93, no. 3, pp. 917-930, 2012.
- Y. Fan, I. Jimenez Del Val, C. Müller, J. Wagtberg Sen, S. K. Rasmussen, C. Kontoravdi, D. Weilguny, and M. R. Andersen, “Amino acid and Parameter A metabolism in fed-batch CHO cell culture aff ects antibody production and glycosylation,” Biotechnology and Bioengineering, vol. 112, no. 3, pp. 521-535, 2015.
- F. Torkashvand, B. Vaziri, S. Maleknia, A. Heydari, M. Vossoughi, F. Davami, and F. Mahboudi, “Designed amino acid feed in improvement of production and quality targets of a therapeutic monoclonal antibody,” PloS One, vol. 10, mo. 10, p. e01450597, 2015.
- Whelen, J., Craven, S., Glennon, B., “In Situ Raman Spectroscopy for Simultaneous Monitoring of Multiple Process Parameters in Mammalian Cell Culture Bioreactors”. 2012.
- Tulsyan, A., Garvin, C., Undey, C., “Industrial batch process monitoring with limited data”. Journal of Process Control, vol. 77, May 2019, pp. 114-133.
- Tulsyan, A., Schorner, G., Khodabandehlou, H., Wang, T., Coufal, M., Undey, C., “A machine learning approach to calibrate generic Raman models for real-time monitoring of cell culture processes”. Biotechnology and Bioengineering, vol. 116, pp. 2575-2586, 2019.