(PT Innovation and MSAT, Technology Acceleration Team)
Introduction
Advanced data analytics tools are used throughout the biopharmaceutical industry, from leveraging computational biology for drug discovery, to increasing process understanding and improvement through predictive monitoring, to smart packaging and blockchain supply chain, and to targeted patient engagement programs for better treatment outcomes. As biologics manufacturing comprises complex and relatively poorly understood processes, digital technologies such as process models can transform data into insights and thus are key enablers for the future. Given the complexity of unit operations and processes in the drug substance (DS) manufacturing realm, enabling proactive measures before a problem arises via predictive technologies is of particular interest for the biopharmaceutical industry. As a result, major eff orts of digitalization in DS manufacturing focus on process models and the realization of their potential.
Data Analytics in Bioprocessing
The data analytics ascendancy model as described by Gartner (Maoz, 2013) can be broken down into 4 main stages; Figure 1 illustrates the steps and how they are applied in bioprocessing.

- Descriptive Analytics – “What happened?”, this type of analytics provides insights into the past and an understanding of how the manufacturing process is performing by providing context to interpret the data. An example is data visualization such as control charts for cell growth in the bioreactors.
- Diagnostics Analytics – “Why did this happen?”, this is a deeper analysis such as root cause analysis, exploring the data and making correlations. Examples include chromatogram review and batch-scale comparison models.
- Predictive Analytics – “What will happen?”, most applicable in today’s bioprocessing and modeling to allow forecasting and better anticipation of future failures. An example of this is real time multivariate data analysis (MVDA) process monitoring.
- Prescriptive Analytics – “How can we make it happen?”, last stage of the continuum, focusing on driving manufacturing toward optimal outcome by proactive decision support, with smart factory concept using advanced automation for optimized setpoints and controls as an example.
Implementation in the Real World
Managing Analytics Infrastructures
In order for advanced analytics and process models to be useful and sustainable, a robust infrastructure solution for process data management and dissemination of data analytics and visualization is required. An example of a modular analytics environment is shown in Figure 2 and consists of three core components:
- Data structure and connections to manufacturing data sources (green)
- Calculation engine/analytics layer (orange)
- Virtual machines and/or applications (blue), user-interface and database hosting service
With this modular data analytics environment, independent calculation packages (modules) with new mathematical approaches can be added with user-specific interfaces developed and updated within the analytics environment application accordingly.
Business Processes
For streamlined implementation and sustainability of data analytics technologies, especially in a complex DS manufacturing network, it is essential to establish a clear and robust business process. One of the most important elements of the business process is defining roles and responsibilities. From the example depicted in Figure 2, roles and responsibilities can be split between the analytics environment (shared components) and each independent calculation module or application.
Subscribe to our e-Newsletters
Stay up to date with the latest news, articles, and events. Plus, get special offers
from American Pharmaceutical Review – all delivered right to your inbox! Sign up now!
The roles at the analytics environment level are intended to develop and maintain shared needs and services:
- Environment Process Owner – Accountable for all technical aspects of module integration into the analytics environment with in-depth knowledge of bioprocessing, IT, automation, and business analytics
- Environment Business Process Owner – Responsible for design, establishment, and sustainment of business process and driving improvement strategy and vision of the analytics environment
- IT Product Manager – Support data access to the environment and ensure infrastructure is in place at the enterprise level
Module-specific roles are needed to address an application’s respective approach and requirements:
- Module Process Owner – Accountable for module/application specific mathematical approach or vendor management, visualization within the analytics platform, and user support
- Module Business Process Owner – Owner of module specific business process and responsible for driving improvement and vision for the module
- Module Technical SME – Acts as module superuser and promotes usage or tool for support of manufacturing processes. Responsible for building and improving of models within module/application
Case Study: Chromatography Transition Analysis
As column chromatography is an essential component in protein biologics purification processes, monitoring the performance of liquid chromatography columns is necessary to ensure product quality. Column pack integrity is associated with the chromatography separation capability and resolution, and the default method of determining column packing efficiency is pulse injection testing. The method uses an injection of a well-detected and inert chemical tracer to the liquid flow close to the column inlet, and the broadening of this pulse is analyzed when measured as an elution peak at the column outlet. This method is impractical for ongoing monitoring of production-scale chromatography columns in routine manufacturing operations due to the need of auxiliary equipment and buffers and associated labor and resources.
Transition analysis (TA) utilizes existing in-process data to monitor the performance of packed bed columns through analysis of signals such as pH, conductivity, and optical density at the column outlet as a response to chromatography transitions (Larson et al., 2003). The resulting breakthrough curve from a transition (see Figure 3) can be analyzed by utilizing the first derivative of the response curve.
Value of Chromatography Transition Analysis
Compared to visual review of chromatograms and the use of a pulse injection test for column integrity, transition analysis provides several advantages. The analysis can be performed with in-process data during or after each batch, without impact to normal operations. Not only does the method detect integrity failures, it is also used to monitor the performance of columns in manufacturing over the column lifetime and provides trends rather than a snapshot. Through lifecycle monitoring of transition analysis parameters, performance degradation and column failures may become predictable, resulting in reduction of batch losses and ability to maintain process consistency. Additionally, the use of chromatography transition analysis supports continuous improvement eff orts and improved process knowledge. By continuing to improve column packing techniques at the production scale, improved separation performances and yield can be achieved.
Building Network Capability
The diversity of equipment, data infrastructure, IT systems, processes and products in a global manufacturing network with multiple drug substance facilities must be taken into consideration. The goal is to deploy a standardized and flexible chromatography column health monitoring strategy to streamline analytics and facilitate cross-site and/or cross-product comparison.
In order to build the capability for chromatography TA across a manufacturing network, the fi rst step is knowledge building. Column integrity can be modeled using various transition analysis methods, and by implementing continuous column monitoring and piloting the calculation methods at different sites, data can be collected to understand feasibility and applicability. Once the data are available, comparative analysis of the transition analysis data can be performed across the different manufacturing sites and processes. Based on the analysis, harmonization of the appropriate methods can enable establishment of network procedures on business processes and clear decision making. Additionally, in order to implement a sustainable tool across the network, the tool should have a robust centralized infrastructure (e.g. sustainable analytics architecture) while enabling automated business decision making (e.g. column repacking).
Evaluation of Methods
A variety of methods exists for chrom TA with comparable capability to detect column integrity changes. The evaluation to determine the appropriate method(s) for implementation should be based on an objective comparison via acceptance testing based on criteria comprising desired characteristics of the final tool. Other factors to consider include resources required for development, ease of implementation, tool simplicity, and site systems (IT/Automation) compatibility.
Generally, an objective method selection test consists of the following steps: 1) defining and prioritizing requirements for method selection of final tool, 2) defining acceptance criteria and ranking procedures, 3) designing tests and data set selection, and 4) running the tests by applying the predetermined criteria. For transition analysis, the key parameters should demonstrate the same magnitude of detection level as traditional pulse injection test parameters, and the acceptance criteria primarily focus on sensitivity, robustness, and correlation to the classical pulse injection output. The data set used for methods evaluation must be representative and sufficient to cover the range of variability with regards to resin type, data sampling rates, and data artifacts that may exist.
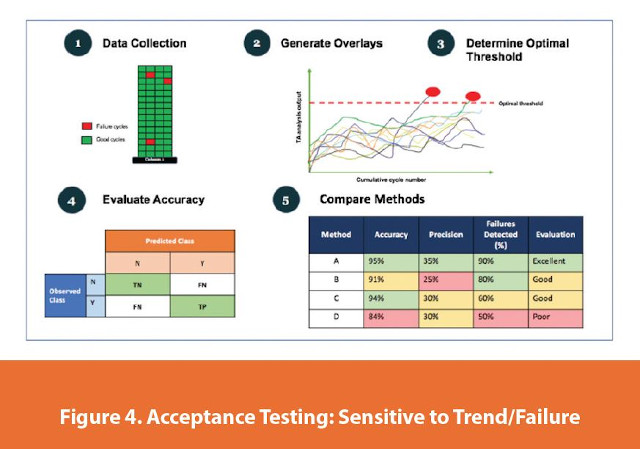
An example acceptance testing and evaluation for sensitivity to trend/failure is depicted in Figure 4.
- Data Collection – Process data for each chromatography column type are collected. Failure data refers to all available cycles from poorly performing column packs, and good data refers to all available cycles from other (non-failure) packs of the same resin type and product.
- Generate Overlays – With the data collected, transition analysis outputs are plotted against cumulative cycle number for each metric and resin type to create an overlay for visualization.
- Determine Optimal Threshold – The threshold for unacceptable failure can be determined based on a cost function assuming each breakthrough run is equivalent to the cost of not utilizing a set number of resin cycles. The cost function used can be customizable based on risk tolerance and resin costs for the column being monitored.
- Evaluation Accuracy – A confusion matrix is used to show true positives, true negatives, false positives, and false negatives and determine model performance (accuracy, precision, sensitivity, specificity).
- Compare Methods – The methods are objectively evaluated by comparing the accuracy, precision, and detection capability of the methods.
Network Implementation
One or more chromatography TA calculation methods can be selected for implementation across a manufacturing network based on acceptance criteria evaluation from methods testing. The selected method(s) can be a standalone parameter or a combination of calculated parameters demonstrating strong sensitivity to trend and step change as well as robustness when data artifacts are present for every in-scope site and process. To improve predictive capability, auxiliary parameters for interpretation and analysis can also be considered and included in the tool.
For smooth transition from a pilot tool to implementation, each manufacturing site across the network should assess readiness from both a technological and workforce standpoint. Calculation modules, such as transition analysis for chromatography columns, should not be standalone tools, should be amenable to minimal maintenance and oversight, and could be hosted on an analytics environment as described earlier or on an enterprise level solution. Each of the sites must ensure that data connections are in place with the appropriate level of contextualization to ensure the calculation can be performed consistently. From a workforce readiness perspective, a centralized organization acting as owner of the technology and know-how as well as a user group with data science and analytics capability are essential for the adoption and long-term success of these tools.
Next Steps
The ultimate goal of establishing chromatography TA capability is the evaluation of mined data and interpretation of the results. Once column monitoring is in place, the next step is to further test the predictive capabilities of the models to determine effectiveness of failure prediction across the sites and for the different column types. Like all model-based analytics, the evaluation of the algorithms is an iterative process wherein user feedback enables continuous improvement in the quality of results.
Conclusions
In order to implement and sustain digital transformation, the appropriate scope of digitalization efforts must be proactively defined for the focus area. In the case of digitalization of biologics drug substance manufacturing, data analytics for manufacturability and reliability is a logical first step. The grouping of related efforts allows for synergy in the infrastructure solution as well as the business processes. Roles and responsibilities for development, adoption, and sustainment of digitalization tools should be clearly defined in order to identify gaps for needed skills set; when the people and tools are fit for purpose, capability building can be expedited. As digitalization is still in its infancy for the biopharmaceutical industry, change management is crucial not just for the IT and automation systems but also for the workforce, with a focus on mindset shift as well as adapting to a more agile way of working.
Acknowledgements
The author would like to recognize the members of the Roche Chromatography Transition Analysis network project team for their contribution to the development of a network program for column health monitoring and thanks to the Digital Clone Platform team for their work on analytics infrastructure and business process definitions.
Reference
- Maoz, M. 2013. How IT Should Deepen Big Data Analysis to Support Customer-Centricity. Gatner G00248980. Available at: https://www.gartner.com/en/documents/2531116/how-it-should-deepen-big-data-analysis-to-support-custom. Assessed May 20, 2020.
- Larson TM, Davis J, Lam H, Cacia J. Use of process data to assess chromatographic performance in production-scale protein purification columns. Biotechnol Prog. 2003;19(2):485-492. Doi: 10.1021/bp025639g