Faculty of Science and Technology
Department of Archaeology, Anthropology and Forensic Science
School of Pharmacy, Reading University
Bournemouth University, Fern Barrow
Abstract
Rapid identification of cosmetics is important particularly in warehouses that witness the large inflow of products every day. Attenuated total reflectance Fourier transform infrared ATR-FTIR spectroscopy offers the advantage of measuring low amounts of samples (few milligrams or milliliters) in minimal time. Therefore, this work evaluated the accuracy of ATR-FTIR spectroscopy for identification of cosmetic products. A total of 99 cosmetic products of different manufacturers were measured using an FTIR spectrometer over the wavenumber range of 400 – 4000 cm-1. Spectra of the aforementioned products were exported to Matlab 2019a where spectral interpretation, correlation in wavelength space (CWS) and principal component analysis (PCA) methods were applied. Spectral interpretation showed absorbance patterns specific to constituents present in cosmetic (e.g. stearates, alcohol and water). CWS gave some mismatches in identification particularly for compounds with overlapping constituents. Nonetheless, when combined with PCA more accurate classification of cosmetics was obtained. In summary, ATR-FTIR offered efficient identification of cosmetic products when used in combination with CWS and PCA methods.
Introduction
Cosmetic products are widely used by the general population. Skin and hair products are used to get a skin tan, to lighten the skin; while other products are used to soften the skin or smooth the appearance of wrinkles; to restore sunken cheeks or to plump up the lips. An example of these products is melanotan II which is the most popular product purchased online to create a darker skin tone.1 Contrary to general belief, the use of these products is not completely safe and can be associated with serious side effects such as facial flushing, fatigue, nausea, and vomiting.2 Typically, these products are mixtures of different compounds with minimum knowledge on which ingredient is causing these side effects. Likewise, none of the products were analyzed to conclude which active substances may have caused the effects.3
The long-term damage posed by unregulated use of these products, still, remains unknown.4 On the other hand, products used to lighten the skin have been used for many years, with case reports of harm caused by them dating back to the 1920’s.5 Other online products have been sold with the intention to treat acne, blemishes, and freckles, working by blocking the production of the pigment melanin in the skin, effectively causing patchy discoloration.6 Although products have been seized, suppliers have been prosecuted and case studies of the side effects have built up over 30 years in the UK, it remains unknown how many people use these products, why they are being used, and how they are using them. In addition, these skin lightening products often contain mercury which can cause serious damage to the kidneys and nervous system. Worldwide, hundreds of people have been poisoned by these products, with five cases reported in the UK within a two-year period.7 Furthermore, other products have been found to contain hydroquinone, which causes side effects to the skin including irritation and a bluish-black discoloration, also known as ochronosis.6 Hence, there is an urgent need to develop analytical techniques that are accurate, fast and can be used to screen large number of batches.
A number of classical techniques have been used to analyze cosmetics. The perfume and aroma industry usually adopt conventional techniques, including vacuum-, hydro- or steam-distillation for sample preparation, and capillary gas chromatography (GC), capillary gas chromatography-mass spectrometry (GC-MS), or capillary gas chromatography-Fourier transform infrared (GC-FTIR), and liquid chromatography (LC) for analysis. High Performance Liquid Chromatography (HPLC) has been used as an analytical method for the quality control analysis of cosmetics, and to identify their compounds. An example of this is using liquid chromatography for quantitative determination of UV filters paraaminobenzoic acid (PABA), previously banned in cosmetic products to be marketed in EU products since 1992, in sunscreen products. However, despite that these methods are accurate at determination of individual components, their use remains limited due to the large batches that need to be tested. These techniques require extensive steps for analysis, use of solvents and trained staff to perform and analyze the data.
Attenuated total reflectance Fourier transform infrared (ATR-FTIR) spectroscopy is a classical technique widely used in the pharmaceutical industry due to its being rapid and non-destructive and requiring minimal sample preparation. Recently, FTIR has been deployed in the cosmetic industry for product characterization,8 -12 stability,13,14 identifying contaminants15 and/or forensic identification of crime scene samples.16,17 The aforementioned studies evaluated a limited sample size of products and hence did not inform about cosmetic identification in manufacturing settings. Therefore, the present study aimed to address the gap in the literature in relation to the evaluation of ATR-FTIR as a rapid technique for the identification of a large sample of cosmetic products obtained from various manufacturers and sources.
Experimental
Method
A total of 99 cosmetic products were evaluated and were of different formulations including liquids, solids and semi-solids (Table 1). Products were stored in glass vials then measured using an FTIR spectrometer equipped with an ATR. FTIR spectra were collected over the wavenumber range of 4000 – 400 cm-1 with a spectral resolution of 4 cm-1. Three spectra were collected product such that each spectrum was the sum of 16 scans.
Data analysis
Data analysis comprised spectral interpretation of peaks and quality, correlation in wavenumber space (CWS) and principal component analysis (PCA) methods which were applied in Matlab 2019a.
Spectral interpretation was conducted by examining the position of the functional groups against reference IR tables. Spectral quality was evaluated by considering the following parameters: number of peaks, absorbance/scattering range, the maximum peak position, maximum peak intensity, and signal to noise ratio (S/N). Using the aforementioned parameters spectra were categorized of having weak, medium or strong IR activity.
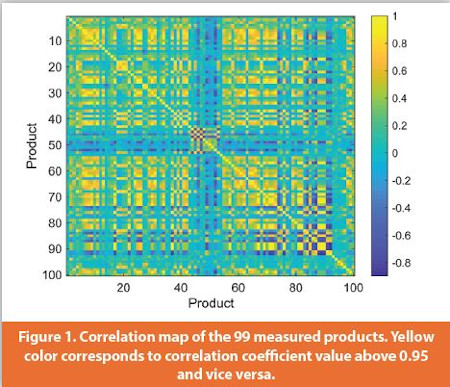
Spectral comparison of products was made using CWS method where the correlation coefficient (r) value was calculated as a numerical value between -1 and +1. A threshold of 0.95 was considered a match. All products’ spectra were expected to give r value above 0.95 against their corresponding reference spectra otherwise a false negative was encountered. Likewise, products’ spectra were expected to give an r value below 0.95 against different materials’ spectra otherwise a false positive was encountered.
Similarity among raw materials and products was also explored using PCA. The PC scores plot showed closely related clusters for similar products. False negatives were encountered when one or more product score was not clustered among other scores. On the other hand, false positives were seen when a product was clustered among different products.
Results and Discussion
The choice of the raw materials chosen in this work was based on the top 99 raw materials encountered in the cosmetic industry. The materials included a range of different colors and formulations being solids, semi-solids and liquids. It was important to ensure the range of colors and consistencies among the selected materials to explore whether the aforementioned two factors influence the results.
Spectral interpretation
IR spectral interpretation of the selected products was complex owing to the several bands attributed to each functional group and to the presence of many functional groups per each product. The degree of hydration of each product and the presence of water in the product also affected the analysis. Water bands in the products’ spectra appeared at 2938 cm-1 and 1538 cm-1 and those bands overlapped with the cosmetics’ products and interfered with the analysis. Nonetheless, in all IR spectra of the products, main bands were observed corresponding to the following functional groups: CH, C=O, C=C, C=N and COC. Products with CH groups showed strong peaks at 2970, 2956, 2940, 2932, 2916, 2884 and 1450 cm-1. Carbonyl (C=O) group was confirmed by the presence of strong peaks at 1840, 1738, 1724 and 1608 cm-1. Aromatic CC stretch (C=C) indicated strong peaks at 2184, 2098, 1974, 1922, 1882, 1656 and 1596 cm-1. Nitrile (C=N) group had medium band at 1656 and 2244 cm-1. Ether group (COC) showed weak bands at 1156, 1130, 1128 and 1064 cm-1 and medium bands at 998, 948, 890 and 842 cm-1.
Spectral quality
The spectral quality of products evaluated showed mainly strong (n= 42) or medium (n = 39); whereas, only 18 products showed weak IR activity (Table 1). Products with strong IR activity showed a number of peaks in the range of 12-39 peaks between the range of 399 – 4000 cm-1. It is noteworthy to mention that the number of peaks did not relate to the absorbance intensity of the products. For instance, P093 showed 39 peaks but had a relatively low absorbance intensity (0.004 absorbance units). Likewise, P049 showed only 14 peaks and had relatively high absorbance intensity of 0.68 absorbance units. The same scenario was observed for S/N ratio where the highest S/N ratio was observed for P009 (S/N = 24) that showed 15 peaks only. Overall, the S/N ratio for strong IR active compounds was in the range of 7-24 apart from one product that showed S/N of 5 (P049). Nonetheless the latter product had the highest absorbance intensity so its IR activity could not be considered medium. As the case of strong IR active products, products with medium IR activity did not show a relationship between the number of peaks, maximum intensity and S/N ratios. Hence, products with medium IR activity showed ranges of number of peaks, maximum intensity and S/N of 7-34, 0.001-0.13 and 3.34-10.5 respectively. The number of peaks was numerous in all of the measured products regardless of the activity and this could be attributed to the numerous functional groups in cosmetic products.9 In this respect, numerous peaks were observed for weak IR active compounds that were in the range of 11 – 29 peaks. Nonetheless, the latter mentioned groups of products had very low absorbance intensities in the range of 0.0005 – 0.008 absorbance units. In addition, the S/N ratio of the weak IR active products was lower than the other products and ranged between 1.67 and 6.
Subscribe to our e-Newsletters
Stay up to date with the latest news, articles, and events. Plus, get special offers
from American Pharmaceutical Review – all delivered right to your inbox! Sign up now!
Spectral comparison
Spectral evaluation showed a distinct comparison for 73% of the products measured (Figure 1). This was apparent for the r values that were below the threshold between the spectra of the distinct products. Nonetheless, 27 products showed r values >0.95 against different products. This could be attributed to the overlapping constituents and the presence of common functional groups that were IR active such as CH and C=O that showed strong peaks in the IR spectra of the products. This further confirmed that the presence of other ingredients distinct to each product was not detected in their IR spectra. In this respect, r values > 0.95 were observed for five groups of products group 1 (P007 with another product), group 2 (P011 with seven products), group 3 (P013 with another product), group 4 (P017 with six products) and group 5 (P025 with seven products).
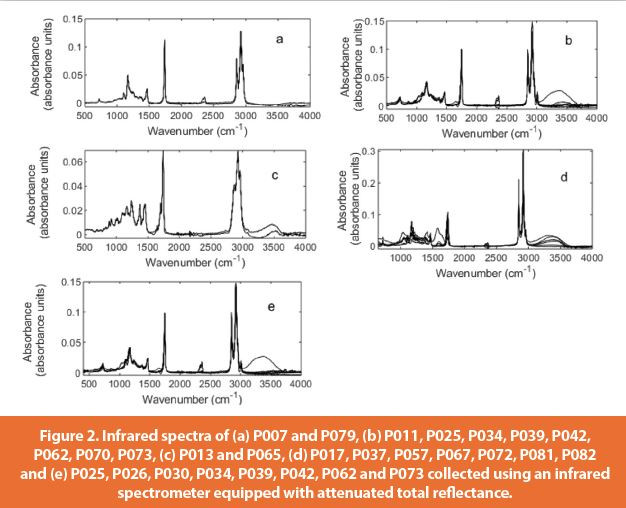
For group 1, P007 (Cetiol RLF) showed r value of 0.99 against P079 (Cetiol C5) where both products contained caprylate and were manufactured by the same manufacturer (Figure 2).
For group 2, P011 (castor oil) gave high r values against seven products being P025 (olive soft wax), P034 (olive pomace oil), P039 (wheatgerm oil), P042 (grapeseed oil), P062 (castor oil), P070 (rosehip oil) and P073 (winterized sunflower oil). It is noteworthy to mention that the r value of P011 against the aforementioned products was 0.96 apart from P062 where the r value was 0.99. This is explained by the fact that both P011 and P062 contained castor oil as the main ingredient and were manufactured by the same manufacturers and this confirmed that both products were identical. Nonetheless, the other oils gave 0.96 that was attributed to the fatty acid composition that is present in high concentration in oils and waxes.10 Subsequently, the threshold of r value for identification of oils and waxes should be raised to 0.99 to avoid false positives attributed to the fatty acids.
For group 3, P013 (Mens grooming citrus) showed an r value of 0.99 against P065 (Perfume: Mens Grooming). Both products were manufactured by the same manufacturer and shared the same matrix that consisted of mixtures of aromatic substances.
For group 4, P017 (Emulium Kappa) gave r values 0.95 or 0.96 against six products being P037 (Cegesoft HF62), P057 (Lipex Sheasoft), P067 (Cutina HVG), P072 (Olive Cosmetic Wax), P081 (Imwitor 372P) and P082 (Montana 65). P017 contained stearates as main ingredients that were common in the other products. P018 (Bitrex 2.5%) showed r values in the range of 0.95 – 0.98 against four products P038 (Witch Hazel Distillate), P040 (Reach 501), P063 (Merquat 550) and P068 (Hydrolastan PF). All of the aforementioned products contained a high percentage of water (>50%) and that influenced their spectra and correlation.
For group 5, P025 (Olive Soft Wax) showed r values in the range of 0.96-0.98 against seven products being P026 (Lipex Sheasoft), P030 (Olive oil CT), P034 (Olive Pomace Oil), P039 (Wheatgerm Oil), P042 (Grapeseed Oil), P062 (Castor Oil) and P073 (Winterised sunflower oil). The high r values among the aforementioned products were attributed to the similarity in the fatty acid composition.
Hence, for all of the aforementioned groups similar products showed r values in the range of 0.95 – 0.98 whereas identical products (in terms of constituents and manufacturer) shows r values of 0.99.
Therefore, PCA was utilized unsupervised to groups 2, 4 and 5 where mismatches were observed for more than six products. Group 2 PC scores contributed to 85.7% of the variance among the data and showed distinct clusters corresponding to the eight products (Figure 3). It is noteworthy to mention that the two products containing castor oil (P011 and P062) were closely related on PC1 and PC2 but could be differentiated by PC3. On the other hand, group 4 and group 5 PC scores plot explained 94.5% and 87.3% of the variance among the data yet could only identify 87.5% of the products. The aforementioned two plots indicated distinct clusters for seven out of the eight products (Figures 4 and 5). Figure 4 displayed distinct clusters for all products apart from P017 which scores were scattered over PC1 and PC2. Likewise, P026 in group 5 had their scores scattered over PC1 and PC3.
Henceforth, PCA showed 87.5% accuracy in classifying products of common ingredients.
Conclusion
In summary, ATR-FTIR demonstrated a quick and informative technique for identification of cosmetics. The technique was efficient in documentation of key functional groups specific to major constituents in cosmetic products such as fatty acids in oils. Yet for individual products’ characterization, a combination of CWS and PCA was required. CWS gave mismatches for products of common ingredients with range of r values of 0.95-0.98. Yet, this was addressed when PCA was applied that could discriminate 87.5% of the products.
Therefore, for cosmetic product identification one of two approaches is ideal. The first would be to raise the r value threshold to 0.99 and the second would comprise combining CWS and PCA methods
References
- Hadley, M.E., Hruby, V.J., Blanchard, J., Dorr, R.T., Levine, N., Dawson, B.V., Al-Obeidi, F. and Sawyer, T.K., 2002. Discovery and development of novel melanogenic drugs. In Integration of Pharmaceutical Discovery and Development (pp. 575-595). Springer, Boston, MA.
- Van Hout, M.C., 2014. SMART: An Internet study of users experiences of synthetic tanning. Performance Enhancement & Health, 3(1), pp.3-14.
- Langan, E.A., Ramlogan, D., Jamieson, L.A. and Rhodes, L.E., 2009. Change in moles linked to use of unlicensed “sun tan jab”. Bmj, 338, p.b277.
- Evans-Brown, M., McVeigh, J., Perkins, C. and Bellis, M.A., 2012. Human enhancement drugs: The emerging challenges to public health. North West Public Health Observatory.
- Goeckermann, W.H., 1922. A peculiar discoloration of the skin: probably resulting from mercurial compounds (calomel) in proprietary face creams. Journal of the American Medical Association, 79(8), pp.605-607.
- Brilliant, M.H., 2006. Molecular regulation of melanin formation: melanosome transporter proteins. The Pigmentary System: Physiology and Pathophysiology, pp.230-241.
- Palmer, R.B., Godwin, D.A. and McKinney, P.E., 2000. Transdermal kinetics of a mercurous chloride beauty cream: an in vitro human skin analysis. Journal of Toxicology: Clinical Toxicology, 38(7), pp.701-707.
- Juncan, A.M., Fetea, F. and Socaciu, C., 2014. APPLICATION OF FOURIER TRANSFORM INFRARED SPECTROSCOPY FOR THE CHARACTERIZATION OF SUSTAINABLE COSMETICS AND INGREDIENTS WITH ANTIOXIDANT POTENTIAL. Environmental Engineering & Management Journal (EEMJ), 13(1).
- Lukitaningsih, E., Sa’adah, M. and Rohman, A., 2012. Quantitative analysis of lard in cosmetic lotion formulation using FTIR spectroscopy and partial least square calibration. Journal of the American Oil Chemists’ Society, 89(8), pp.1537-1543.
- Rohman, A. and Che Man, Y.B., 2009. Quantitative analysis of virgin coconut oil in cream cosmetics preparations using fourier transform infrared (FTIR) spectroscopy. Pakistan journal of pharmaceutical sciences, 22(4).
- Rohman, A. and Che Man, Y.B., 2011. Analysis of lard in cream cosmetics formulations using ft-ir spectroscopy and chemometrics. Middle-East Journal of Scientific Research, 7(5), pp.726-732.
- Sadeghi-Jorabchi, H., Wilson, R.H., Belton, P.S., Edwards-Webb, J.D. and Coxon, D.T., 1991. Quantitative analysis of oils and fats by Fourier transform Raman spectroscopy. Spectrochimica Acta Part A: Molecular Spectroscopy, 47(9-10), pp.1449-1458.
- H. Masmoudi, Y.L. Dreau, P. Piccerelle, J. Kister, The evaluation of cosmetic and pharmaceutical emulsions aging process using classical techniques and a new method: FTIR, International journal of pharmaceutics, 289 (2005) 117-131.
- Masmoudi, H., Le Dréau, Y., Piccerelle, P. and Kister, J., 2005. The evaluation of cosmetic and pharmaceutical emulsions aging process using classical techniques and a new method: FTIR. International journal of pharmaceutics, 289(1-2), pp.117-131.
- Detection of whitening agents in illegal cosmetics using attenuated total reflectance-infrared spectroscopy. Journal of pharmaceutical and biomedical analysis, 98, pp.178-185.
- Chophi, R., Sharma, S. and Singh, R., 2020. Forensic analysis of red lipsticks using ATR-FTIR spectroscopy and chemometrics. Forensic Chemistry, 17, p.100209. Deconinck, E., Bothy, J.L., Desmedt, B., Courselle, P. and De Beer, J.O., 2014.
- Sharma, S., Chophi, R., Kaur, H. and Singh, R., 2020. Differentiation of Cosmetic Foundation Creams Using Attenuated Total Reflection Fourier‐Transform Infrared Spectroscopy: A Rapid and NonDestructive Approach in Trace Evidence Analysis. Journal of Forensic Sciences, 65(3), pp.751-761.
Acknowledgement
The authors would like to thank Karen Taylor from Hampshire Cosmetics for supplying raw materials and products.