Merrilee Whitney - Head of BioContinuum™ platform at MilliporeSigma
Today’s mammalian cell culture monitoring strategies are complex and highly variable, and yet only a handful of key parameters, such as temperature, pH, and dissolved oxygen (DO), are controlled in real-time. Measurement and control of these cell culture parameters are essential for a robust process. However, they do not directly indicate the culture content itself; instead, they provide only broad assumptions on the culture’s true state and offer limited insights into the process and cell growth.
On the other hand, critical process parameters (CPPs), such as glucose, lactate, or ammonium, and key performance indicators (KPIs), such as total cell density (TCD) and viable cell density (VCD), provide a direct indication of the culture’s content and state. These CPPs are typically measured offline and data is not available in real-time. The lack of real-time data and effective process control causes a reliance on daily manual sampling and feeding, increasing the risk of contamination and batch failures.
Using a Raman Process Analytical Technology (PAT) platform can help overcome these shortcomings in cell culture processes from process development to manufacturing.
In this application study, a Raman PAT platform was utilized to perform in-line and real-time measurement of TCD, VCD and the concentration of glucose, lactate, and ammonium in a bench-scale bioreactor.
Before exploring the study and its findings, it is helpful to review Raman technology and its role in bioprocessing.
The Raman Effect
The Raman effect is a non-linear process consisting of the exchange of energy between the optical wave and molecular vibration of a substance. For example, water (H2O) has three different molecular vibrations (bend, symmetric stretch, and asymmetric stretch) and one response of the molecular bond to excitation by a laser is the Raman signal. As the water molecule has three vibrations, there are three different Raman signals. A Raman spectrum is a graph of Raman signal intensity as a function of the Raman shifts. For a water molecule, each of the three Raman signals correspond to a peak in the water Raman spectrum. A Raman spectrum can be likened to a molecular fingerprint.
Raman in Bioprocessing
Raman technology is fully adapted for measurement in aqueous medium with no impact of water. It is non-destructive and can provide simultaneous, real-time monitoring of several process parameters and quality attributes including total cell density (TCD) and viable cell density (VCD) and concentration of glucose, lactate, ammonium, glutamine, amino acids and proteins. The resulting Raman spectra are a collection of molecular fingerprints analyzed with the use of multivariate analysis tools such as chemometric modeling. Chemometrics is used to build multivariate models of spectral variation and sample characteristics with off -line measurement in a calibration set.
Material and Methods
The platform utilized in this study is comprised of:
- A GMP-ready and UL-certifi ed IP65 with a small footprint analyzer
- Software that provides end-to-end functionalities for spectral acquisition, reference data association, spectral pre-processing, chemometric model building, and real-time monitoring. It also facilitates 21 CFR part 11 and EudraLex volume 4 annex 11 compliance to follow regulations set by the U.S. Food and Drug Administration and the European Union.
The feedback control loop was based on direct Open Platform Communications United Architecture (OPC UA) connectivity between the Raman PAT platform and the bioreactor control system. The culture was fed with a complete (or complex) feed containing glucose.
CHO-S cells were inoculated at 0.4x10⁶ cells/mL in CD-CHO medium with 8 mM glutamine, 1% of anticlumping agent and 0.5% of penicillin/streptomycin in a water-jacketed 3 L glass bioreactor. The cultivation conditions were set at 37°C, pH 7.0 and DO 40% regulated by sparging CO2 and 0.5 N NaOH for pH and a mix of air and O2for DO.
The cells were agitated with a pitched blade impeller at 80 rpm. The bioreactor was shielded with a lightproof cover to ensure that external light did not affect the Raman measurements.
The percentage represents the ratios of volume of complex feed (described earlier) per volume of culture: On day zero, 15 mL of feed was added for each 100 mL of culture. When glucose concentration dropped below 4 g/L, a highly concentrated glucose solution was added. Glutamine was added when the concentration dropped below 4 mM, and a constant glutamine feeding began on the third day. Samples were collected twice per day when no feed was performed. For each feed, a sample was taken before and after the feed in addition to the daily sample. All samples were taken in triplicate and each triplicate was analyzed with an automated analyzer for quantitation of TCD, VCD, glucose, lactate, and ammonium.
Raman Measurements
Raman measurements were performed using a Raman software. The optical probe was directly immersed into the bioreactor using a PG13.5 cable gland adaptor, as shown in Figure 1. Laser excitation and spectral data collection were controlled by the software using an Ethernet connection between the analyzer and the computer. Each Raman measurement was the result of an average of 20 spectra of 45 seconds (15 minutes of acquisition in total) and measurements were scheduled every 30 minutes.
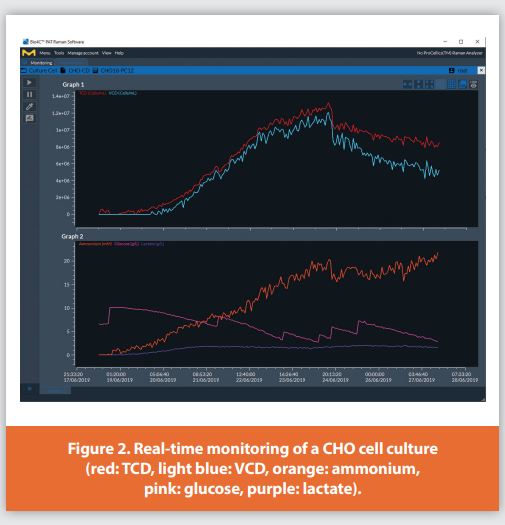
Offline data from three cell culture runs (a total of 76 points for all parameters and 73 for glucose) were automatically linked to their corresponding Raman spectra to generate a consistent dataset in the Raman software. The spectra were preprocessed by the software using Standard Normal Variate on the water region, Savitzky-Golay derivative with 5 points (15 cm-1, polynomial order 2 and a 1st derivative) and spectral selection (350 - 1,775 cm-1, + 2,800 - 3,000 cm-1) to create a calibration dataset. Using multivariate analytics modeling software, a partial least squares (PLS) model was built for each process parameter (TCD, VCD, glucose, lactate, and ammonium). Chemometric models were uploaded in the Raman software and used to perform in-line and real-time monitoring of process parameters for a new cell culture run from the acquired Raman spectra (Figure 2).
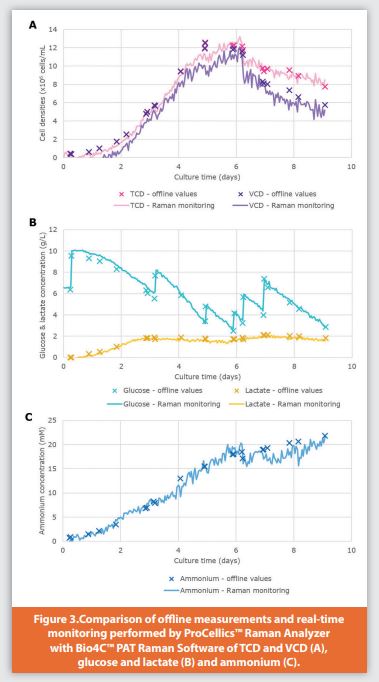
To assess the accuracy of Raman measurements compared with traditional offline sampling methods, samples were collected daily and analyzed. The root mean square error of prediction (RMSEP) and its percentage error were calculated for each parameter (Table 1).
For cell densities, real-time monitoring and offline values presented the same cell growth kinetics trend (Figure 3A). On the sixth day, the addition of a large volume of feed led to a cell dilution that was successfully monitored by the Raman platform. At the end of the culture, the total and viable cell densities were readily distinguished by Raman measurements and the analyzer enabled real-time tracking of the decrease of the cell viability. In this study, the total and viable cell densities were predicted in real time with an error of 5% and 10%, respectively (Table 1).
Real-time measurement errors are 4% for glucose, 8% for lactate and 7% for ammonium (Table 1). As shown in Figures 3B and 3C, real[1]time measurements are consistent with offline data throughout the duration of the culture. The Raman PAT platform accurately monitored all increases of glucose levels following the feeds.
Conclusion
By performing in-line and real-time measurement of CPPs and critical quality attributes (CQAs), this Raman PAT platform helps save time and provides flexibility to operators. The Raman PAT platform also helps to understand processes better and to collect digital data of processes by providing much more data than what is possible with offline sampling. Most importantly, the Raman PAT platform reduces the risk of contamination and batch failures, increasing process control and reproducibility, which may lead to yield and quality improvement. The Raman PAT platform also enables a nutrient control loop strategy, the first step towards automation to prepare the facility of the future and allow bioprocessing 4.0.
About the Author
Merrilee Whitney holds degrees in International Relations and Chemical Engineering from Bucknell University. Her career has included work with Xerox, Ionics and Koch Membrane Systems. In 2006, Merrilee joined MilliporeSigma as Product Manager for the Millistak+® line, and has since managed other product lines in clarification, aseptic, virus filtration, and Single Use & Systems. As head of the BioContinuum™ Platform, Merrilee drives strategy execution of Process Intensification Technologies, Software & Automation, and Analytics.
Subscribe to our e-Newsletters
Stay up to date with the latest news, articles, and events. Plus, get special offers
from American Pharmaceutical Review – all delivered right to your inbox! Sign up now!