Introduction
Substandard and counterfeit medicines remain an urgent problem for not only developing countries but also countries with well-established rigid regulatory systems for the pharmaceutical market1-2. The development of rapid and non-invasive spectroscopic technologies using Raman and Near Infrared (NIR) has become an effective way to combat such substandard and counterfeit medicines.
Over the past few years, rapid drug quality control has been implemented in the Russian Federation and NIR spectroscopy3-4 has been widely adopted for the field testing. However, NIR is not suitable for the quantitative analysis of injectable drug products due to the liquid dosage form of certain samples, particularly highly diluted aqueous solutions. In comparison to NIR, Raman is also a highly sensitive and selective spectroscopic technology, but cannot be interfered with water. Therefore, Raman has been explored in this study for injectable drug products.
A large volume of various quantitative analytical methods using Raman has been published in recent years5-7,10. However, many publications are not suitable for rapid, robust and accurate testing for the regulatory agency in the field, rather in the traditional laboratory. In particular, many high sensitivity methods based on multivariate calibration (e.g., Partial Least Squares) require complex precision calibration for the spectrometer’s optical components. Yu Zhao, Nan Ji and others13 proposed in their publication to use the Classical Least Squares (CLS) for quantitative analysis along with the Principal Component Analysis (PCA) to eliminate the interference from glass containers if the Raman spectrometer’s excitation wavelength is 785 nm. A novel way of using Raman is necessary for injectable drug product testing in the field.
In this study, a Raman analyzer with the excitation wavelength at 532 nm is adopted to reduce the interference from glass containers and drug product packaging materials. In addition, a Raman analyzer at 532 nm can take advantage of the water signal around 3200 cm-1 and use it as an internal standard for quantitative analysis. In this study, the linear regression model was explored, which shows a low level of relative error, robustness and high selectivity. The authors further provide a simplified version of the quantitative assessment of the active pharmaceutical ingredients, which greatly reduces the quantitative computation.
During the measurements, the fluorescence background was present in a number of manufacturer sample solutions. The Difference of Gaussians filter (DoG) was applied as a preprocessing method for baseline removal. The results were compared to traditionally used Savitzky-Golay first derivative filter. X-axis Raman shift correction was performed as well.
The most commonly used injectable drug products in the domestic Russian Federation market, such as, Lidocaine, Thiamine, Dritaverine and Ascorbic Acid, are chosen for this study. Calibration and control sample solutions were prepared using reference materials. All calculations were performed using R computing language.
Experimental
Materials
Thiamine Hydrochloride (HCl) Reference Standard (RS) (Lot Number: P0K366) and Ascorbic Acid Reference Standard (Lot Number: R1K253) were provided by the United States Pharmacopeial Convention (USP). The drug products of Ascorbic Acid, Thiamine, Drotaverin and Lidocain (from three different manufacturers) were provided by Roszdravnadzor (Russian Federation Drug Administration). The drug product samples were previously tested using traditional compendial methods.
Excipient samples for this study were acquired from a known supplier. The corresponding calibration sample solutions were prepared for this study based on the known formulations of domestically registered drug products approved by Roszdravnadzor.
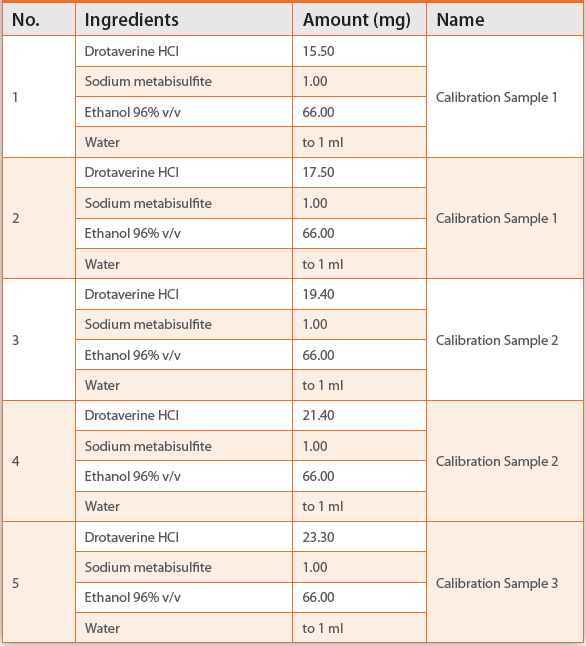
The formulations of Ascorbic Acid drug product samples are shown in Table 1, while Table 2 displays the formulation of Ascorbic Acid calibration samples. The formulations of Lidocain drug product samples are shown in Table 3, while Table 4 displays the formulation of Lidocain calibration samples. The formulations of Thiamine drug product samples are shown in Table 5, while Table 6 displays the formulation of Thiamine calibration samples. The formulations of Drotaverin drug product samples are shown in Table 7, while Table 8 displays the formulation of Drotaverin calibration samples.
Table 1. Ascorbic Acid Drug Product Sample Information
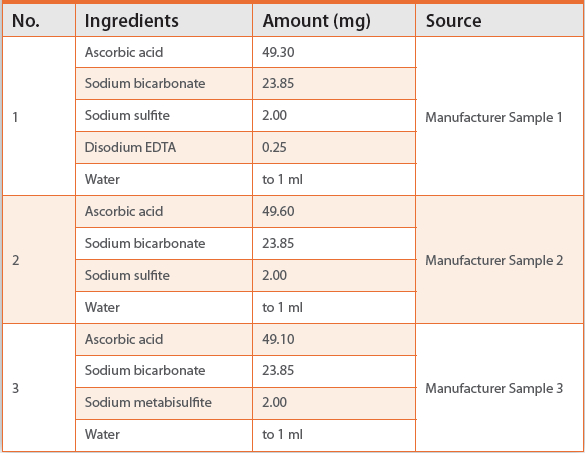
Table 2. Ascorbic Acid Calibration Sample Information
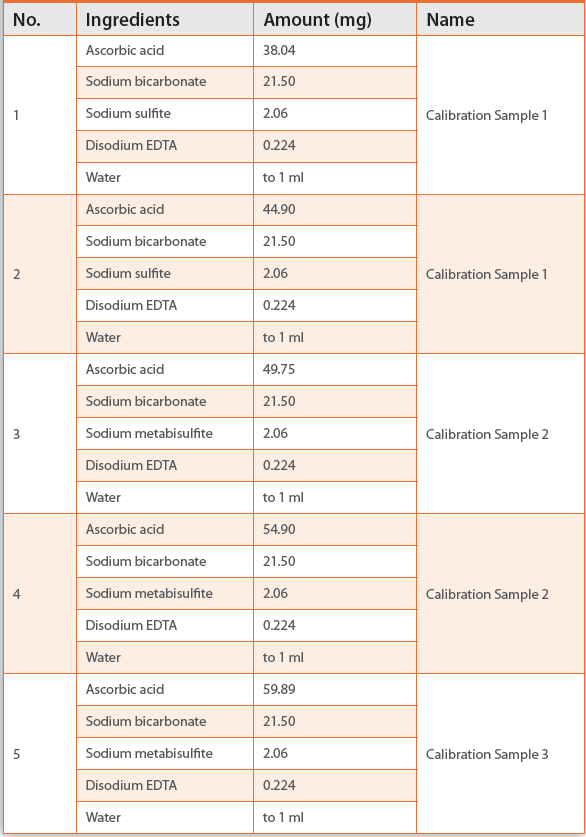
Table 3. Lidocaine Drug Products Sample Information
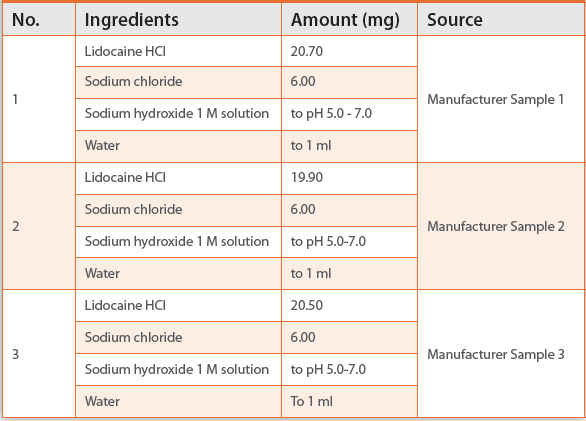
Table 4. Lidocaine Calibration Sample Information
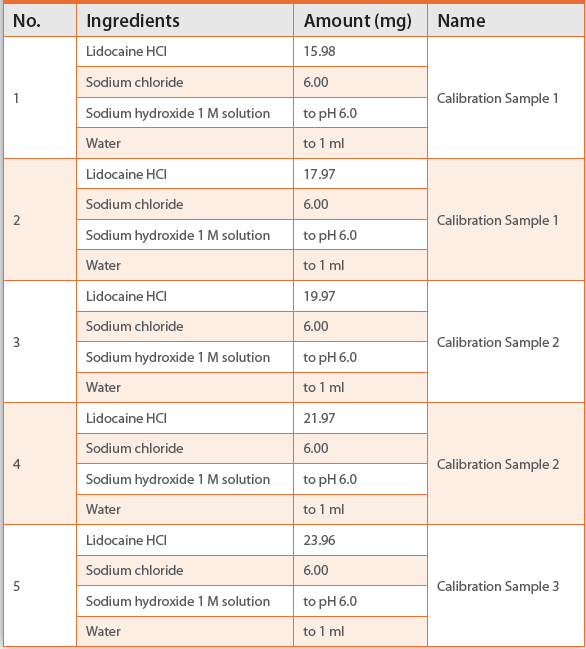
Table 5. Thiamine Drug Product Sample Information
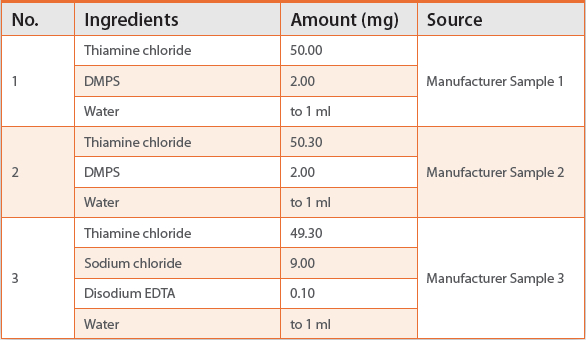
Table 6. Thiamine Calibration Sample Information
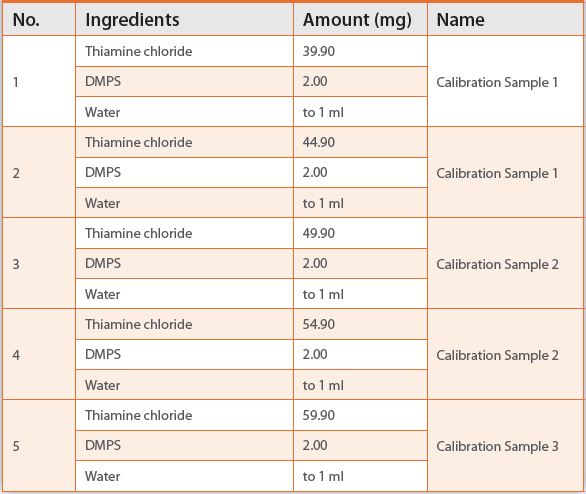
Table 7. Drotaverine Drug Product Sample Information

Table 8. Drotaverine Calibration Sample Information
Instrumentation
A wideband Raman analyzer was used in this study. The excitation wavelength is at 532 nm and the spectrometer’s wavelength range is 175 - 4000 cm-1.
Methods
Linear Regression Model
In general, water injection solutions consist of the following components: active pharmaceutical ingredient (API), excipients and water. Since the correlation between the spectra of API and water is close to zero, we can use a linear regression model: Equation (1) to describe the spectrum of a solution, Smix:
Smix=a0+a1 * S(API) + a2 * S(water)+ ε (1)
Where S(API) is the spectrum of API, S(water) is the combination spectrum of water and excipients, ε is the residual error, a0 is the correction coefficient.
When the fluorescence is absent or consistent during the measurement by Raman, this linear regression model can be used to evaluate concentrations of components. While the fluorescence is significant in the background, spectrum preprocessing (spectrum smoothing and derivative spectrum) is necessary to reduce the fluorescence interference. The same linear regression model fits while a derivative spectrum is used. The ratios of a1 and a2 coefficients allows to create such calibration curve using three points at 80%, 100% and 120% from nominal concentrations of API in tested samples. If the correlation between water (excipients) and API is significant, more data points are required to create an effective calibration curve.
Rapid Quantitation Model
The rapid quantitation model is established based on the assumption that Sa and Ss are constants (the spectrum of API in water solution expressed as Sa and the spectrum of water (including excipients) expressed as Ss). Equations (2) - (7) express the rapid quantitation model under different conditions. Then the spectrum of a water solution (Smix) with the concentration C can be described by the following equation:
Smix =Ss+C*Sa (2)
For two calibration solutions of known concentrations C1 and C2:
Smix1=Ss+C1*Sa (3)
Smix2=Ss+C2*Sa (4)
From these two equations, we can find S_s and S_a:
Sa=(Smix1-Smix2)/(C1- C2) (5)
Ss=0.5*(Smix1+Smix2-(C1+C2)*Sm) (6)
Therefore, any unknown solution with concentration Cx can be calculated by the following equation:
Cx=(Scx-Ss)/Sa (7)
Data Preprocessing
Gaussian Filter
The Gaussian filter is a low frequency (low pass) method. It can transmit a smoothing spectrum with significant fluorescence interference and reduce the peak intensity. The application of a Gaussian filter can generate the difference of spectra with different Raman dispersion. Therefore, the difference of the smoothed spectra will not be influenced by the baseline, only by the peak intensity.
If the dispersion has significant difference, the Gaussian filter can increase the Signal/Noise (S/N) ratio, especially if the fluorescence has strong presence.
The Gaussian filter is usually used as an approximation filter Laplacian of Gaussian (LoG) to search for boundaries, but for this study, the Gaussian filter properties are key factors, and σ = 5 and σ = 50 wave number are adopted. Figure 1 shows the original Raman Spectrum of Drotaverine Manufacturer Sample 2 and Figure 2 shows the Raman Spectrum of Drotaverine Manufacturer Sample 2 after preprocessing of the Gaussian filter.
 Figure 1. Original Raman Spectrum of Drotaverine Manufacturer Sample 2
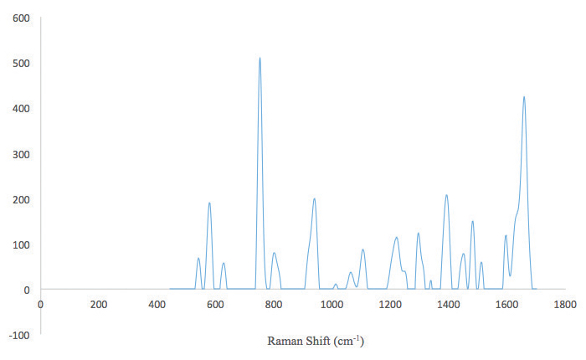 Figure 2. Preprocessed Spectrum of Drotaverine Manufacturer Sample 2
Water Normalization
It is well known that the optical path geometry, laser power, concentration of Raman-active ingredients and their scatter coefficients will determine the absolute Raman spectrum intensity. The Raman signal of water near 3200 cm-1 is used as an internal standard with the assumption that the peak area of water is constant while others are negligible. Normalization was performed with the water peak area considered to be one.
Raman Shift Correction
The major challenge for quantitative analysis of API using Raman is the Raman shift on the X-axis of wavenumber.
If we consider the spectrum as a function of the wavenumber S(WN), a simple Raman shift can be expressed as S(WN+ΔWN), wherein ΔWN is a constant. Therefore, as the evaluation of ΔWN can be used such value of delta, which provides the maximum correlation S(WN+Δ), S0), where S0 is the reference spectrum. More complex Raman shift can be expressed as S(WN + ΔWN(WN)), where the function ΔWN(WN) reflects a shift change at different positions on the X-axis of wavenumber. The value of the function ΔWN(WN) is calculated for each individual section on X-axis of wavenumber (using local windows) where the correlation Cor_Window (S(WN + Δi), S0) is high due to the presence of the peaks, and the size of the window allows to consider a shift in this window approximately constant. The shift values are interpolated to full X-axis scale using smooth function. Figure 3 shows the Raman spectrum before and after the Raman shift correction.
 Figure 3. Raman Shift Correction Comparison
Results and Discussion
Raman spectrometers with excitation wavelengths of 785 nm have been widely used by analytical scientists though it has relatively narrow spectral range. Instead, in this study, a non-invasive wideband Raman analyzer with excitation wavelength at 532 nm using water signal near 3200 cm-1 as internal standards shows great potential for quantitative analysis of injectable drug products.
Calibration samples were prepared for this study. The formulations of excipients in the calibration samples were established according to the formulations of the most commonly used drug products in the pharmaceutical market of Russian Federation. Most excipients used in this study do not contribute significantly to the resulting Raman spectra of the test samples, but may affect the API spectra as pH-regulators, or providing the desired level of solubility of API in an aqueous medium. The calibration samples have five different solutions with concentrations of 80%, 90%, 100%, 110% and 120% of API. Three calibration solutions were prepared to generate a calibration curve (80%, 100% and 120%) while two remaining calibration solutions (90% and 110%) were used as control samples.
All spectra were measured in a 10 cm quartz cuvette using a cuvette sample holder with collimated optics. Integration time for Ascorbic Acid, Drotaverine and Thiamine samples was 7.5 seconds, while 5 seconds for Lidocaine. Laser power was adjusted with the maximum of 50 mW. Total 25 spectra were acquired for all samples on an average 25 scans per spectrum.
The relative error was calculated as the ratio of the predicted concentration versus the actual concentration. The uncertainty of the actual concentration specified for the control samples is significantly lower than those for manufacturer solutions, where the concentration was obtained using compendial methods, e.g., titration, UV/Vis spectroscopy and HPLC. Parameters such as difference in the pH values of calibration and manufacturer samples, excipients composition and impurities profile also significantly reflect on relative error value.
Linear Regression
The average linear regression result for control samples among all samples is 1.2%. This result is expected since the formulations of calibration and control samples are the same.
The application of DoG filter reduces the relative error for control samples to a certain degree, but not significant enough for manufacturer samples with weak or medium fluorescence background. The application of a Gaussian filter for such samples can extract more useful information than SG derivative. If strong fluorescence background exists, API and water peaks would be interfered so much that none of the data preprocessing methods described in this study works well.
The main advantage of using an internal standard is to reduce the variabilities caused by different spectra acquisition parameters. In addition, using water as an internal standard has much wider linearity range, which is confirmed by the low level of relative error for concentrated solutions: Control Samples 3 for Lidocaine, Thiamine and Drotaverine.
Manufacturer samples of Ascorbic Acid do not have strong fluorescence background but relatively high S/N ratio. All spectra preprocessing techniques provide good results while DoG and DoG with water normalization show better results, as shown in Table 9.
Table 9. Ascorbic Acid Quantitative Analysis Results via Linear Regression
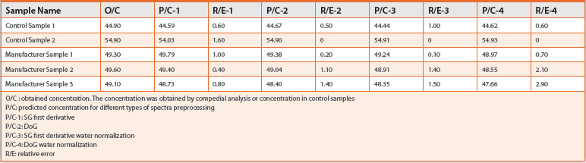
Table 10. Lidocaine Quantitative Analysis Results via Linear Regression

Highly diluted aqueous solutions shall exhibit a much less photobleaching effect compared to solid samples. Lidocaine, Thiamine and Drotaverine manufacturer samples only demonstrate reduced fluorescence background. This might be the impurities present in these solutions, while the calibration sample solutions of Lidocaine, Thiamine were prepared using reference materials. Depending on the nature and amount of potential impurities, observed fluorescent background subsided to 25 of 25 parallel spectra or remained stable throughout the experiment.
A photobleaching effect was observed in Lidocaine Manufacturer Sample 2, Thiamine Manufacturer Sample 3 (Figure 4) and Drotaverine Manufacturer Sample 2.
 Figure 4. Thiamine Manufacturer Sample 3 Raw Spectrum
Since the photobleaching effect causes asymmetrical spectral change during parallel measurements, water normalization thus can lead to an expected higher level of relative error. Error value for such spectra decreases as the intensity of the background for 25 spectra gets closer to the results obtained without the use of normalization (Figure 5).
 Figure 5. Dependence of the Relative Error Ratio from the Number of Spectra in Parallel Measurements
DoG filter is an effective tool when the fluorescence background is not strong. The result of applying the DoG filter is a difference of two results after low pass filters. Such filters pass signals at low frequency, not high frequency signals. In this study, the signal from fluorescence has very low frequency and will pass through the filter without attenuation. Thus, one of the filters (with higher dispersion) almost does not pass the peaks, and the second - only slightly attenuate and blurs them. Therefore, the DoG filter will generate the difference that does not contain peaks without baseline. The Drotaverine Manufacturer Sample 2 demonstrates medium intensity fluorescence background. Aftern applying DoG filter, the relative error was significantly reduced and the processed spectrum is consistent with the calibration sample 2 spectrum (shown in Table 12 and Figures 6-7).
Table 11. Thiamine Quantitative Analysis Results via Linear Regression
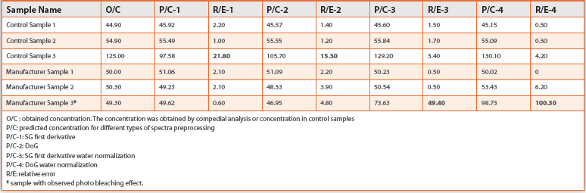
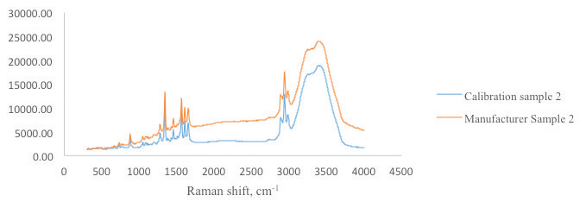 Figure 6. Drotaverine Manufacturer Sample 2 and Calibration Sample 2 Raw Spectra
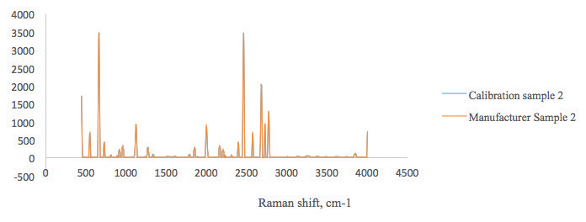 Figure 7. DoG Preprocessed Drotaverine Manufacturer Sample 2 and Calibration Sample 2 Spectra
Drotaverine manufacturer Sample 3 demonstrates the difference in spectra compared to calibration sample solutions. The difference becomes more significant after DoG preprocessing, which generates much worse prediction results (shown in Table 12 and Figures 8-9). The reason could be that manufacturers used different excipients or different impurities. The pH of manufacturer sample 3 matches the pH level of calibration solutions, so the pH cannot be the source of these differences. Further investigation is needed.
Table 12. Drotaverine Quantitative Analysis Results via Linear Regression
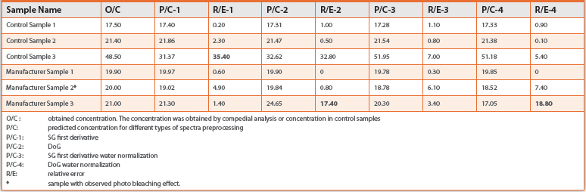
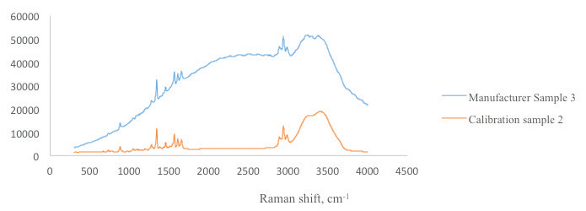 Figure 8. Drotaverine Manufacturer Sample 3 and Calibration Sample 2 Spectra
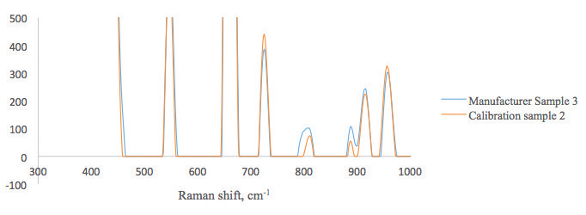 Figure 9. DoG Preprocessed Drotaverine Manufacturer Sample 3 and Calibration Sample 2 Spectra
Rapid Quantitative Model
The rapid quantitative model is a special case of the linear regression, with the assumption that the solvent and API spectra are constant and the excipient formulation (including impurities etc.) does not generate significant effect for Equation 7. Therefore, the major factors in this model are the smoothing method, Raman shift consistency and instrument parameter stability.
Three calibration sample solutions were prepared for Ss and Sa calculations (Equations 5 and 6). The calculated mean values of Ss and Sa were used for determination of the API concentration in control and manufacturer samples. Savitzky-Golay first derivative with 11 point smoothing and DoG filters were applied to raw spectra. Raman shift correction procedure was applied on each spectrum. Water normalization was not performed.
As shown in Tables 13 – 17, the rapid quantitation method with Gaussian filter gives a low value of relative error, though SG first derivative preprocessing method dramatically impairs results. It might be 11 point smoothing parameter was not suitable for SG filter.
Table 13. Ascorbic Acid Rapid Quantitative Model

Table 14. Lidocaine Rapid Quantitative Model
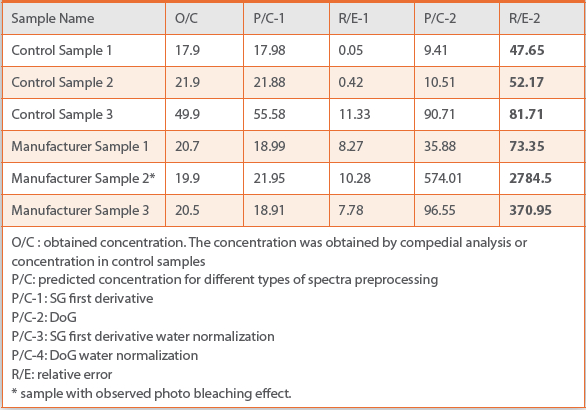
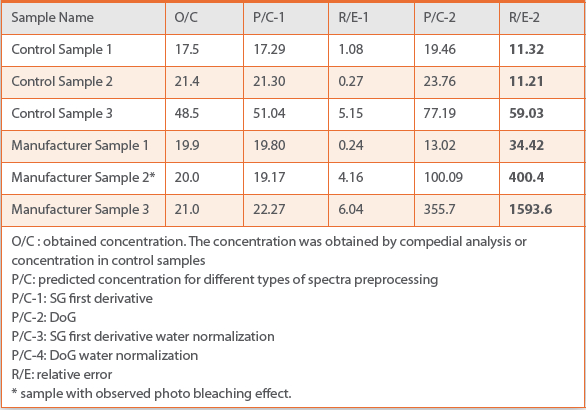
Table 15. Thiamine Rapid Quantitative Model
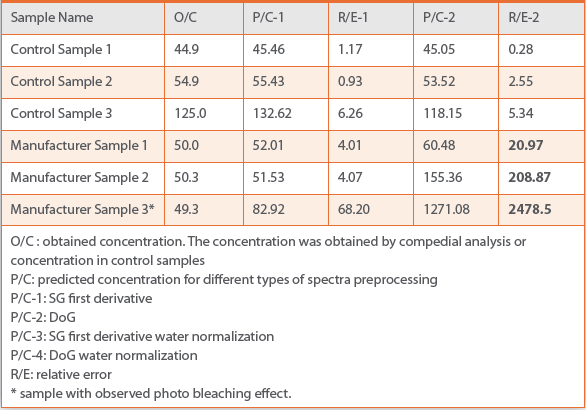
Table 16. Drotaverine Rapid Quantitative Model
As expected, samples with strong fluorescence background generate much higher level of relative error. The DoG filter can reduce its interference on baseline, but cannot eliminate it.
Lower relative error for concentrated samples (Control Sample 3 for Lidocaine, Drotaverine and Thiamine) indicates a large range of linearity of this method even no water normalization is applied.
Conclusions
Different methods of linear regression for quantitative analysis of API in injectable drug products were explored in this study. The rapid quantitation model in combination with DoG filter demonstrates strong potential since very little offline data modeling is needed with a wide range of linearity. Gaussian filter is an effective data preprocessing tool for baseline removal and strong fluorescence reduction. This method can also be applied in qualitative analysis using Raman spectroscopy. The water normalization method delivers more accurate quantitative assessment and can be independent from the various parameters during the spectra acquisition.
Acknowledgements
To Russian Federal State Institution “Information and Methodical Center on Expertise, Accounting and Analysis of Medical Products Circulation” and its management team: Kareteev A.V. and Minnikeeva K.A. for their overall support.
References
- Cockburn R, Newton PN, Agyarko EK, Akunyili D, White NJ. The Global Threat of Counterfeit Drugs: Why Industry and Governments Must Communicate the Dangers. PLoS Med 2005; 2: e100.
- Wondemagegnehu E. Counterfeit and Substandard Drugs in Myanmar and Viet Nam. WHO Report. WHO/EDM/QSM/99.3. Geneva: WHO, 1999.
- O.Ye. Rodionova, K.S. Balyklova, A.V. Titova, A.L. Pomerantsev. Quantitative Risk Assessment in Classification of Drugs with Identical API Content. J. Pharm. Biomed. Anal. 98, 186-192 (2014)
- O.Ye. Rodionova, A.L. Pomerantsev. NIR-based Approach to Counterfeit Drug Detection. Trends in Analytical Chemistry, Vol. 29, No. 8, 795 – 803 (2010)
- Ryder, A.G., O’Connor, G.M., Glynn, T.J. (2000). Quantitative Analysis of Cocaine in Solid Mixtures Using Raman Spectroscopy and Chemometric Methods. Journal Of Raman Spectroscopy, 31 (3):221-227.
- Evangelia Dimitrokalli, Malvina Orkoula, Christos Kontoyannis. Identification and Quantitative Analysis of Warfarin Forms in Oral Suspension Using Raman Spectroscopy. 10ο ΠΑΝΕΛΛΗΝΙΟ ΕΠΙΣΤΗΜΟΝΙΚΟ ΣΥΝΕΔΡΙΟ ΧΗΜΙΚΗΣ ΜΗΧΑΝΙΚΗΣ, ΠΑΤΡΑ, 4-6 ΙΟΥΝΙΟΥ, 2015
- E. Foldes, Z. Szabo et al. Quantitative Analysis of Functional Groups in HDPE Powder by DRIFTS Spectroscopy. Macromol. Symp. 202, (2003), p. 97-105.
- B. Walczak ‘, E. Bouveresse, D.L. Massart. Standardization of Near-infrared Spectra in the Wavelet Domain. Chemomenics and Intelligent Laboratory Systems 36 (1997) 41-51.
- Yongdong Wang, David J. Veltkamp, and Bruce R. Kowalski. Multivariate Instrument Standardization. Ami. Chem. IOSI, 63, 2750-2756.
- Tomonobu Uchino*1, 2, Yoshitsugu Yanagihara2 and Hiroshi Suzuki2. Nondestructive Inspection of the Components in the Admixed Injectable Drugs by Raman Spectroscopy. 医療薬学, 37(10) 599– 605 (2011)
- Xinbo Liu, Zhimin Zhang, Pedro F. M. Sousa, Chen Chen, Meilan Ouyang, Yangchao Wei,,Yizeng Liang,,Yong Chen, Chaoping Zhang. Selective Iteratively Reweighted Quantile Regression for Baseline Correction. Anal Bioanal Chem DOI 10.1007/s00216-013-7610-x.
- Zhang ZM, Liang YZ (2012). Comments on the Baseline Removal Method Based on Quantile Regression and Comparison of Several Methods. Chromatographia 75 (5–6):313–314.
- Yu Zhao, Nan Ji, Lihui Yin, and Jun Wang. A Non-invasive Method for the Determination of Liquid Injectables by Raman Spectroscopy. AAPS PharmSciTech (# 2015)
- A Practical Guide for the Determination of Binding Constants, Journal of Inclusion Phenomena and Macrocyclic Chemistry 39: 193–209, 2001.
- Connie M. Gryniewicz-Ruzicka, Jason D. Rodriguez, Sergey Arzhantsev, Lucinda F. Buhse, John F. Kauffman. Libraries, Classifiers, and Quantifiers: A Comparison of Chemometric Methods for the Analysis of Raman Spectra of Contaminated Pharmaceutical Materials. Journal of Pharmaceutical and Biomedical Analysis 61 (2012) 191– 198.
- Jason D. Rodriguez, Benjamin J. Westenberger, Lucinda F. Buhse and John F. Kauffman. Standardization of Raman Spectra for Transfer of Spectral Libraries across Different Instruments, Analyst, 2011, 136, 4232.