Abstract
N-linked glycosylation is one of the critical to quality attributes (CQAs) for biotherapeutics impacting the safety and activity of drug products as well as being indicative of the consistency in production process. Changes in the pattern and level of glycosylation can significantly alter a biotherapeutic's intrinsic properties and stability therefore it has to be monitored. For consistent and unbiased N-glycan profiling it has to be ensured that deglycosylation is complete. For quantification of percent deglycosylation methods such as reduced liquid chromatography– mass spectrometry (LC-MS) and reduced capillary gel electrophoresis (CGE), are commonly used. Here we have evaluated a novel 3-step manual and automated N-glycan sample preparation workflow, the Applied Biosystems™ GlycanAssure™ HyPerformance APTS kit, in manual and automated formats with the AutoMate Express™ platform. Evaluation of a 10-min optimized deglycosylation module of this workflow with a proprietary denaturant on reduced Sodium dodecyl sulphate-polyacrylamide gel electrophoresis (SDS-PAGE) with offline software shows complete deglycosylation of the complex glycoprotein Fetuin. Additionally, the magnetic bead-based clean up module of this workflow preserves sialylated glycans and provides an unbiased high recovery profile. Manual sample preparation takes < 1.5hr with < 30 min hands-on time. N-Glycan profiling results of automated and manual sample preparations are highly comparable. Analysis of NISTmAb after preparation with this workflow (by hydrophilic interaction liquid chromatography (HILIC) column and ultra-high performance LC (UHPLC) equipped with a fluorescence detector (FLD)), revealed 37 well-resolved peaks. Excellent sample preparation repeatability with RSD of <5 % was found for peaks>0.5 % relative area while obtaining great FLD sensitivity and a limit of quantitation (LOQ) of 0.1 % relative area. One of the advantages of this workflow is flexibility of the analytical platform, allowing high throughput, high quality sample preparation and analysis of 96 samples with a time to results of 5.4 hours when analyzed on the Applied Biosystems™ CE3500xL Genetic Analyzer (multi-capillary electrophoresis (CE) system).
Introduction
Separate from most post-translational modifications (PTMs), glycosylation is the enzymatic addition of different carbohydrate molecules in different structures to the peptide backbone of a protein. Glycosylation plays a crucial role in regulating or indicating key biological processes such as cell-cell signaling and protein folding.1,2 Changes in N-linked glycosylation can influence glycoprotein stability, serum half-life, efficacy (potency of glycoprotein), trigger immunogenicity and/or impact antibody ligand binding.3-6 The majority of top selling FDA approved biotherapeutics are monoclonal antibodies (mAbs) carrying N-linked oligosaccharides that play a key role in their efficacy such as binding affinity, antibody-dependent cell-mediated cytotoxicity (ADCC) and complement-dependent cytotoxicity (CDC). Process parameters, changes during production from media components, fermentation temperature, cell line, etc. can all impact the glycosylation state of biotherapeutics with safety consequences. Therefore monitoring the consistency of CQAs, including N-glycosylation, during process development and optimization, process performance qualification and commercial lot production is crucial.7-10
The most common class of N-glycans attached to mAbs is the complex, bi-antennary type, but all classes have been detected to some degree.11 Fully humanized mAbs contain typical N-linked glycan populations which are mainly asialylated and core fucosylated, bi-antennary glycans containing 0, 1 and 2 terminal galactose and some level of high mannose and hybrid glycans with sialylated glycans at low abundance in recombinant IgG1 and IgG2.12 Typically N-glycans are released from proteins by action of chemicals or enzymes (e.g. Peptide:N-glycosidase F (PNGase-F)) which selectively cleave nonfucosylated and α-[1-6]-core-fucosylated N-glycans between asparagine and the innermost N-Acetylglucosamine (GlcNAc) of oligosaccharides. Enzymatic release typically involves a long incubation time, of 10-24 h at 37⁰C. Upon release, the glycans are usually separated from the protein backbone by chromatographic methods (e.g. solid phase extraction) such as reversed phase, ion exchange, normal phase or non-chromatographic methods such as ultrafiltration, precipitation (with cold ethanol) or magnetic beads.13 Purified glycans are then commonly vacuum dried for 2-4 hours and derivatized with different fluorescence labeling dyes to enhance sensitivity for analysis with LC.14-16 In summary, traditional N-glycan profiling sample preparation takes 1-3 days and is a very time consuming and labor intensive assay.
N-Glycan Analytical Requirements
With the high number of samples that the modern pharmaceutical laboratory has to handle for pipeline drug products it is much needed that both sample preparation and analytical time are shortened without compromising data quality and flexibility of analytical approach. To assess the possibility of meeting these requirements, we have evaluated a new workflow in the market, centered on the Applied Biosystems™ GlycanAssure™ HyPerformance APTS kit. This kit was deemed able to meet the aforementioned criteria with a 3-step workflow (Figure. 1) which offers the following features:
 Figure 1. GlycanAssure™ Hyperformance workflow
Manual Workflow
- Streamlined 3-step workflow
- Complete deglycosylation in 10 min using a novel proprietary denaturant
- No need for glycan purification prior to dye labeling
- High recovery and repeatable magnetic bead based clean-up module for free dye removal
- Total sample preparation time of <1.5 hours with hands-on time of <30 min
- 96-well sample preparation capability in <2.5 hours
- No vacuum drying necessary
Automated Workflow
- Automation platform fully automated for the 3 steps of the N-glycan sample preparation
- Uses aforementioned manual workflow reagents in prefilled cartridges
- Sample preparation time of 1 hr and 45 min for 13 samples
- Hands-on time of 5 min
- Results are highly comparable to manual workflow
Analytical platform
Characterization: Thermo Scientific™ Vanquish™ Horizon or Flex UHPLC system with Thermo Scientific™ Accucore™ 150 Amide HILIC LC column
- High pressure mixing binary pump for lowest gradient delay volume and most precise gradient condition
- Smart-Inject technology for improved retention time precision and peak assignments
High throughput screening: Applied Biosystems™ CE3500xL Genetic Analyzer (multi-capillary electrophoresis (CE) system)
- Pre-assembled 24-capillary array
- Prefilled electrolyte buffers and separation polymer pouches
- 2 x 96-well plate capacity
- Laser induced fluorescence (LIF) detector
- N-glycan data acquisition and analysis software
- Separation time of 45 min per run for simultaneous analysis of 24 samples
- 2 min per sample analysis
- Time to results of 96 samples in 5.4 hours
Efficient and Effective Deglycosylation
Due to the high importance of unbiased N-glycan profiling, it is crucial to evaluate and understand if rapid deglycosylation methods can achieve complete deglycosylation for the most complex glycoproteins with high sialylation and multiple glycosylation sites. Methods such as reduced CGE and LC-MS have commonly been used for quantitative evaluation of percent deglycosylagtion.13,14 In the reduced CGE method mAb heavy chains (HC) and light chains (LC) migrate separately and the ratio of peak area of deglycosylated HC relative to the total area of glycosylated HC plus deglycosylated HC is measured as the percentage of deglycosylation.
The extent of N-glycosylation sites were determined and shown previously by Prien et al., 2015 by LC-MS tryptic peptide mapping followed by deglycosylation with PNGase-F12. The percent occupancy of N-glycosylation site was determined from absolute peak areas of extracted ion chromatograms for the glycosylated and aglycosylated peptides.
Calculation with this method assumes that ionization efficiency of glycosylated and aglycosylated species are equal, while in practice the ionization efficiency is likely to be higher in aglycosylated peptides (which contain asparagine residues) than deglycosylated peptides (containing aspartic acid residues). Therefore the proportion of aglycosylated peptide is slightly overestimated.13 Despite this, the results of % deglycosylation by LC-MS have shown to match closely to the levels estimated with CESDS.13
Here we have evaluated the quality of rapid deglycosylation in the new GlycanAssure™ HyPerformance kit (Cat# A33953 and A33952) on a complex standard glycoprotein, Bovine Fetuin (QAbio, P/N# GCP 500 µg, lot# B1B2-04) with multiple glycosylation sites carrying up to penta-sialylated glycans. In brief, in each 1.5 mL tube 13.3 µL of HPLC water, 5 µL of glycoprotein (10 mg/mL), 6 µL of denaturant and 1.2 µL of denaturation buffer were added and the contents were pipette mixed and heated in a thermomixer for 5 min at 80°C. Tubes were cooled for 2 min, 3 µL of digestion buffer and 1.5 µL of PNGase-F were added, pipette mixed and incubated at 50°C in incubator for 1, 3, 5, 8 and 10 min. For the negative control, 5 µL of glycoprotein, 22 µL of HPLC water and 3 µL of digestion buffer were mixed in a tube (not heated). Immediately after treatment, 1 µL of samples were prepared for SDS-PAGE ((NuPAGE® Bis-Tris Mini Gels (Cat#IM-8042), Simply blue™ Safe stain from Novex by Life Technologies (Cat#LC6065), MOPS SDS running buffer (P/N# NP0001), NuPAGE® LDS sample buffer (4X) (Cat# NP0008)).
As can be observed in Figure 2 (a), on the gel image, upper bands with higher molecular weight represent the glycosylated protein and lower bands with lower molecular weight represent the deglycosylated protein. Upon conversion of gel pixels volume to peaks, the glycosylated protein is represented in the lefthand peak and the deglycosylated protein is represented in the right-hand peak.
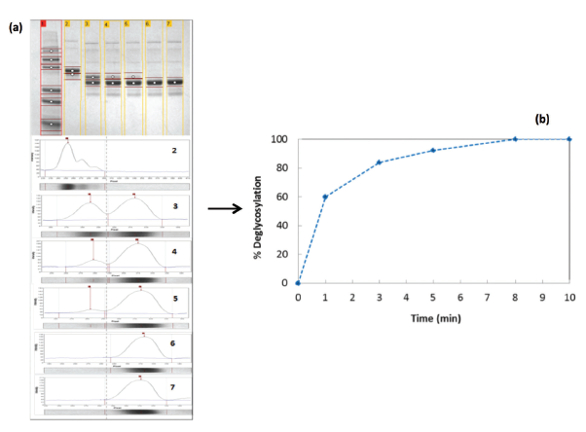 Figure 2. Percent deglycosylation of bovine fetuin prepared with the GlycanAssure™ HyPerformance kit workflow over a 10 min time course. From left to right, numbers represent: 1 (Marker ladder), 2 (Non-treated protein), 3 (deglycosylated, 1 min), 4 (deglycosylated, 3 min), 5 (deglycosylated, 5 min), 6 (deglycosylated, 8 min), 7 (deglycosylated, 10 min (a); Percent deglycosylation calculated from ratio of deglycosylated peak to sum of glycosylated and deglycosylated peaks derived from pixel volume in each band (peak) (b)
Each sample was subjected to 5 min denaturation at 80°C with a proprietary denaturant provided in the GlycanAssure™ HyPerformance APTS kit. Samples were taken at various timepoints during subsequent deglycosylation with prepared PNGase-F (Figure 2 (b)). After 1 min incubation with PNGase-F, 60 % deglycosylation is evident, after 3 min 84 % deglycosylation, after 5 min 92 % deglycosylation and after 8 min 100 % deglycosylation was obtained, thus eliminating the need for lengthy or overnight incubations.
Unbiased Glycan Cleanup
The GlycanAssure™ HyPerformance APTS kit workflow includes a magnetic bead-based cleanup step to remove any free labeling dye and other impurities from the labeled glycans, using 1 µm ferri magnetic beads and a DynaMag™-2 magnetic stand (cat#12321D, Thermo Fisher Scientific) with capability of high throughput vortexing and separations. A set of cleaned up and not cleaned up labeled N-glycans from Invitrogen human IgG were compared on UHPLC. As shown in Figure 3 a, b, >98 % of sialylated and neutral glycans were preserved with this clean up module, while effectively removing excess free dye.
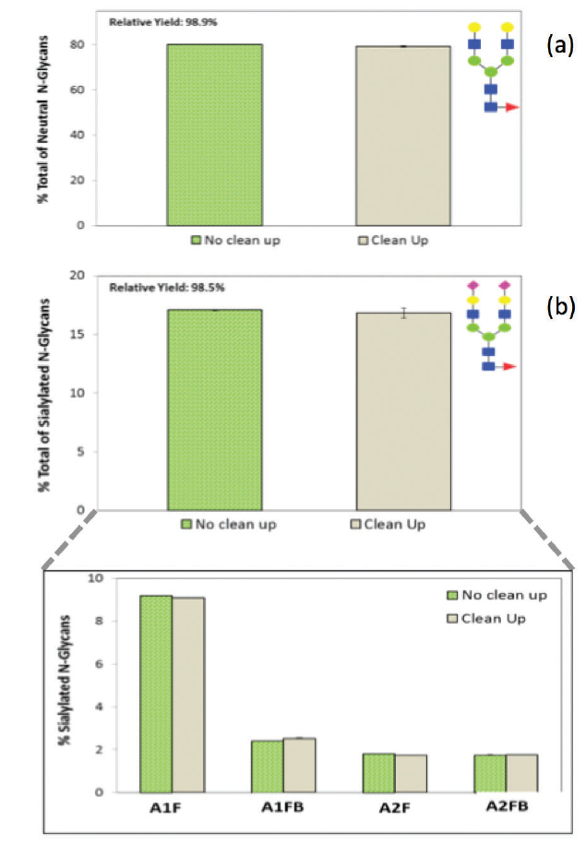 Figure 3. Evaluation of the magnetic bead-based clean up in the GlycanAssure™ HyPerformance kit. Comparison of relative area of a sample neutral glycan (G2F) (a) and charged glycan (A2F) (b) between cleaned up and not cleaned up labeled released N-glycans.
Resolving and Detecting Glycans
To evaluate the derivatized N-glycan profile from NISTmAb (#8671 (lot# 14HB-D-001), the GlycanAssure™ HyPerformance kit was used for the entire sample preparation. In brief, for 50 µg protein input, 5µL of NIST mAbs at 10 mg/mL in 13.3 ul of HPLC water were denatured for 5 min at 80°C (with 6 ul of denaturant and 1.2 ul of denaturant buffer) followed by deglycosylation with 3 µL of digestion buffer and 1.5 µL PNGase-F for 10 min incubation at 50°C (in oven). Released N-glycans were then directly labeled (no prior purification) with 10 µL APTS reagent mix and 2 µL reductant along with the dextran ladder (incubated at 50C in oven). Excess dye was cleaned up with the magnetic bead module in 3 steps starting with 50 µL of 2x washed magnetic beads, and 370 ul acetonitrile followed by 2x washes with 200 ul wash buffer and separation on DynaMag™-2 Magnet. Captured labeled glycans were then released in elution buffer and mixed with acetonitrile at 1:3 ratio for subsequent HILIC UHPLC-FLD analysis on the Vanquish™ Horizon UHPLC system using the Accucore™ 150 Amide HILIC LC column, experimental conditions can be seen in Table 1.
Table 1. Conditions for analysis of labeled N-glycans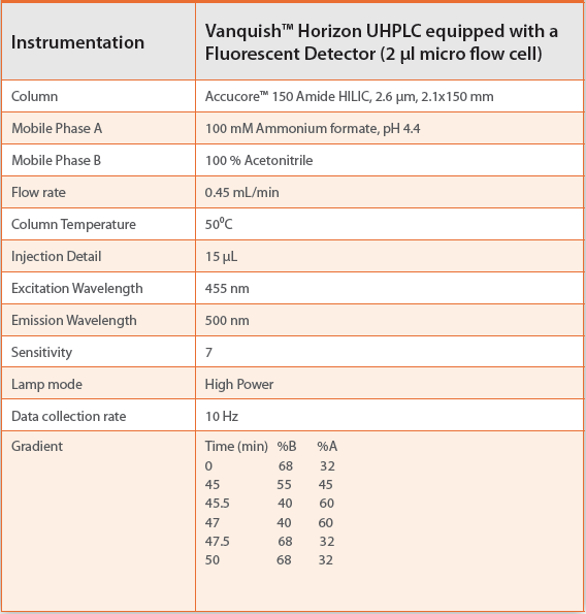
As can be observed in Figure 4 a-c, , only peaks between GU 4-13 were integrated which results in the integration of 37 peaks ≥0.03 % relative area. The average relative area of 26 peaks ≥0.07% relative area is shown in Table 2 and was found to have excellent sample preparation repeatability with RSD of <5 % for peaks with relative area of ≥0.5 %. Similarly the retention time was highly repeatable with RSD of <0.3 %. We found a very good sensitivity of labeled samples with LOQ i.e. 0.1 % relative area. Total sample preparation time from N-glycan release until analysis took <1.5 h with hands on time of <30 min.
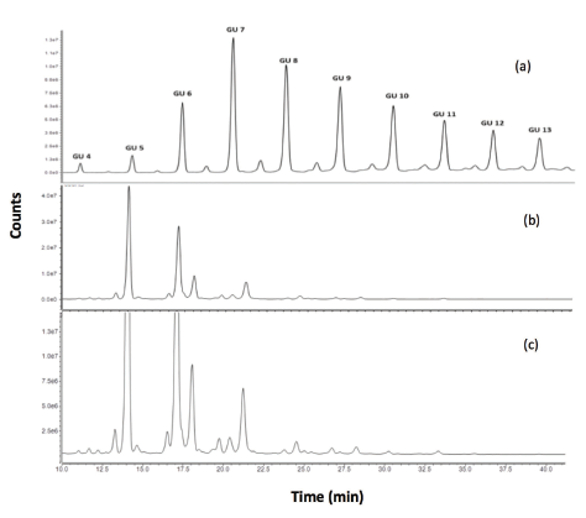 Figure 4. Chromatogram of dextran ladder (a), N-glycan profile of NIST mAb prepared with GlycanAssure™ HyPerformance APTS kit and analyzed on Accucore™ 150 Amide HILIC column and Vanquish™ Horizon UHPLC equipped with FLD, zoomed out (b) and zoomed in views (c).
Table 2. Three N-Glycan sample preparation replicates of NIST mAb with manual GlycanAssure™ HyPerformance kit and analysis on Vanquish™ Horizon UHPLC with Accucore™ 150 Amide HILIC column 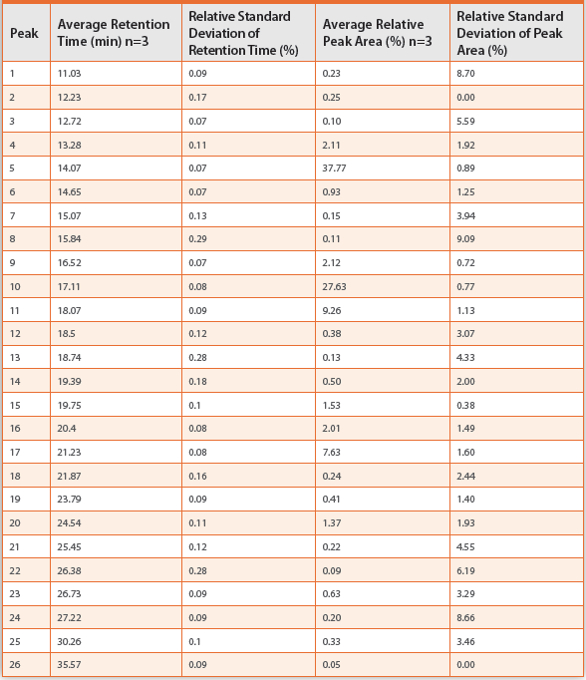
Comparison of Automated and Manual N-Glycan Sample Preparation
Comparability of N-glycan sample preparations was evaluated between the aforementioned manual and an automated version of the workflow, for which NISTmAb (#8671 (lot# 14HB-D-001) was prepared in 3 replicates on an AutoMate Express™ system (Thermo Fisher Scientific). In brief, 10 µL of glycoprotein at 10 mg/mL was added to a reaction tube and placed in the instrument. Manufacturing-ready, pre-filled cartridges, pipette tips, empty elution tubes and a tube of prepared 2x washed magnetic beads were placed in the AutoMate Express™ instrument. A script card was inserted and the run was started. Run starts with 5 min denaturation followed by 10 min deglycosylation and 60 min dye labeling all in the heated unit of AutoMate™ Express. Then free dye is removed from labeled N-glycans by inpipette tip mixing technology A summary of relative areas of peaks ≥1 % from the manual and automated sample preparation workflows can be seen in Table 3. A good comparability in % relative area with RSD of <10% was observed between the manual and automated N-glycan sample preparation workflows.
Table 3. Comparison of N-glycan results between automated and manual sample preparation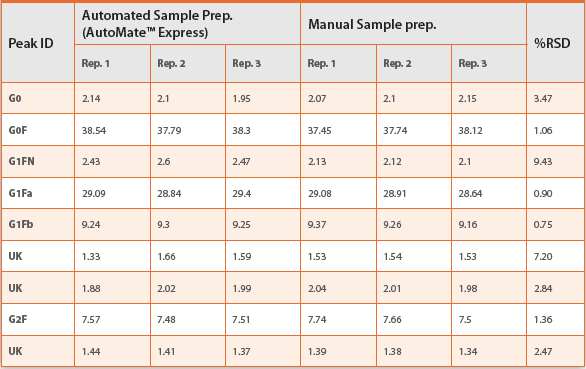
Conclusion
N-glycosylation is a CQA of protein therapeutics which must be evaluated and monitored through all steps of drug product optimization and production. Due to the large number of samples required to be evaluated for this CQA in early stage screening, sample preparation chemistries and analytical platform flexibility that can enable these features are amenable. We found the N-glycan sample preparation with the GlycanAssure™ HyPerformance APTS kit to be a short and streamlined 3-step workflow with <30 min hands-on time and <1.5 hour total sample preparation time. With AutoMate Express™ the 3 steps of the workflow are automated with only 5 min hands-on time. Results from manual and automated sample preparation with AutoMate Express™ are highly comparable. We have evaluated the quality of rapid deglycosylation of this workflow on a complex and highly sialylated glycoprotein. The results have shown that complete deglycosylation is achieved within a 10 min deglycosylation period. Analysis of NISTmAb APTS-labeled N-glycans by HILIC UHPLC with FLD allowed resolution of 37 distinct glycan ≥0.03 % relative area, with great sample preparation repeatability and RSD of ≤5 % for peaks ≥0.5 % relative area. For High throughout N-glycans preparation and analysis, time to results (TTR) of samples prepared in 96-well plate with analysis on multicapillary CE3500xL is only 5.4 hour.
References
- Moremen. K, Tiemeyer. M, Nairn. V, “Vertebrate protein glycosylation: diversity, synthesisandfunction”, Nat. Rev. Mol.Cell Biol, vol. 13, pp. 448–462, 2012.
- Apweiler, R. et al. “On the frequency of protein glycosylation, as deduced from analysis of the SWISS-PROT database”, Biochim. Biophys. Acta, vol. 1473, pp. 4–8, 1999.
- Kamoda. S, Kakehi. K, “Evaluation of glycosylation for quality assurance of antibody pharmaceuticals by capillary electrophoresis”, Electrophoresis, vol. 29, pp. 3595-604, 2008.
- Jefferis. R, “Glycosylation as a strategy to improve antibody-based therapeutics”, Nat. Rev. Drug. Discov., vol. 8, pp. 226-34, 2009.
- Prater. B.D, Connelly. H.M, Qin. Q, Cockrill. S.L, “Highthroughput immunoglobulin G N-glycan characterization using rapid resolution reverse-phase chromatography tandem mass spectrometry”, Anal Biochem, vol. 385, pp. 69-79, 2009.
- Kamoda. S, Ishikawa. R, Kakehi. K, “Capillary electrophoresis with laser-induced fluorescence detection for detailed studies on N-linked oligosaccharide profile of therapeutic recombinant monoclonal antibodies”, J. Chromatogr. A, vol. 1133, pp. 332-9, 2006.
- Kaneko. Y, Nimmerjahn. F, Ravetch. J.V, “Anti-inflammatory activity of immunoglobulin G resulting from Fc sialylation. Science. vol. 313, pp. 670-673, 2006.
- Peipp. M, Van Bueren. J.J.L, Schneider-Merck T, Bleeker WWK, Dechant M, Beyer T, et al. Antibody fucosylation differentially impacts cytotoxicity mediated by NK and PMN effector cells. Blood, vol. 112, pp. 2390-9, 2008.
- Macher. B.A, Galili. U,”The Gala1,3Galb1,4GlcNAc-R (a-Gal) epitope: a carbohydrate of unique evolution and clinical relevance, Biochim. Biophys. Acta, vol. 1780, pp. 75-88, 2008.
- Melmer. M, Stangler.T, Schiefermeier. M et al., “HILIC analysis of fluorescence-labeled N-glycans from recombinant biopharmaceuticals”, Anal. Bioanal. Chem, vol. 398, pp. 905-14, 2010.
- Varki. A, Cummings. R.D, Esko. J.D, et al., “Essentials of glycobiology”. Eds; Cold springs harbor: New York, vol. 2. 2019.
- Prien. J.M, Stockmann. H, Albrecht. S et al., “Orthogonal Technologies for NIST mAb N-Glycan Structure Elucidation and Quantitation, vol. 1201, pp. 185-235, 2015.
- Cook. S.K, Bullock. K, and Sullivan. T, “Development and qualification of an antibody rapid deglycosylation method”, Biologics, vol. 40, pp. 109-117, 2012.
- Harvey. D. J, Royle. L, Radcliffe, C.M et al., “Structural and quantitative analysis of N-linked glycans by matrixassisted laser desorption ionization and negative ion nanospray mass spectrometry”, Anal. Biochem, vol. 376, pp, 44–60, 2008.
- Weiskopf. A.S. Vouros. P. Harvey. D.J., “Characterization of oligosaccharide composition and structure by quadrupole ion trap mass spectrometry”, Rapid Commun. Mass Spectrom, vol. 11, pp. 1493–1504, 1997.
- Ciucanu. I. Costello. C.E., “Elimination of oxidative degradation during the per Omethylation of carbohydrates”, J. Am. Chem. Soc, vol. 125, pp. 16213– 16219, 2003.