Introduction
Off-line analysis by various chromatographic techniques has traditionally been the major approach to in-process controls during the early stage of drug development. On the other hand, on-line/at-line technology such as Infrared (IR) and Raman spectroscopy has become increasingly useful tools for reaction monitoring [1-10]. The advantages of in-situ monitoring includes the capability of gaining a large amount of real time data in a non-contact manner, the analysis is nondestructive in nature, and no sampling, quenching or workup is needed that may alter the composition of the reaction mixture. A Reaction Monitoring (RM) Lab was recently established within the Research and Science Technology Division in Pfizer, where online reaction monitoring tools have been utilized for in-situ monitoring of a variety of chemical reactions in support of project progression. Both Raman and IR proved to be useful tools to help the project laboratories in examining chemistry that is difficult to monitor by normal offline methods, or chemistry that involves reactive/ unstable intermediates, critical endpoints, high energy reagents or ambiguous reaction completion time. In this article, IR and Raman technologies were utilized for reaction monitoring to gain process understanding and in-process control for a Halogen-Lithium exchange reaction, where unstable starting material and product were involved.
Experimental
Laboratory reactions were carried out in 4-neck glass, round bottom flasks. Both Raman and IR probes were immersed in the reaction mixture through two separate necks. Reaction mixtures were kept at approximately -78ºC with acetone and dry ice mixture. The flasks were covered with Aluminum foil to prevent the interference of florescence from ambient lighting. Kilo lab reactions were carried out in jacketed reactors, as part of a GMP manufacturing campaign.
In-situ Raman spectra were acquired using a laboratory Raman analyzer equipped with fiber optic sampling and probe technology. The excitation wavelength is 785 nm. A back illuminated CCD was used with the Raman detector at a working temperature of -40ºC for data capture.
Laboratory and Kilo lab scale in-situ Infrared spectra were acquired using FT-IR based in-situ reaction analysis systems equipped with fiber optic sampling and probe technology. Silver Halide fiber optics and Diamond ATR probes were used for data collection.
Both the Raman and IR systems are equipped with data analysis software that is capable of performing multivariate analysis.
Results and Discussion
Chemistry
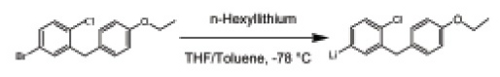 The above scheme depicts the Halogen- Lithium exchange chemistry that was examined in this article. The reaction involved the slow addition of room temperature n-Hexyllithium in hexane into the reaction vessel containing the Aryl bromide starting material in Tetrahydrofuran/Tolunene (1:3) solvents. In-situ reaction monitoring was desired as the reaction is a cryogenic reaction, and N-Hexyllithium and the lithiation product (intermediate) are both air and moisture sensitive. Reaction completion monitoring by offline analysis techniques such as high performance liquid chromatography (HPLC) was challenging. In-situ monitoring was therefore explored to monitor Aryl bromide disappearance, evaluate lithiation product stability, and demonstrate feasibility of in-situ monitoring for this reaction on Kilo Lab scale.
In-situ Reaction Monitoring by Raman Spectroscopy
Reference spectra of the starting materials and solvents, Aryl bromide, n-Hexyllithium in n-Hexane, Tetrahydrofuran and Toluene were obtained (Figure 1). Based on the reference spectra, monitoring of Aryl bromide disappearance could be accomplished by monitoring the signal change of the Raman band at 262 cm-1 (C-Br). Likewise, the Raman band at 693 cm-1, related to C-Cl, could also be used for monitoring the disappearance of Aryl bromide.
In-situ reaction monitoring was subsequently carried out. Figure 2a shows the real time Raman spectra of the reaction mixture. Figure 2b shows the plot of peak height versus reaction time for the 262 cm-1 band. The decrease in signal indicated the disappearance of Aryl bromide upon the addition of n-Hexyllithium. Similar trend was also observed for the 693 cm-1 band.
As shown in Figure 2a, a Raman band at 678 cm-1 that was not initially present in the reaction spectra started to appear upon the addition of n-Hexyllithium, and the peak intensity grew as the addition continued. This band was believed to be related to C-Cl in the lithiation product. Figure 2b shows the trend analysis via peak height for this band. The appearance of the 678 cm-1 band at the addition of n-Hexyllithium, and increase in signal with time indicated the growth the lithiation product with the addition of n-Hexyllithium.

The software used for the study was capable of performing multivariate analysis and identifying components based on spectral change in the reaction mixture. A component was picked up by the software. This component was assigned to be the Aryl bromide based on comparison of the Raman spectrum generated by the software with the reference spectra (Figure 2b).
As shown in Figure 2b, Raman signals for the starting material and product exhibited increasing or decreasing trends with onsets and finishes coinciding with the n-Hexyllithium addition, indicative of reaction progression. However, all of he signals exhibited a second step of decrease at about 25 min after the initial plateau. To identify the reason for this signal decrease, Raman bands related to the solvents, Tetrahydrofuran at 918 cm-1 and Toluene at 785 cm-1, were plotted. Signals related to these solvents exhibited the same phenomenon. It is believed that the second step of signal decrease was caused by the solution physics as Raman signal change reflects physical and chemical changes in reaction mixture. In absence of any chemical reaction, concentrations of THF, Toluene and Aryl bromide in the reaction mixture would decrease as a result of the addition of n-Hexyllithium in hexane to the reaction vessel; thus resulted in a decrease in Raman signal. Because the addition was of room-temperature n-Hexyllithium to the reaction vessel that was kept at approximately -78ºC, and Halogen-Lithium exchange is an exothermic reaction, there was temperature variation during the addition and subsequent to the completion of the addition. Raman signal could vary due to the resulting temperature variation. In addition, it was noted that the reaction mixture starting as a clear solution became opaque during the course of the reaction. Solution opacity could also impact Raman signal intensity. In addition to the above physical change, the concentrations of the Aryl bromide and lithiation product changed as the reaction progressed, resulting in Raman signal change. Since the solvents, Tetrahydrofuran and Toluene, would experience the aforementioned physical changes but not the chemical change, it was believed that any Raman signal variation observed for THF and Toluene related bands would reflect the physical changes. If this assumption was true, variation in Raman signal for the starting material (Aryl bromide) and product due to the physical changes could be corrected using the solvent related bands as the reference. Figure 2c shows the plot of the ratio of the Aryl bromide related band (262 cm-1) and the lithiation product related band (683 cm-1) to those of THF (918 cm-1) and Toluene (785 cm-1). As demonstrated by these plots, Aryl bromide related band started decreasing upon the start of n-Hexyllithium addition and reached steady state at the completion of the addition. Likewise, lithiation product related band started appearing upon the start of n-Hexyllithium addition, increased in intensity as the addition progressed, and reached steady state at the completion of the addition. The ratio plots did not exhibit the second step of signal decrease at approximately 25 minutes. It is therefore evident that ratio analysis removed Raman signal variation due to physical change in reaction mixture and revealed the chemistry related trends. Feasibility of Raman spectroscopy for in-situ monitoring of this Halogen-Lithium exchange reaction is demonstrated. Data indicated that the disappearance of reactant (Aryl bromide) and formation of lithiation product was instantaneous. Furthermore, lithiation product appeared to be stable for up to 3 hours, the duration of the experiment.

In-situ Reaction Monitoring by Infrared Spectroscopy
Infrared (IR) reference spectra of the starting materials and solvents, the Aryl bromide, n-Hexyllithium in n-Hexane, Tetrahydrofuran and Toluene, are shown in Figure 3. Based on the reference spectra, monitoring of the disappearance of the Aryl bromide could be accomplished by monitoring the IR signal change at 1247-1248 cm-1 ( C-O stretch).
In-situ reaction monitoring was subsequently carried out. Second derivative was applied to the IR spectra to improve peak resolution. Figure 4a shows the second derivative of the real time IR spectra of the reaction mixture. An IR band at 1243 cm-1 that was not initially present started to appear upon the addition of n-Hexyllithium, and the peak intensity grew as the addition continued. It is believed this band was associated with C-O stretch in the lithiation product.

Peak center shift was monitored for the 1248 cm-1 band (Figure 4b). The center shifted to lower wave number upon the addition of n-Hexyllithium and reached minimum at the completion of addition, which was consistent with the progression of the reaction and in agreement with the Raman data. The subsequent shift of peak center to higher wave number was likely due to temperature effect as Halogen-Lithium exchange is an exothermic reaction.
The software used for the study was capable of performing multivariate analysis and identifying components based on spectral change of the reaction mixture. Two components, picked up by the software, were believed to be the Aryl bromide and the Lithiation product (Figure 4a). Figure 4b shows the trend of the two components by multivariate analysis. As expected, Aryl bromide concentration decreased with the addition of n-Hexyllithium, while the product concentration increased. Steady state was reached at the conclusion of the n-Hexyllithium addition, indicating an instant reaction in consistence with the Raman data.
Similar to Raman (Figure 2b), all IR signals for the starting material and product exhibited a second step of decrease at about 25 min after the initial plateau (Figure 4b), likely due to the same solution physics as that reflected by Raman data. However, similar ratio analysis using solvent related bands to remove IR signal variation due to solution physics was not as conclusive as Raman. This is likely due to the difference in the IR and Raman probe and sampling technology used for the study. IR signal reflects the concentration in the solution phase while the Raman signal reflects the concentration in all phases. Therefore, while ratio analysis can remove the Raman signal variation due to dilution and temperature effect, it is not capable of removing IR signal variation due to solution opacity change during the course of the reaction.
Based on the laboratory data, Raman spectroscopy was superior for in-situ monitoring of this reaction. However, feasibility of IR for in-situ monitoring of this reaction on Kilo lab scale was pursued due to the lack of Raman capability within the Kilo Lab at present. It appeared that by careful data treatment such as applying second derivative to improve peak resolution, monitoring peak center shift and employing multivariate analysis, IR is feasible for in-situ monitoring of the disappearance of Aryl bromide; and thus, Halogen-Lithium exchange reaction progression.
Figure 4c shows the trend analysis for the IR data obtained in the Kilo Lab during the manufacturing of the active pharmaceutical ingredient (API). As demonstrated in the top panel, peak height analysis of the 1247 cm-1 and the 1243 cm-1 band was not feasible due to the significant peak overlapping of these two bands. Rather in-situ monitoring of this reaction by IR seemed to be feasible via peak center shift of 1247 cm-1 band. The peak center shift started at the start of the addition of n-Hexyllithium and reached the steady state at the completion of the addition. Bottom panel of Figure 4c included trend analysis for the Aryl bromide and the lithiation product, as obtained by multivariate analysis. Also included in the same graph is the peak center shift trend for the 1247 cm-1 band. As demonstrated by the IR trends obtained by multivariate and peak center shift analysis, and shown in Figure 4c, the Halogen-Lithium exchange reaction is an instantaneous reaction, in consistency with Raman Data. The absence of the additional IR signal variation after reaching the first plateau is probably due to the better mixing and temperature control on the Kilo lab scale, as compared with the laboratory study.


Conclusions
Vibration spectroscopy such as Raman and IR provides useful in-situ monitoring tools in support of project progression during early stage of drug development. An example application is presented here where a Halogen-Lithium exchange reaction was studied in the laboratory and on the Kilo Lab scale. In-situ Raman and IR analysis for the reactant and product indicated the exchange was instantaneous. Steady state was reached at the conclusion of the n-Hexyllithium addition. The lithiation product appeared to be stable up to 3 hours.
Ratio analysis using solvent related Raman bands is a useful tool for Raman Spectroscopy in removing signal variations due to solution physics and revealing true chemistry related trend. For IR, second derivative, multivariate and peak center analysis were employed to reduce and remove interference due to overlapping reactant and product bands, allowing the in-situ monitoring of Halogen-Lithium exchange by IR. Feasibility of reaction monitoring by IR was demonstrated on the Kilo lab scale. APR
Acknowledgments
The author would like to acknowledge F. Antosz, Z. Zhang, Y. Xiang, R. Chen, T. Brandt, R. Lehner and M. Barrila for their collaboration and helpful discussions throughout the study. Acknowledgements are due to M. Pelletier, K. Leeman and B. Maranzano for sharing their knowledge and experience in in-situ reaction monitoring. Thanks to the Kilo Lab colleagues for their assistance in reaction monitoring in the Kilo Lab, and to the management of Research Science and Technology, Pfizer, for their support of the project.
References
1. F. Adar, R. Geiger, J. Noonan, Raman Spectroscopy for Process/ Quality Control, Applied Spectroscopy Reviews, 1997, 32(1&2), pp 45-101
2. J. R. Schmink, J.L. Holcomb and N.E. Leadbeater, Use of Raman Spectroscopy as an in Situ Tool to Obtain Kinetic Data for Organic Transformations, Chem. Eur. J., 2008, 14, 9943-9950
3. N.E. Leadbeater and R.J. Smith, Real-Time Monitoring of Microwave-Promoted Suzuki Coupling Reactions Using in Situ Raman Spectroscopy, Organic Matters, 2006, 8 (20) 4589-4591
4. M. Lee, H. Kim, H. Rhee and J. Choo, Reaction Monitoring of Imine Synthesis Using Raman Spectroscopy, Bull. Korean Chem. Soc., 2003, 24 (2) 205-208.
5. G.M. Hamminga, G. Mul and J.A. Moulijn, Applicability of Fiber-Optic-Based Raman Probes for On-line Reaction Monitoring of High-Pressure Catalytic Hydrogenation Reactions, Appl. Spectrosc., 2007, 61(5), pp 470-478
6. E. Furusjö, L.-G. Danielsson, E. Könberg, M. Rentsch-Jonas and B. Skagerberg, Evaluation Techniques for Two-Way Data from in Situ Fourier Transform Mid-Infrared Reaction Monitoring in Aqueous Solution, Anal. Chem., 1998, 70 (9), pp 1726–1734
7. D. G. Blackmond, M. Ropic, and M. Stefinovic, Kinetic Studies of the Asymmetric Transfer Hydrogenation of Imines with Formic Acid Catalyzed by Rh-zDiamine Catalysts, Org. Process Res. Dev., 2006, 10(3), pp 457–463
8. B. J. Kip, T. Berghmans, P. Palmen, A. van der Pol, M. Huys, H. Hartwig, M. Scheepers and D. Wienke, On the Use of Recent Developments in Vibrational Spectroscopic Instrumentation in an Industrial Environment: Quicker, Smaller and More Robust, Vibrational Spectroscopy, 2000, 24 (1), pp 75-92
9. U. Wolf, R. Leiberich and J. Seeba, Application of Infrared ATR Spectroscopy to in Situ Reaction Monitoring, Catalysis Today, 1999, 49(4), pp 411-418
10. Z. Dardas, M. G. Süer, Y. H. Ma and W. R. Moser, High- Temperature, High-Pressure in Situ Reaction Monitoring of Heterogeneous Catalytic Processes under Supercritical Conditions by CIR-FTIR, Journal of Catalysis, 1996, 159(1), pp 204-211
Shelly Li is currently a Principal Scientist in the Research Science and Technology department of Pfizer Inc, Groton, CT, USA. She obtained her Ph.D in Analytical Chemistry from Iowa State University. Her current responsibilities include providing analytical support for drug candidate identification, API and drug product development, and regulatory filings. Her research expertise is in separation sciences, and developing new analytical technology to support the research and development of pharmaceuticals, from pre-candidate identification through post drug approval.
To contact the author, please email her directly at: [email protected]