Introduction
The major challenge in drug development is to find a viable synthetic route while maintaining flexibility to address short timelines and limited resources, which are the common obstacles for every early phase project. For preclinical and early clinical work, making a few kilograms of an active pharmaceutical ingredient (API) is often the critical step. Under time and cost pressures, synthetic chemists do not have the luxury of trying to optimize synthetic routes. As a consequence, scale-up issues may occur during pilot plant campaigns and result in missed project objectives. As such, a flexible pilot plant with an optimal analytical support is a key component for Product Development at GlaxoSmithKline (GSK) to answer these challenges. In this article, the effective implementation and use of a metrics tool, walk-up systems, as well as a new handheld Raman instrument will be presented as ways to improve laboratory efficiency, with interpretation of metrics data such as sample turnaround time providing a quantitative measurement of efficiency improvement.
Strategy Map
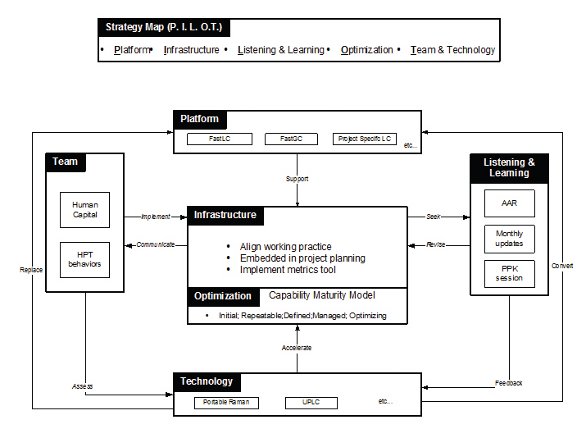
Figure 1 - Strategy map developed for providing a framework for pilot plant analytical support improvement efforts.
A visual representation of strategic objectives/framework was used as a means to connect key attributes of an intangible outcome, such as the performance of analytical support in a pilot plant environment [1]. The goal was to use the strategy map as a guide to measure and improve the efficiency and effectiveness of analytical operations. Key activities, such as gap analysis, proposed solutions to address gaps, ways and means to implement solutions, as well as explicitly-defined success criteria, needed to be fully assessed prior to finalizing a strategy map. Six strategic objectives and their links to measure analytical support performance were identified, which will be discussed in following sections (Figure 1).
Infrastructure
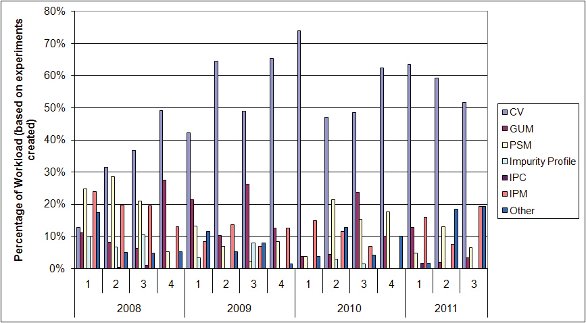
Figure 2 - Analytical workload based on the number of experiments run of a particular scope, represented as a percentage of the total number of experiments run during the duration of the corresponding quarter. Note that cleaning verifications and general use materials become a larger part of the workload, as in-process monitoring decreases.
Aligning working practices among analytical support teams in the pilot plant network was the first element in the infrastructure. Alignment makes it easier to implement technologies and develop synergy, while at the same time fostering higher quality compliance, as having a consistent approach across an entire network facilitates the learning from regulatory auditing results. Next, the analytical activities needed to be fully embedded in the project planning process prior to the chemistry campaigns to ensure material and analytical activities were captured and resource was secured. A metrics tool based on a customized electronic spreadsheet was then implemented as a “balanced scorecard” [2] to evaluate the performance of pilot plant analytical support. The tool was also used to ensure that analytical activities were aligned with pilot plant objectives, such as global campaign schedule initiatives and various exercises meant to streamline GSK R&D pilot plant operations. The analytical workload distribution was analyzed to assess the internal process perspective and three activities were identified as having the greatest impact on pilot plant efficiency: in-process monitoring (IPM), cleaning verification (CV) and testing and release of general use materials (GUMs) and project-specific materials (PSMs) (Figure 2). Baseline measurements were then established for these three activities, along with other minor activities, by using data collected since 2008 to facilitate identifying areas for improvement. Key equipment cleaning metrics can also be extracted from this tool, as in the pharmaceutical manufacturing process, it is important to ensure the production equipment is properly cleaned in order to avoid crosscontamination of drug products. For example, Figure 3 is a CV Right First Time (RFT) plot from 2008 to YTD. RFT is defined as the frequency in which the first CV sample for a specific piece of process equipment has passed at the first cleaning attempt, this particular plant’s RFT average value at approximately 80%. The data can be further granulated for root cause analysis, as well as for the purposes of assessing the effectiveness of a cleaning strategy. One observation from the CV metrics was that cleaning at lower limits (e.g. less than 13 ppm) did not fail any more frequently than cleaning at standard limits (e.g. 13 ppm or greater). Further failure analysis also showed that a CV fails for analyte content no more or less than for unknown content exceeding cleaning limits.

Figure 3 - Right first time of passing cleaning verifications, represented as a percentage of the total opportunities for passing the first CV analysis of the corresponding quarter.
The development and implementation of a metrics tool is not a simple and straightforward task, as it requires a constant and persistent effort from all parties involved. An iterated and incremental process was used rather than a water-fall, top-down approach. This prevented the metric tool from becoming excessively complicated in the beginning and encouraged compliance. In such, it was possible to assess frequently, with manageable and meaningful data, what type of metrics served as optimal performance indicators while conducting data mining to derive other metrics. For example, no specific RFT metrics were collected with the tool, but by having a unique equipment ID number, a batch number, the analyte that was cleaned for, a date value and the result of the CV experiment, RFT can be derived. This approach dramatically reduced the amount of data that needed to be collected and handled, while still providing an overall measurement of analytical and plant performance. To provide plots such as Figure 2 and 3, the metric tool required seven and five different inputs for CV and non-CV experiments, respectively. It is important to recognize that the strategic framework should be assessed and finalized prior to the metric tool implementation. Once a strategy and its measures have been established, a software application can then be employed to collect and use measurements to facilitate decision making.
Platforms
Platforms are defined as walk-up analytical instruments that provide on-demand sample analysis using standardized hardware, software, and analytical methods. GSK currently has high-performance liquid chromatography (HPLC) and gas chromatography (GC) platforms throughout the GSK network. These platforms are used primarily by synthetic chemists during route development for monitoring reaction progress. The GC platform, referred to as FastGC, is used primarily to determine residual solvents or organic impurities (OVIs) in reaction mixtures, intermediates, and APIs. IPM analyses are an important activity for synthetic chemists, as the results are needed to make go/no-go decisions for early phase chemistry processes as most likely are still under development. Based on Figure 2, IPMs in 2008 constituted approximately 20% of the overall analytical workload, requiring approximately 0.7 full-time equivalents (FTE) to support this type of activity. Since deploying walk-up instruments in 2009, providing synthetic chemists with just-in-time results, a decline in overall IPM analytical workload has been observed. This workload reduction allowed analytical support to focus on more critical activities such as CV, resulting in a reduction of the analytical CV turnaround time (from 30 hours to as low as 5 hours).
Listening and Learning
Constant improvement is the key to any teams’ success. Post-campaign after action reviews (AAR), analytical support updates and Pilot Plant Knowledge (PPK) sessions are used to capture leaning and voice of internal customers. The information collected was used to revise and optimize infrastructure in order to improve analytical support. Constructive feedback is essential to ensure that concerns are prioritized and addressed accordingly. Such exercises led to well-defined roles and responsibilities, methodologies, workflows, and later, translated into efficiency improvements. When customers are engaged in an honest, trusting and positive fashion, it is possible to explore the real working relationships that sustain a successful analytical operation.
Optimization
Optimization of analytical support is a result of all five strategic components working cohesively. To facilitate this process, some process control principles from the Capability Maturity Model (CMM) were adopted, which has been used successfully in many fields [3]. While there are four stages prior to the transitioning into the optimizing level (initial, repeatable, defined and managed), the key step in CMM is to treat the entire analytical support as a process that can be controlled, measured and improved. This is an important paradigm shift, as in the past, the analytical support was completely reactive to the plant it supported. After aligning with other analytical support groups and embedding analytical activities into project planning, it is then possible to control the analytical tasks and resource requirements for each supported project. By focusing only on the key tasks, we were able to provide the same level of analytical support with reduced resource and eliminate the need for a dedicated second-shift support.
With the implementation of the metrics tool, albeit is possible to collect and analyze the outcomes from various changes made during a specific timeframe. The analyzed results available at a particular stage yielded a new perspective on the effectiveness of recent changes, and even new insights for potential areas for further optimization. In an environment where scarcity of resources is a reality, teams are constantly under pressure to improve and these positive improvement outcomes can be used to boost team morale. In utilizing these quantified progresses, analytical support continued to assess technologies to accelerate further optimization.
Team and Technology
With a shared sense of common purpose/ vision from the positive experience during the optimization stage, analytical support is bonded together by mutual trust/interdependency, a behavior commonly associated with highperformance teams (HPT) that exhibit positive synergy [4]. HPT behaviors are very critical to pilot plant analytical support, as they foster greater flexibility and adaptability to meet project objectives and provide options to minimize delays associated with chemistry issues. With the availability of skills, talents and know-how, the analytical team becomes the human capital of a comprehensive analytical support strategy.
Technology can facilitate the acceleration of the optimization process and provide further efficiency gains in a shorter timeframe. However, project management should be an integrated part of implementing technologies as the majority of failures are attributed to lack of planning [5]. Recently, a handheld Raman device was deployed to replace Near IR for GUM identification tests. This device allowed material handlers and analysts to sentence a greater range of materials as a walk-up system, in comparison to Near IR, which was not as robust or versatile, limited to liquids only analysis. This technology provided real efficiency gains, taking approximately half the time needed to test a material versus the previously used Near IR technology, requiring little to no analytical resource for the GUM ID testing. During the implementation process, the scope of the reference spectra library was limited to a manageable number (19 materials in total), following PMI guidelines [6] to ensure the success of the implementation. This allowed the team to implement the technology in a shorter timeframe, and used project management tools, such as work-breakdown structures and risk management, allowing stakeholders to benefit from the technology immediately. By using a piecemeal approach, capability can be added over time while reducing risk. Once the handheld Raman was implemented and embedded in project planning at our site, efforts started to expand the spectra library and applications of the instrument, and transfer this technology package as a new platform for other sites in the network to utilize, requiring minimal effort in implementation. Sites in the UK are currently in the process of implementing this technology based on the learnings from this site.
Summary
Strategy is implemented through activity and project. Every activity and project should have a clear link to organization strategy. Thus, it is important to understand and measure the current strategy status, the desired end state, and how to achieve that desired state. A strategy map was used to provide a framework that has transformational impacts on analytical support at a dynamic pilot plant environment. With a graphic representation and a balanced scorecard, it is possible to constantly view an unbiased portrait of the state of the strategy and how it has evolved over time based on the six strategic objectives previously identified. It is also important to note that these improvements do not intend for staff reduction, but instead for staff to focus on more value-added activities, and to keep in mind that no technology or improvement effort can replace a HPT team that works together with a single, well-articulated goal in mind.
Acknowledgements
The authors would like to thank the Upper Providence primary pilot plant staff at GSK for their valuable feedbacks during the implementation process.
References
- Robert S. Kaplan and David P. Norton, “Strategy Maps”, Harvard Business School Press, Boston, MA, 2004
- Robert S. Kaplan and David P. Norton, “The Balanced Scorecard: Translating Strategy Into Action”, Harvard Business School Press, Boston, MA, 1996.
- Watts S. Humphrey, “Managing the software process”, Addison-Wesley, New York, NY, 1990.
- Edgar H. Schein, “Process Consultation”, Addison-Wesley, Reading, MA, 1969.
- Paul M. Leonardi, Human Communication Research, Vol. 35, No. 3, pp. 407-441, 2009.
- PMI, “A Guide to the Project Management Body of Knowledge (PMBOK Guide), 4th Ed”, PMI, Newtown Square, PA, 2008
Author Biographies
Douglas Scheesley is an Associate Scientist in Analytical Sciences at GlaxoSmithKline. He earned his B.S. degree in Chemistry (2006) from Drexel University. He has been involved in analytical pilot plant support activities and communities of practice for more than four years. His current work relates to the expansion of a handheld Raman device for the purpose of materials management, development of programs to store and analyze plant support metrics, evaluation and implementation of detergents, as a supplemental cleaning agent, as well as day-to-day plant support activities.
Leo Hsu, Ph.D. is a manager in Analytical Sciences at GlaxoSmithKline. He earned his Ph.D. in Chemistry (1992) from Florida State University and his M.S. (2001) in Information Sciences from Penn State University at Great Valley. In recent years, he has been primarily involved in implementing large scale chromatography and optimizing analytical support in a pilot plant environment.
Josephine Vega is an Investigator in Analytical Sciences at GlaxoSmithKline. She earned her B.S. degree in Chemistry (1973) at the University of San Agustin; Philippines. Prior to joining GSK, she worked at Wyeth Laboratories and Rhône-Poulenc Rorer (now Sanofi-Aventis). At GSK, she has been responsible for method development and validation, and currently supports pilot plant analytical support activities, as well as implementing new technologies, such as walkup gas chromatography platforms.
This article was printed in the September/October 2011 issue of American Pharmaceutical Review - Volume 14, Issue 6. Copyright rests with the publisher. For more information about American Pharmaceutical Review and to read similar articles, visit www.americanpharmaceuticalreview.com and subscribe for free.