Introduction
The equivalence of two test methods that detect microbiological contamination was evaluated by comparing the rate of positive and negative results obtained from identical samples. The methods were a rapid, Amplified-ATP bioluminescence (ATP+) method and the compendial plate count method. The study measured the degree to which the methods agreed when performed repeatedly on multiple lots of the same product. The accuracy, precision, specificity and sensitivity of the ATP+ method (alternate method), expressed in terms of the relative rates of discordant outcomes using standardized low-level inocula, were computed and tested against an acceptance criteria of 70%. This performance qualification was based on the United States Pharmacopoeia 32 General Chapters <1223>“Validation of Alternative Microbiological Methods” [1] and European Pharmacopoeia 6.0, Chapter 5.1.6 “Alternative Methods for Control of Microbiological Quality” [2].
Methods
Overview of Amplified-ATP Bioluminescence
The ATP+ method utilizes microbial enzymes and adenosine triphosphate (ATP) bioluminescence technology to rapidly assess the microbiological quality of pharmaceutical products using a presence/ absence test method. The standard test includes a short growth-enrichment period, during which product is dispensed into standard microbiological culture medium and incubated for 24 hours. After incubation and sample preparation, an aliquot of the enrichment culture is transferred into a cuvette and placed into a luminometer. The traditional ATP bioluminescence assay is enhanced with linear, enzyme-mediated ATP amplification. Light output is measured by the instrument’s photomultiplier unit and recorded in Relative Light Units (RLUs). The results are compared to baseline RLU values and are classified as “Negative”, “Positive”, or “Overload” based on the signal-to-noise ratio. A negative result indicates that the product’s bioburden levels are below the assay’s limit of detection whereas positive or overload results indicate that the product’s bioburden levels are at or above the test’s limit of detection.
The ATP+ assay occurs in two phases; the off-line phase of sample preparation and culture incubation, and the on-board phase of the automated bioluminescence assay. Each phase has a number of userdefined parameters that are determined during method validation. Parameters considered in the offline phase include incubation time and temperature, volume of product to be sampled, culture media volume, and type of culture media necessary to neutralize product and support growth. The ATP+ method is sufficiently flexible that virtually any combination of parameters can be used, provided that neither product nor media possess significant levels of ATP or otherwise interfere with the enzymatic reaction, and that the selected conditions satisfy compendial requirements. The on-board parameters include the signal integration period and the amplification period. The most critical parameter in the on-board phase is the amplification period, during which microbial enzymes catalyze the conversion of reagents to ATP. This reaction is linear and can be used to increase the signal-to-noise ratio of the assay. The default parameter for most applications is 40 minutes. For low bioburden situations, a 90-minute conversion period may be appropriate based on risk assessment.
In this study, 1 mL of betamethasone was transferred into 25 mL of Trypticase Azolectin Tween broth (TAT), supplemented with polysorbate 20 and inoculated with challenge organisms to yield concentrations of 10, 1.0, and 0.1 CFU/mL. Cultures were incubated at 30-32˚C for a 24-hour period. After incubation, antifoam reagent and glass beads were added and the cultures agitated on an Eberbach linear shaker. Two 50-μL aliquots of each sample were transferred into duplicate cuvettes and placed into the luminometer. The Amplified-ATP bioluminescence assay proceeded automatically using the following steps:
- Injection of reagents for extraction and amplification
- Incubation period to allow for ATP-conversion
- Addition of bioluminescence reagents
- Signal integration and recording of generated signal.
Challenge organisms were derived from lyophilized bioMerieux Bioball® suspensions and contain levels of ATP which can result in high background RLU. Allowances were made in the baselines to accommodate these background levels. Cultures exhibiting mean RLU values 3 times the baseline control value were scored as positive.
Plate Count Assay
One mL aliquots of betamethasone were transferred into tubes containing 25 mL of molten TAT supplemented with 1.5% agar (bacteria) or SDA medium supplemented with 0.005% lecithin and 0.04% polysorbate 20. Bacterial cultures were incubated 30-35˚C for 3 days. Yeast and mold cultures were incubated for 5 days at 20-25˚C.
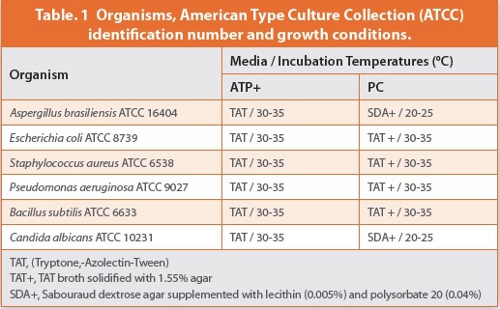
Organisms and Culture Conditions
The organisms evaluated were the compendial organisms specified in the Total Viable Aerobic Count method chapters of USP/EP/JP [3],[4]. The culture media and incubation conditions for each organism were based upon the conditions necessary to neutralize the product and achieve optimal growth as specified in the USP/EP/JP compendia and are provided in Table 1. Organisms were obtained as lyophilized Bioballs from bioMerieux. Bioballs were dissolved in sterile saline to yield an initial concentration of 10 CFU/ mL and serially diluted in saline to desired concentration.
Experimental Design
The product was inoculated at three different concentrations of each organism in the test panel (10 CFU, 1 CFU and 0.1 CFU) and assayed for the presence of microorganisms using the ATP+ and compendial plate count (PC) methods. Tests were performed on three different batches of Betamethasone suspension.
Each concentration was tested 5 times (5 replicates) by both methods. The results were expressed as positive (+, presence of microorganism) or negative (-, absence of microorganism). A one-sided McNemar’s test [5] was used to identify a statistically significant difference between the rates of positive outcomes between the two methods. If these rates were not found to be significantly different, then the hypothesis of equivalence would be tested using a receiver operating characteristic table [6] to determine accuracy, precision and specificity, using 70% as the acceptance criteria. The results from each concentration of organisms were summarized according to the format indicated in Figure 1.
Since the experimental data from each test method are binary, reflecting the presence or absence of an organism in the sample matrix, logistic regression can be used to estimate the limit of detection for each method [7]. The inoculum concentration (Log10(CFU/mL)) was used as the predictor variable and the binary result as the response variable. Two-sided 95% confidence intervals were computed on the predicted probability of response. The log value producing the largest, upper-confidence limit ≤0.1 (10%) was selected as the limit of detection.
Results
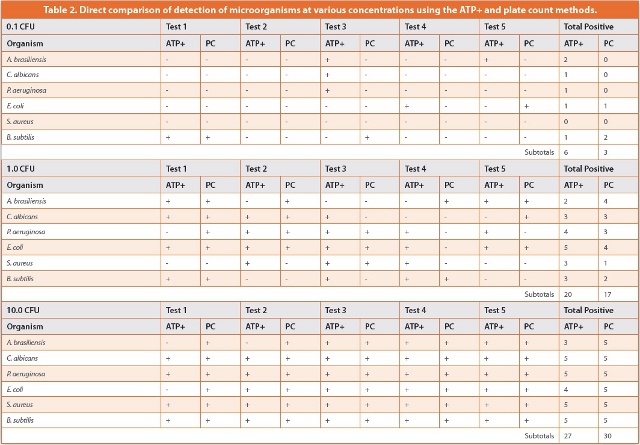
Fifteen pairs of assessments were conducted for each organism. These consisted of three different inoculum levels and five replicates at each concentration. The results are presented in Table 2; the probability of detection for each concentration of microbe is given in Table 3.
The McNemar’s test of the data produced a Χ2 statistic that was 0.190 with a one-sided p-value of 0.3318. By conventional criteria, this value is not considered to be statistically significant, thus failing to reject the null hypothesis.
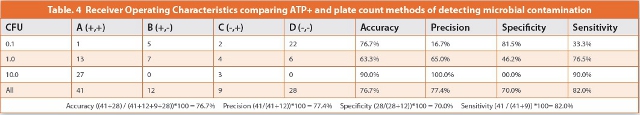
The hypothesis of equivalence was tested using receiver operating characteristics (ROC) to determine accuracy, precision, specificity and sensitivity, using 70% as the acceptance criteria. This specification is based on expected results for each concentration, taking into account the probability of growth of the microorganisms at different inoculum concentrations and the variability linked to very low inoculation levels.
The ROC results were recorded as:
A=(++)=TP=True Positives
B=(+-)=DP=Discordant Positives
C=(-+)=DN=Discordant Negatives
D=(--)=TN=True Negatives
Accuracy measures the closeness of the results obtained by the ATP+ and PC methods: (A+D)/(A+B+C+D). Precision measures the degree of agreement between both test methods where the ATP+ method indicates positive: A/(A+B). Specificity is the ability of the ATP+ method to detect the entire range of microorganisms that were present in the test. Specificity measures the agreement of both methods when the plate count method indicates a negative test sample: D/(B+D). Sensitivity measures the ability of ATP+ method to identify the same positives as those identified by the conventional method.
These measures of agreement may also be expressed in terms of discordant-positive and discordant-negative rates through the following equations:
Accuracy=(A+D)/(A+B+C+D)=(TP+TN)/(TP+DP+DN+TN)=1-(DN+DP)/ (TP+DP+DN+TN)
Precision =A/(A+B)=TP/(TP+DP)=1-DP/(TP+DP)
Specificity=D/(B+D)=TN/(DP+TN)=1-DP/(DP+TN)
Sensitivity= A/(A + C)=TP/(TP+DN)
 The ROCs for paired outcomes are presented in Table 4. Accuracy of the ATP+ method for testing low-level contamination of Betamethasone suspension was determined to be 76.7%; Precision was 77.4%; Specificity was 70.0%; and Sensitivity was 82.0%. Each of these attributes satisfies the 70% acceptance criteria for demonstrating equivalence.
The limit of detection (LOD) was calculated using logistic regression where the response variable is detection of a contaminant (positive/negative growth). The continuous predictor variable was the concentration of organisms in the inoculum (Log10(CFU/mL). The limit of detection was selected as the value with the highest concentration of cells such that there was 97.5% confidence of a less than 10% chance of detecting an organism. A single LOD has been computed to apply to all organisms.
Figure 2 presents the inverse interpolation for the limit of detection on the log scale for each test method. For the ATP+ method, the Log10 value of the LOD was –1.85, or 0.014 CFU/mL. For the PC method, the Log10 LOD value was -1.1, or 0.079 CFU/mL. The probability of detecting contamination at 1 CFU/ mL was identical for both methods. The smaller LOD value for the alternate method indicates that the ATP+ method is able to detect lower levels of contamination in the suspension product than the plate count method.
Conclusion
This study determined that the ATP+ method of Amplified-ATP bioluminescence satisfies the acceptance criteria required to demonstrate equivalence to the traditional plate count method for screening a non-sterile solution for microbial contamination. The McNemar’s test concluded the ATP+ method was not statistically superior to the plate count method for detecting contaminated samples. Therefore, the hypothesis of equivalence was tested using an ROC with an acceptance criterion of 70%. Each of the critical method attributes—accuracy, precision, specificity and sensitivity— met or exceeded a 70% acceptance criteria. The limit of detection for the ATP+ method was 5-fold lower than that for the plate count method, indicating that the ATP+ method is able to detect lower levels of contamination than the PC method. In summary, the 24-hour ATP+ method was found to be equivalent to the 3-5 day compendial plate count method for detecting low concentrations of microorganisms in a suspension product.
References
1. USP<1223> Validation of Alternative Microbiological Methods. In United States Pharmacopeia, 31st Rev.; U.S. Pharmacopeial Convention, Inc.: Rockville, MD, 2008.
2. EP 5.1.6 Alternative Methods for Control of Microbiological Quality. In European Pharmacopoeia, 6th ed.; European Department for the Quality of Medicines and Healthcare: Strasbourg, France, 2008.
3. USP 61 Microbiological Examination of Non-Sterile Products: Microbial Enumeration Tests. In United States Pharmacopeia, 31st Rev.; U.S. Pharmacopeial Convention, Inc.: Rockville, MD, 2008.
4. EP 2.6.12 Microbial Examination of Non-sterile Products: Total Viable Aerobic Count. In European Pharmacopoeia, 6th ed.; European Department for the Quality of Medicines and Healthcare: Strasbourg, France, 2008.
5. Fleiss, J. L. (1981). Statistical Methods for Rates and Proportions (2nd ed.). New York: John Wiley. p. 114. ISBN 0-471-06428-9.
6. Fawcett, Tom. ROC Graphs: Notes and Practical Considerations for Data Mining Researchers, Hewlett-Packard Company: January 2003, http:// www.hpl.hp.com/techreports/2003/HPL-2003-4.pdf.
7. Smith, Ron, Mark Von Tress, Cheyenne Tubb, and Erwin Vanhaecke. 2010. Evaluation of the ScanRDI® as a rapid alternative to the Pharmacopoeial sterility test method: comparison of the limits of detection. PDA J. Pharm. Sci. Technol. 64(4): 356-363
This article was printed in the November/December 2012 issue of American Pharmaceutical Review, Volume 15, Issue 7. Copyright rests with the publisher. For more information about American Pharmaceutical Review and to read similar articles, visit www.americanpharmaceuticalreview.com and subscribe for free.
Ron Smith received his Ph.D. in Microbiology from Texas Tech University in 1991. He has 8 years’ experience in academia, and more than 12 years’ experience in the Pharmaceutical, Biotech, Medical Device industries. Dr. Smith is currently serving as a consultant for Excellent Pharma Consulting.
Thomas Chrzanowski received his Ph.D. from the University of South Carolina and is a full professor at the University of Texas Arlington. His research focuses on factors regulating growth of bacteria. He is a member of the American Society for Microbiology and a Fellow of the American Academy of Microbiology