Dissolution testing has been an important tool for decades for assessment of drug release from solid oral dosage forms such as tablets and capsules in pharmaceutical development. The amount of active pharmaceutical ingredient (API) in the solid dosage form which is dissolved over time under well defined test conditions such as temperature, composition of dissolution medium and hydrodynamics, results in a bulk concentration profile that provides very useful information for formulation design manufacturing quality control, stability studies, and prediction of in vivo performance.1-3
Dissolution and UV Detection
Throughout the development of dissolution testing, a natural bond has been established between dissolution and spectroscopy. Dissolution testing is especially reliant on UV spectroscopy for detecting the amount of drug released in the medium. In traditional dissolution, sample aliquots are withdrawn and filtered manually or automatically, and then the concentration of the API in the aliquots are measured primarily by using UV spectroscopy, either being transferred into a cuvette for offline UV measurement, or being collected in HPLC vials for UV detection after separation. Online UV measurement can also be performed by pumping an aliquot through a flow cell monitored by a UV spectrophotometer, or using flow injection analysis and online HPLC with UV detectors.
Continuous Monitoring of the Dissolution Profile
When fiber optic technology was brought to UV spectroscopy starting in 1988, significant changes were made to dissolution testing.4 UV fiber optics enabled in-situ measurement of the dissolution process.5-8 Instead of only obtaining a limited number of data points from discrete sampling as in traditional dissolution testing, more frequent data points up to 1/second could be generated, and a more accurate real time dissolution profile could be produced by using UV fiber optics. UV fiber optic dissolution eliminated the use of sampling consumables, decreased the cost, simplified the testing and data processing, therefore it significantly improved lab productivity. More important, a more detailed dissolution profile with more frequent data points enables a better comparison of the dissolution behavior of different batches and formulations.
There is still great interest to learn about dissolution and related mechanisms, in addition to providing improved dissolution profiles and increasing efficiency in dissolution testing using the UV fiber optics for continuous monitoring. Efforts have been made over the years to examine physical changes to the dosage form during the dissolution process and to elucidate drug release mechanisms from a solid dosage forms. The classical approach is direct visual observation of the dissolution process.3,9-11 to see disintegration of the dosage form, dispersion of particulates, mounding at the bottom of vessel, etc. Pictures can be taken at time points of interest to see the the dissolution behaviors of solid dosage forms, as well as cross-linking effect on the dissolution of gelatin capsules. Specially designed video cameras can also be installed next to the dissolution vessel to record the whole dissolution process. Optical microscopy has been used to examine the surface of the sample in an intrinsic dissolution cup before and after dissolution. Focused beam reflectance measurements (FBRM) have also been conducted to examine the size distribution of particles that result from the dissolution process.12
Spectroscopic Imaging for Dissolution
Recent advancements in spectroscopic imaging and its implementation in dissolution testing have made it possible to observe the dynamic dissolution process in-situ with high spatial and temporal resolution. Spectroscopic imaging measures the changes on or close to the surface of the solid sample or tablet. It provides information on the changes of chemical and physical properties of drug and excipients that are relevant to dissolution mechanisms. Spectroscopic imaging techniques that have been applied to dissolution studies include NMR, Raman, FT-IR, NIR and UV. In this article we briefly review these spectroscopic techniques applied to dissolution imaging and then focus on UV surface dissolution imaging (SDI) with application case studies.
NMR Imaging
An NMR/dissolution system consists of a magnetic resonance imager (MRI) and a USP dissolution apparatus 4 flow cell made of plastic.13 The USP 4 flow cell containing a tablet sample is placed in the center of the magnetic enclosure of the MRI and can be operated in either closed loop or open loop fashion. NMR dissolution images are generated using the proton signal from the un-bound water that has infiltrated the dosage unit, which gives information relative to surface hydration, swelling and erosion. Quantifications of the areas of the dry core, hydrogel and diffusion front are correlated with the drug release.14-16 Recently, nearly concurrent imaging of excipient behavior via proton imaging and API concentration in the dosage unit via 19F imaging of a fluorine containing API has been reported.17
Raman Imaging
When Raman imaging has been applied to the dissolution study of solid dosage forms, a coherent anti-Stokes Raman scattering (CARS) microscope was employed to monitor the surface changes of tablet mounted in a lab made flow cell while dissolution medium passed over the sample.18-19 The Raman images show the details of the API crystal form changes during the dissolution that are significantly affected by exposure to aqueous media, for example conversions from anhydrate to monohydrate or di-hydrate, and from amorphous to crystalline. These form transformations are correlated with the changes in dissolution rates.18,20-22
FT-IR Imaging
FT-IR imaging has been used to visualize the water ingress into tablets, and the distribution and chemical state of API and excipients in the microenvironment around the tablet surface during dissolution.23-26 A flow cell used for the FT-IR imaging is similar to the one used for Raman imaging of dissolution, but is mounted with an attenuated total reflectance (ATR) crystal. The IR beam passes through the ATR crystal, reaches to the tablet that is positioned in the flow cell, and reflects back to the detector with the information related to the chemical changes during dissolution.27-28
NIR Imaging
A NIR imaging device was reported to monitor the dissolution of tablets.29 The tablet is held in a sample cell with a transparent barium fluoride window and a Teflon spacer. Water is supplied through a top hole in the cell to reach the tablet without flow through the cell. NIR imaging was performed using a single wavelength-based measurement or a ratio of intensities of two bands to visualize the process and degree of water penetration into the tablet, and to probe the resulting variations in the concentrations of tablet components.
UV Imaging
This is a relative newcomer to dissolution testing. A UV surface dissolution imaging (SDI) system became commercially available in 2010.30 In this system (see Figure 1), a sample is tested in a similar fashion to USP intrinsic dissolution rate testing. The sample is compacted into a pellet in a stainless steel sample cup or a solid sample is cored out of a solid dosage unit into the sample cup. The sample cup is mounted at the bottom of a quartz flow cell with the sample surface in contact with the dissolution medium. Dissolution medium flow is controlled by using a programmable syringe pump, which enables the testing of the dissolution behavior of the sample under different flow conditions. A single wavelength of UV light from a pulsed Xenon lamp is selected with a band pass filter to monitor the region at or close to the interface of the sample and dissolution medium. A complementary metal oxide semiconductor (CMOS) array detector is used to collect the UV images of the interface. These images are analyzed to display the drug concentration gradient close to the interface as well as to quantify the intrinsic dissolution rate of the drug.
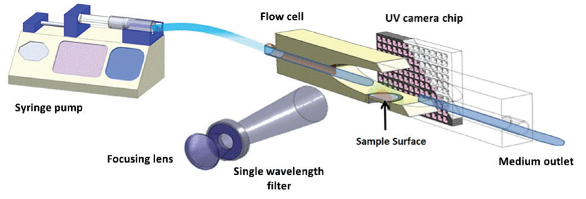 Figure 1. Diagram of UV Surface Dissolution Imaging System - ActiPix SDI 300
A number of applications using UV SDI have been explored in the past few years. It has been used to study API behavior including single crystal dissolution31 and intrinsic dissolution of different crystal forms of a drug.32 It has also been used to study drug diffusion and release from hydrogels33 and transdermal patches.34 Another important application area of the UV SDI is to study the dissolution behaviors and mechanisms of solid oral dosages including the physical effect of the excipient on the drug release from controlled release dosage forms35, the rheological properties and behaviors of a polymer used for solid dosage forms36, and the use of SDI as a tool for co-processed API formulation development.37
UV Imaging vs. Other Spectroscopic Imaging
UV Imaging has advantages compared with the other spectroscopic imaging technologies being applied to dissolution testing. Firstly, UV imaging instrumentation is simple, low cost, and commercially available, while Raman and FT-IR imaging systems are currently only available in academic labs. NIR imaging is still in the early development stage, and one system for NMR imaging has been discontinued by the vendor. Secondly, UV imaging provides simple quantification of drug release and bulk concentration because UV spectroscopy obeys Beer’s Law, whereas in Raman imaging the CARS has a nonlinear dependence between concentration and response. Thirdly, UV imaging measures the drug concentration directly, unlike MRI that only measures the water proton signal except in special cases where the API contains a non-hydrogen spin-active nucleus. Further advantages include use of a small sample size, and compatibility with biorelevant dissolution media.
Disadvantages of UV imaging are primarily due to the broad bandwidth of UV spectral features leading to information-poor spectra compared to the other spectroscopic techniques discussed previously. This also results in increased overlap of signals from other sample components rendering UV imaging more susceptible to interference that makes simultaneous analysis of multiple components more challenging. The current available UV SDI system can only be used with single wavelength for an entire measurement acquisition. Currently it is not possible to analyze the same sample at different wavelengths; to do so requires a manual change of the band pass filter and analysis of a new pressed sample of the analyte. Future developments may allow for multiple wavelengths to be monitored simultaneously. Additionally, the SDI system is designed to test a powder compact or a portion of a tablet, not the whole tablet. To overcome some of these disadvantages, efforts have been made to conduct complimentary studies using the other spectroscopic techniques combined with UV SDI to enhance the understanding of dissolution mechanisms.32
UV Imaging Application Case Studies
UV surface dissolution imaging has been used as an important tool in this lab for pharmaceutical development. Case studies include (1) Formulation development - co-processed API screening, (2) Trouble shooting for dissolution testing of stability samples - HPMC capsule shell effect, and (3) Study of extended release formulations.
Case 1: Co-processed API Screening
During development of a potent BCS Class II drug, the use of coprocessed API was considered as a formulation strategy38 because the drug product was targeted a low dose (< 1 mg/tablet, with expected API load at 0.5 wt %). The API has poor processibility (cohesive and agglomerative powder), pH dependant solubility, and high toxicity. Co-precipitation of the API with a solubilization agent and a suitable functional excipient as a carrier produces a slurry with desirable physical properties and drug release profile. Meanwhile, it could reduce the risk of toxicity during handling, and decrease the potential for poor content uniformity because of better dispersion of the API. UV SDI played an important role in selection of a suitable carrier and evaluation of the drug release of the co-processed API formulations. During the carrier selection, many candidates were screened using UV imaging. Here the comparison of three coprocessed API formulations made using three different carriers are demonstrated, including (1) a mix of microcrystalline cellulose and hydroxyl propel cellulose (MCC/HPC) at a fixed ratio, (2) Neusilin US2, and (3) calcium silicate. A surface dissolution imager system was used for the screening. Samples were prepared by compacting 3 - 5 mg of the co-processed slurry into a sample cup with a fixed torque of 40 cNm. The dissolution medium was 0.1 N HCl based on an existing tablet dissolution method. A flow program was designed for the SDI screening method that starts with a flow step at 0.2 mL/min for 15 minutes, followed by a stop flow step for 5 minutes, and a wash step at 2 mL/min for 2 minutes. The UV measurement was conducted at 254 nm according to the API UV absorption.
UV images of the three co-processed API formulations are shown in Figure 2. During the flow step the MCC/HPC formulation displayed slight swelling, seen as the formation of a rounded mound above the sample cup; the API diffused out of the sample surface and was transported by the flow of the liquid medium to the quantification zone at the right. A nominal intrinsic dissolution rate (IDR) of the API in this formulation was determined as being in the range of 0.010 - 0.025 mg/min/cm2. Similarly, a measurable nominal IDR was determined for the Neusilin US2 formulation in the range of 0.004 - 0.006 mg/min/ cm2, but this formulation did not swell. In contrast, the calcium silicate formulation showed no-appreciable IDR, nor any swelling either. During the stop flow step, there was significant diffusion of the API off the swollen MCC/HPC surface. The Neusilin US2 formulation showed moderate API diffusion and the calcium silicate had minimal API diffusion. In both the Neusilin US2 and calcium silicate downstream movement of API was observed during the stop-flow step. This is interpreted to be gravitational effects in the cell due to the cell being tilted. The API is still incorporated with the matrix and transport downstream as particles of the matrix release from the sample pellet. This behavior is not observed with the MCC/HPC because the formation of a hydrogel due to the HPC stabilizes the solid and prevents mechanical degradation of the swollen sample.
 Figure 2. UV images of three co-processes API formulations: Formulation 1 - MCC and HPC as substrate; Formulation 2 - Neusilin US2 as substrate; Formulation 3 - Calcium silicate as substrate. Figure 2(a) shows images from the flow step. Figure 2(b) shows images from the stop flow step.
Figure 3 shows the drug release profiles obtained from powder dissolution testing in the same medium for the three co-processed API formulations. The rank order of these profiles is in good agreement with the IDRs measured from the SDI. The physical properties of these co-processed API formulations were also examined through the observations of the sample surface in the SDI cup after the SDI study using a 7 x loupe: The MCC/HPC formulation swelled significantly; the Neusilin US2 formulation sample matrix was hydrolyzed, becoming gel-like; the calcium silicate formulation sample surface was glasslike. As a result, it was determined that the formulation with the MCC/ HPC carrier demonstrated more desirable properties and drug release behavior over the other formulations, and therefore was chosen for further development.
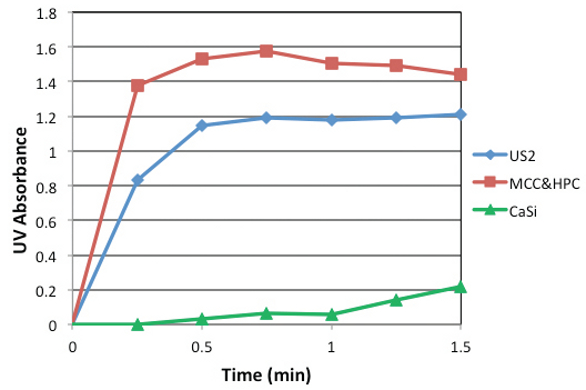 Figure 3. Drug release profiles of the three formulations from powder dissolution testing: Ranking of the profiles is in agreement with the IDRs from SDI measurements (Formulation 1, 0.010 - 0.025 mg/min/cm2; Formulation 2, 0.004 - 0.006 mg/min/cm2; Formulation 3, not measurable).
Case 2: HPMC Capsule Shell Behavior and Effect
Hydroxypropyl methylcellulose (HPMC) is often used as a shell material for capsule formulations because, unlike gelatin capsule shells, it has a low probability of cross-linking in the capsule during storage and stability studies. The HPMC shell was chosen for a BCS II drug with two dosage levels in early phase development for this reason. However, a problem was encountered when IND stability study started, the dissolution testing for the 150 mg capsule from the IND stability batch showed significant intermittent variation at early time points (<30 min) and S1 failures (<75Q at 30 min), which was not observed for the 40 mg capsule. The two dosage levels used a common batch granulation as the filler in different fill weights. It was found in initial investigation that the HPMC shell used for the two dosage levels of capsules are from the same vendor lot, but had different storage histories. The shell for the 150 mg batch had a higher level of moisture tested by Loss on Drying (LOD) in comparison with that for the 40 mg batch. Further dissolution testing was performed by exchange of the shells and the fillers for the two dosage levels of the capsules, as well as for the unused shells. Results showed that the drug release was slower in the shell from the 150 mg capsule shells with the 40 mg filler. Also the unused shells from the 150 mg batch dissolved much slower than that for the 40 mg batch. To understand the impact of the moisture level to the HPMC shell and the mechanism for the resulting change in dissolution rate, a study was conducted using UV surface dissolution imaging.
HPMC shells 4.07% moisture tested by LOD, were dried at 45 °C for 12 hours. The retested moisture level was 1.46% by LOD. A surface dissolution imager system was used for the UV imaging measurement. 0.01 N HCL was used as the medium, which was the same as used for the dissolution method in the stability study. Small discs (2 mm diameter) were cut from the dried and un-dried shells, and pressed onto SDI sample cups that had been prefilled with folded parafilm for support. The medium flow was controlled at 0.3 mL/min for 15 minutes and followed by stop flow for 5 minutes. Figure 4 shows the UV images of the dried and un-dried shells. It can be seen that the dried HPMC shell swelled due to hydration to a size that is two times that of the un-dried shell. Figure 5 shows the plots of the swelling height versus the run time. The initial swelling rate of the dried HPMC shell is 4 times greater that of the un-dried shell. Chiwele et al39 indicated that HPMC shells took up moisture during storage, which could lead to hydration of capsule shell walls. Water penetration through the hydrated material might be slower and thus the capsule shell would not dissolve readily. Results of the HPMC surface imaging are consistent with the literature that high moisture in the shell will impact the dissolution behavior of the shell.
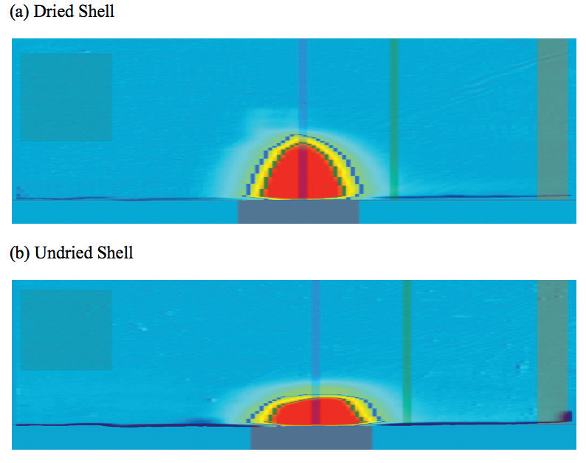 Figure 4. UV images of the dried and undried shells: Both were collected at 7 minutes of runtime with the same frame number. The swelling size of the dried HPMC shell is about two times of the undried shell.
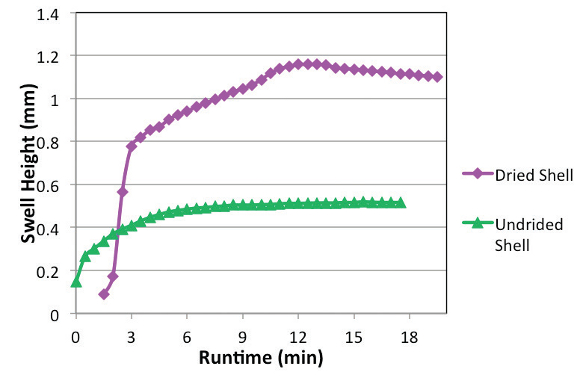 Figure 5. Plots of the swelling height versus the run time: The initial swelling rate of the dried HPMC shell is about 4 times greater than that of the un-dried shell.
Case 3: Study of Extended Release Formulation
Extended release (XR) oral solid dosage forms are a desirable choice for some medications in order to provide optimal exposure, maintain consistent therapeutic concentrations in the blood, and increase patient compliance. Drug release in the XR oral formulation is usually modulated by using functional polymers like HPMC. The physical and chemical properties of the functional polymer, such as viscosity (related to molecular weight), side chain substituents and the substitution degree, surface hydration and propensity for gel layer formation, have significant impact on the drug release.40 Since the drug release in the XR dosage forms is largely a surface phenomenon, UV surface imaging has been used during a study of an XR formulation using Metformin as a probe drug to understand the dissolution at the solid-liquid interface and the mechanism of the drug release, and thus allow for development of better control of API release rates.
HPMC based blends of Metformin HCl in two different grades of Methocel (were studied using A surface dissolution imager. Blend 1 used Methocel K 100LV with a low molecular weight and a low viscosity around 100 cP; Blend 2 used Methocel K 100M DC with a high molecular weight and a high viscosity around 100000 cP. Samples were prepared by compacting with a suitable amount of the blend into a SDI sample cup using 60 cNm torque. 0.05 M Phosphate buffer (pH6.8) was used as the dissolution medium with a flow program as follows: flow at 0.6 mL/min for 15 minutes, stop for 5 minutes, and then flush at 2 mL/min for 2 minutes for 2 minutes. The UV measurement was conducted at 254 nm.
The images of the two blends from the SDI study are displayed in Figure 6. Blend 1 had observable dissolution (~0.20 mg/min/cm2) in the flow condition; the API also diffused off the sample surface under the stop flow condition. In comparison, the Blend 2 exhibited higher swelling, but less significant API dissolution (~0.15 mg/min/ cm2) in the flow condition, and only slight diffusion at the stop flow condition. The swelling curves of the two blends versus time are displayed in Figure 7. Two distinctive swelling steps can be observed from the profiles: The first one is an initial “take-off” from 0 - 3 minutes; the second is a long growth period after the take-off from 3 - 15 minutes. It is interesting that the take-off slopes are different between the blends, but the post take-off slopes are very similar for the two blends. Further studies are needed to determine if the take-off is due to the gel layer formation, or rapid API dissolution from the surface layer of the solid compact, but the UV imaging has demonstrated that the take-off is dependant to the grade of the Methocel used. The blend with higher viscosity Methocel has a higher take-off rate. For the post take-off phase, however, the rate is slower than during the initial period, but independent of the grade of Methocel used. The UV SDI study enabled these observations that had not been seen before. Knowledge obtained from the study will be helpful for understanding the mechanism of the drug release in the HPMC containing dosage forms and for formulations design and development.
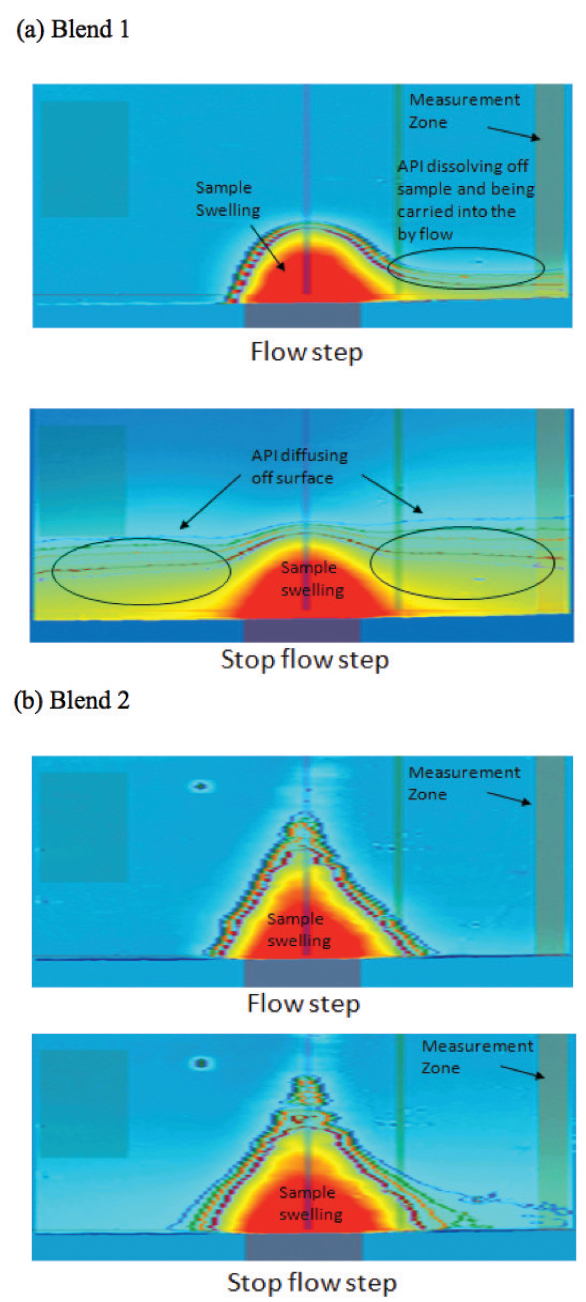 Figure 6. UV images of the two blends from the SDI study: (a) Blend 1 with Methocel grade K 100 LV, and (b) Blend 2 with Methocel grade K 100M DC.
 Figure 7. Swelling curves of the two blends versus time: (a) Measured using SDI; (b) Fitted lines for the swelling curves, Two distinctive swelling steps are observed: (1) Initial “take-off ” from 0 - 3 minutes; (2) A long growth period after the “take-off ”.
Conclusion
Dissolution testing has played an important role in pharmaceutical development and quality control through quantitative detection of drug release from solid oral dosage forms. It relies on spectroscopic detection for the quantification. UV detection has been the technique of choice for measurement of the bulk concentration and drug release profile in dissolution testing. Along with the advancement of modern spectroscopic imaging technologies, dissolution testing is expanding from solely detection of API release to include imaging of dissolution phenomena. Spectroscopic imaging enables observation of the dynamic dissolution process in-situ and monitoring of the changes on or close to the surface of the solid dosage sample with high spatial and temporal resolution. Imaging provides useful information for understanding the mechanism of drug release. In comparison with the other spectroscopic imaging technologies, UV imaging is simple, low-cost, commercially available, and sample-sparing for dissolution testing. Results obtained from UV surface dissolution imaging facilitated the selection of the right carrier for a co-precipitated API formulation, and confirmed the cause of a capsule dissolution failure was due to the high moisture level and slow dissolving of the HPMC shells. Two distinctive phases of swelling were observed using UV SDI during evaluation of an HPMC containing XR formulation. Further effort will be made using multiple wavelengths for measurement to improve differentiation of the absorption from the released API and obscuration of the light due to swelling excipients as encountered in the Case Studies. More applications and advancements can be expected in the industry using UV imaging for dissolution studies and formulation development.
Acknowledgements
The authors wish to acknowledge Divyakant Desai, Umesh Kestur, Limin Zhang, and Shih-Ying Chang for their input and assistance in the case studies.
Reference:
- FDA Guidance for Industry: “Dissolution Testing of Immediate Release Oral Solid Dosage Forms”, August 1997.
- US Pharmacopeia, General Chapter“ <711> Dissolution”, USP 38 - NF-33.
- US Pharmacopeia, General Chapter“ <1092> Dissolution method development and validation”, USP 38 - NF-33.
- M. Josefson, E. Johansson, A. Torstensson, “ Optical fiber spectrometry in turbid solutions by multivariate calibration applied to tablet dissolution testing”, Anal. Chem. 1988, 60 (24), 2666–2671.
- Cho, J. H.; Gemperline, P. J.; Salt, A.; Walker, D. S. “UV/visible spectral dissolution monitoring by in situ fiber optic probes”, Anal. Chem. 1995, 67 (17), 2858–2863.
- C. Schatz, M. Ulmschneider, R. Altermatt, S. Marrer, H. Altorfer, “Manual in situ fiber optic dissolution analysis in quality control”, Dissolution Technol. 2000, 7 (2), 6–13.
- X. Lu, R. Lozano, P. Shah, “In situ dissolution testing using different UV fiber optic probes and instruments”, Dissolution Technol. 2003, 10 (4), 6–15.
- L. Liu, T. Osei, J. Hsu. J. Greyling, “Evaluation of in-situ fiber optics dissolution method for compound A extended release tablets”, Am. Pharm. Rev. 2011, 14 (2).
- V.A. Gray, “Identifying sources of error and variability in dissolution calibration and sample testing.” Am. Pharm. Rev. 2002, 5 (2): 8-13.
- T. Catalano, “Essential Elements for a GMP Analytical Chemistry Department”, Springer Science & Business Media, 2013, P40-42, ISBN: 1461476429, 9781461476429.
- K. Singh, A. Marfatia, A. Bajaj, “Importance of visual observations in dissolution testing”, Express Pharm. Online, 2012, January, www.expresspharmaonline.com.
- C.A. Coutant, M.J. Skibic, G.D. Doddridge, C.A. Kemp, D.C. Sperry, “In vitro monitoring of dissolution of an immediate release tablet by focused beam reflectance measurement”, J. Mol. Pharm. 2010, 7 (5), 1508-1515.
- K.P. Nott, “Magnetic resonance imaging of tablet dissolution”, Eur. J. Pharm. Biopharm. 2010, 74 (1), 78-83.
- C.A. Fyfe, A.I. Blazek-Welsh, “Quantitative NMR imaging study of the mechanism of drug release from swelling hydroxypropylmethylcellulose tablets”, J Control Release, 2000, 68, 313–333.
- S. Strubing, T. Abboud, R.V. Contri, H. Metz, K. Mader, “New insights on poly (vinyl acetate)-based coated floating tablets: characterisation of hydration and CO2 generation by benchtop MRI and its relation to drug release and floating strength”, Eur. J. Pharm. Biopharm. 2008, 69: 708–717.
- P. Dorozynski, P. Kulinowski, R. Jachowicz, A. Jasinski, “Development of a system for simultaneous dissolution studies and magnetic resonance imaging of water transport in hydrodynamically balanced systems: A technical note”, AAPS PharmSciTech. 2007; 8(1): E109–E112.
- C. Chen, L.F. Gladden, M.D. Mantle, “Direct visualization of in vitro drug mobilization from Lescol XL tablets using two-dimensional 19F and 1H magnetic resonance imaging”, Mol. Pharm. 2014, 11: 630-637.
- M. Windbergs, M. Juma, H.L. Offerhaus, J.L. Herek, P. Kleinesbudde, C.J. Strachan, “Chemical imaging of oral solid dosage forms and changes upon dissolution using coherent anti-stocks Raman scattering microscopy”, Anal. Chem. 2009, 81 (6): 2085-2091.
- L. Peltonen, P. Liljeroth, T. Heikkila, K. Kontturi, J. Hirvonen, “Dissolution testing of acetylsalicylic acid by a channel flow method-correlation to USP basket and intrinsic dissolution methods”, Eur. J. Pharm. Sci. 2003, 19 (5) :395-401.
- J. Aaltonen, P. Heinanen, L. Peltonen, H. Kortejarvi, V.P. Tanninen, L. Christiansen, J. Hirvonen, J. Yliruusi, J. Rantanen, “In situ measurement of solvent-mediated phase transformations during dissolution testing”, J. Pharm. Sci. 2006, 95 (12): 2730-2737.
- A. Fussell, E. Garbacik, H. Offerhaus, P. Kleinebudde, C. Strachan, “In situ dissolution analysis using coherent anti-Stokes Raman scattering (CARS) and hyperspectral CARS microscopy”, Eur. J. Pharm. Biopharm. 2013, 85: 1141–1147.
- M. Savolainen, K. Kogermann, A. Heinz, J. Aaltonen, L. Peltonen, C. Strachan, J. Yliruusi, “Better understanding of dissolution behaviour of amorphous drugs by in situ solid-state analysis by means of Raman spectroscopy”, Eur. J. Pharm. Biopharm. 2009, 71 (1): 71-79.
- S.G. Kazarian, K.L.A. Chan, “‘Chemical photography’ of drug release”, Macromolecules, 2003, 36(26): 9866-9872.
- J. Van der Weerd, S.G. Kazarian, “Combined approach of FTIR imaging and conventional dissolution tests applied to drug release”, J. Control Release, 2004; 98: 295–305.
- P.S. Wray, G. Clarke, S.G. Kazarian, “Application of FTIR spectroscopic imaging to study the effects of modifying the pH microenvironment on the dissolution of ibuprofen from HPMC matrices”, J. Pharm. Sci. 2011, 100(11),
- P.S. Wray, G. Clarke G, S.G. Kazarian, “Dissolution of tablet-in-tablet formulations studied with ATR-FTIR spectroscopic imaging”, Eur. J. Pharm. Sci. 2013, 48: 748-757.
- J. Van der Weerd, S.G. Kazarian, “Release of poorly soluble drugs from HPMC tablets studied by FTIR imaging and flow-through dissolution tests”, J. Pharm. Sci. 2005, 94: 2096–2109
- J. Van der Weerd, S.G. Kazarian, “Validation of macroscopic attenuated total reflection- Fourier transform infrared imaging to study dissolution of swelling pharmaceutical tablets”, Appl. Spectrosc. 2004, 58(12):1413-1419.
- D. Ishikawa, K. Murayama, K. Awa, T. Genkawa, M. Komiyama, S.G. Kazarian, Y. Ozaki, “Application of a newly developed portable NIR imaging device to monitor the dissolution process of tablets”, Anal. Bioanal. Chem., 2013, 405 (29): 9401-9409.
- S. Wren, J. Lenke, “Pharmaceutical dissolution and UV imaging, Am. Lab. 2011, (2) Feb., ID: 914-1108.
- J. Ostergaard, F. Ye, J. Rantanen, A. Yaghmur, S.W. Larsen, C. Larsen, H. Jensen, “Monitoring Lidocaine single-crystal dissolution by ultraviolet imaging”, J. Pharm. Sci. 2011, 100 (8): 3405-3410.
- J.P. Boetker, M. Savolainen, V. Koradia, F. Tian, T. Rades, A. Mullertz, C. Cornett, J. Rantanen, J. Ostergaard, “Insights into the early dissolution events of amlodipine using UV imaging and Raman spectroscopy”, Mol. Pharm. 2011, 8: 1372–1380.
- F. Ye, A. Yaghmur, H. Jensen, S.W. Larsen, C. Larsen, J. Ostergaard, “Real-time UV imaging of drug diffusion and release from Pluronic F127 hydrogels”, Eur. J. Pharm. Sci. 2011, 43: 236–243.
- J. Ostergaard, E. Meng-Lund, S.W. Larsen, C. Larsen, K. Petersson, J. Lenke, H. Jensen, “Realtime UV imaging of nicotine release from transdermal patch”, Pharm. Res. 2010, 27 (12): 2614-2623.
- C. Zordan, X. Lu, “Examination of polymer swelling and API release of controlled release formulations at the solid-liquid interface by UV surface imaging”, 41st Annual Meeting of the Controlled Release Society, July, 2014.
- J. Pajander, S. Baldursdottir, J. Rantanen, J. Ostergaard, “Behaviour of HPMC compacts investigated using UV-imaging”, Int. J. Pharm. 2012, 427: 345– 353.
- X. Lu, “Application of Spectroscopic Imaging to Dissolution and Formulation Development”, AAPS 2013 Annual Meeting, November, 2013.
- S. Li, C. Pollock-Dove, L.C. Dong, J. Chen, A.A. Creasey, W.G Dai, “Enhanced bioavailability of a poorly water-soluble weakly basic compound using a combination approach of solubilization agents and precipitation inhibitors: A case study”, Mol. Pharmaceutics 2012, 9, 1100−1108.
- I. Chiwele, B.E. Jones, F. Podczeck, “The shell dissolution of various empty hard capsules”, Chem. Pharm. Bull. 2000, 48 (7) 951-956.
- C. Maderuelo, A. Zarzuelo, J.M. Lanao, “Critical factors in the release of drugs from sustained release hydrophilic matrices”, J. Controlled Release, 2011, 154: 2-19.
Author Biographies
Dr. Xujin Lu is a Senior Principal Scientist in Analytical and Bioanalytical Development at Bristol-Myers Squibb Company. He has over 20 years of experience in pharmaceutical analyses and keen interest in in-vitro drug release and dissolution. He received his Ph.D. from the University of Georgia. Prior to joining BMS, he was a postdoctoral fellow at the University of Illinois at Champaign-Urbana.
Dr. Christopher A. Zordan is a Senior Research Investigator at the Bristol-Myers Squibb Company. He has 10 years experience in analytical method development and validation supporting product development and stability testing. His current focus is on developing and expanding the use of new analytical techniques for drug development. He holds a PhD in analytical chemistry from the University of Delaware.